Re-balance Cycle Reminder All MyPlanIQ’s newsletters are archived here.
Regular AAC (Asset Allocation Composite), SAA and TAA portfolios are always rebalanced on the first trading day of a month. the next re-balance will be on Tuesday March 1, 2022.
As a reminder to expert users: advanced portfolios are still re-balanced based on their original re-balance schedules and they are not the same as those used in Strategic and Tactical Asset Allocation (SAA and TAA) portfolios of a plan.
Foreign Stocks And Global Asset Allocation
In this newsletter, we revisit and review foreign stocks (international developed and emerging market). Our goal is to again see whether these asset classes warrant more allocation weights, in light of their recent relatively low valuation and other conditions.
But first, let’s look at current market conditions as they have probably been in most people’s mind these days.
US stocks corrected violently
It turns out that this year’s January was the worst month for US stocks since the pandemic low in March 2020. Though the correction is not limited to US stocks, they did get hit hardest:
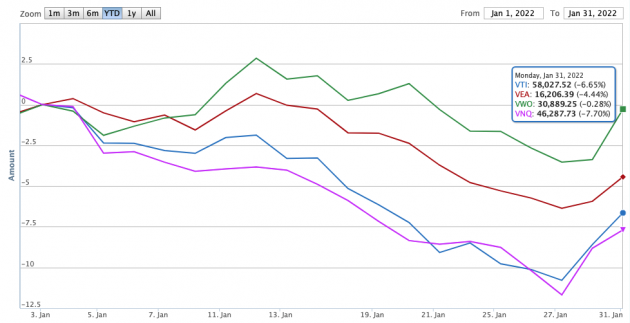
It’s interesting to see that VWO (Vanguard Emerging Market Stocks) almost recovered its loss while foreign developed market stocks VEA has also dropped much less than both US stocks (VTI) and US REITs (VNQ).
Of course, all of these are because foreign stocks had underperformed so much before this year:
| Ticker/Portfolio Name | YTD Return |
1Yr AR | 3Yr AR | 5Yr AR | 10Yr AR | 15Yr AR |
|---|---|---|---|---|---|---|
| VTI (Vanguard Total Stock Market ETF) | -6.7% | 17.2% | 20.1% | 16.2% | 15.0% | 10.1% |
| VNQ (Vanguard REIT ETF) | -7.7% | 27.6% | 13.3% | 9.4% | 9.8% | 6.1% |
| VEA (Vanguard FTSE Developed Markets ETF) | -4.4% | 6.1% | 11.0% | 8.5% | 7.4% | |
| VWO (Vanguard FTSE Emerging Markets ETF) | -0.28% | -4.6% | 9.5% | 8.1% | 4.2% | 4.5% |
AR: Annualized Return. YTD is not annualized.
The above comparison has been all too familiar to investors, especially US based investors. US stocks have been a consistent winner since 2009.
We also take a note that US REITs (VNQ) has also corrected more in January. It’s also noteworthy that REITs have done way much worse for the past 10 and 15 years than US stocks in general (such as VTI or S&P 500 SPY). We attribute this to the strength of growth stocks in an US stock index. Like other financial stocks, REITs have been considered to be ‘value’ or slow growth stocks and they are usually lagging behind in a growth driven market.
The above numbers are only for broad base indices. ARKK (Ark Innovation ETF), a growth stock representative, has lost over -22% for the month and its value has been cut by more than half since its peak in last February. Many high flying stocks have lost even more.
We’ll get back to current market condition later in this article. For now, let’s take a look at foreign stocks.
Cheap foreign stocks
The first thing to know about foreign stocks is that they are relatively much cheaper than the US stocks. The following chart compares Shiller CAPE (Cyclically Adjusted Price Earnings ratio) of US stocks, European stocks, Japan stocks and a few other emerging market stocks. CAPE is the ratio of price over last 10 trailing years’ average earnings. It smooths out a particular year’s earnings gyration.
The following CAPE charts are from Barclays.
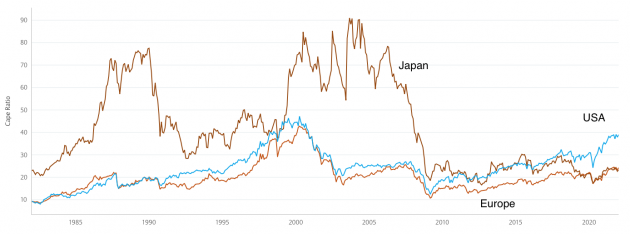
Since 2009, Europe’s CAPE has not even risen above its high in 2007. Japan’s CAPE trended down big time in the 2008 weak period. It then has been flat since. Relatively, it’s lower than the US, similar to Europe’s. The international developed market stocks mostly consist of European and Japanese stocks. At the moment, these stocks are about 40% cheaper than the US.
The following chart further compares US CAPE with the CAPEs of a few countries in the MSCI emerging market stock index.
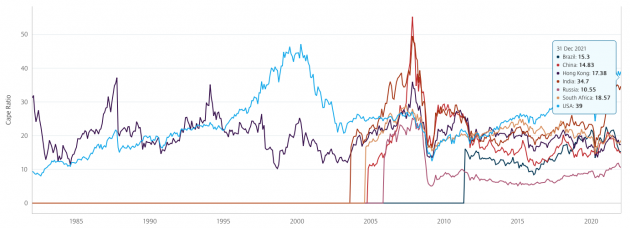
Other than India, all other emerging market countries’ CAPEs are only about 40% or less of the US CAPE. So the discount is even bigger.
In addition to their cheapness, another argument to support emerging market stocks is that after the world exits the current pandemic, emerging market economies will recover faster than the US and thus their stock prices will recover more too.
However, it should be noted that emerging markets are much riskier and thus investors would certainly demand a bigger discount. Furthermore, in the event of the next bear market, emerging market stocks will usually suffer from bigger loss. We don’t see that this will be an exception going forward.
Currency effect on foreign stocks
Another important factor to look at foreign stocks is the currency effect. Note that the foreign stock ETFs we use in the above (as well as in our portfolios) such as VEA and VWO are US dollar-denominated. What that means is that a fund like VEA (Vanguard FTSE developed market stock ETF) takes investors’ US dollars and then convert them to a local currencies like Euro and then use the local currencies to buy local stocks. The daily value of this ETF is to take its local holdings’ local currency value (such as Euro in this example) and then convert it back to US dollar. So when an investor sells the ETF in open markets, she/he gets back US dollars (for US based investors).
From the above description, one can see that VEA and VWO are subject to the fluctuation US dollar exchange value to other local currencies. Some so called ‘currency hedged’ ETFs try to mitigate the effect by using currency derivatives (such as US dollar to Euro futures) to make sure the conversion is maintained at a constant level. Of course, as nothing is free, these hedged ETFs need to pay some cost for purchasing these futures. Furthermore, one can see that as ETFs like VWO need to invest in many countries so it can be only a rough measure to accurately hedge against each country’s currency.
In the following, we compare hedged vs. unhedged ETFs for both international and emerging market ETFs. To make comparison more accurate, we use EFA and EEM for developed market stock ETFs (in place of VEA) and emerging market stocks ETFs (in place of VWO) respectively.
| Ticker/Portfolio Name | YTD Return* |
1Yr AR | 3Yr AR | 5Yr AR | 10Yr AR | AUM ($B) |
|---|---|---|---|---|---|---|
| HEFA (iShares Currency Hedged MSCI EAFE ETF) | -2.6% | 16.6% | 12.4% | 9.7% | $3.3 | |
| EFA (iShares MSCI EAFE) | -5.0% | 4.7% | 9.8% | 7.6% | 6.8% | $55 |
| HEEM (iShares Currency Hedged MSCI Emerging Markets ETF) | -3.0% | -9.6% | 8.2% | 7.8% | $0.19 | |
| EEM (iShares MSCI Emerging Markets) | -0.0% | -9.0% | 6.5% | 7.8% | 3.6% | $29 |
| UUP (PowerShares DB US Dollar Bullish ETF) | 0.9% | 5.4% | 1.3% | 0.7% | 2.0% |
AUM: Asset Under Management (in billion)
In the table, we also include UUP (PowerShares DB US Dollar Bullish ETF) that tracks US dollar value against a basket of other currencies. We can see that for the past 10 years, US dollar value has risen 2% against other currencies annually. For the past 3 years, it has risen 1.3% annually.
The hedged ETFs have outperformed unhedged ETFs by 2%-3% annually. This is certainly very meaningful. On the other hand, both hedged ETFs have much lower AUM (Asset Under Management) and thus less liquid. In fact, this has been one of our major concerns that make us hesitate to employ these ETFs.
Foreign stock exposure
From the above, we can see that foreign stocks (both developed and emerging markets) have been affected by their lower valuation as well as currency weakness against US dollar.
Regarding whether we should increase foreign stock exposure in our standard Asset Allocation Composite (AAC) based portfolios, we make the following observations:
- The relative lower valuations (thus cheaper) of foreign stocks are partially justified as in comparison, US is still a large, single uniform economic entity that boasts of more economic stability and free market (thus more shareholder friendly). Enterprises can leverage this uniform large market to scale and grow their products and services rapidly. This means it’s reasonable for investors to demand higher risk premium for stocks in other smaller and more fragmented markets. We believe that the foreign stock discounts are not as deep as what CAPE numbers in the above suggest. However, they are still cheaper even after taking the risk premium into account.
- US dollar strength has played a big role in making unhedged foreign stocks cheaper. It’s likely we might see a dollar weakness in the future that will reverse this secular trend.
- Our take is that tactically, before the next global bear market, unhedged foreign stocks might benefit from lower valuation and lower foreign currency prices. This would make them more attractive than US stocks after US stocks recover from their current correction lows (assuming the correction doesn’t develop into a full blown bear market). However, when the next bear market hits, we believe foreign stocks might suffer from as big or bigger loss than US stocks. In a word, it’s possible to be tactically allocate more to foreign stocks after the current correction runs its course.
- Regarding currency hedged foreign ETFs, we believe it’s still better off to leave these to more expert investors. We will revisit this in the future.
For expert subscribers, portfolios like P Composite Momentum Scoring Global Risk Assets on Advanced Strategies page already have a balanced allocation to foreign stocks when they have highest momentum scores. They will be able to take advantage of the strength of foreign stocks when their time comes.
Market Overview
Based on FactSet, one third of S&P 500 companies had reported their Q4 earnings last week and so far, the blended earnings (actual and expected) have constantly exceeded previous week’s number. As of last Friday, the blended earnings growth was 24.3%, better than 21.8% on 1/13/2021 that’s better than 21.4% expected on December 31, 2021.
Markets are now recouping loss fast. Currently, the Federal Reserve’s indication of interest rate hikes are countered by the possible economic slowdown that have been warned by several economists (including Goldman Sachs and Morgan Stanley). The Atlanta Fed’s GDPNow gauge is even forecasting a first-quarter GDP gain of just 0.1%. In essence, it’s not all clear that inflation will persist and/or economies can continue their recent strength. One might frame this period as interesting. In reality, however, it’s likely for this period to turn out to be a precursor to a big correction or to a big inflation dominated investment theme that’s been long forgotten for several decades.
In light of the current volatile markets, we call for caution and advocate the following practice:
- For strategic allocation (buy and hold) investors, ignore the current market behavior. Remember, as what we have emphasized numerous times, when you choose and commit to a strategic portfolio, you essentially know and commit that your investment horizon (or the time you need to utilize this capital) is 20 years or longer. As we pointed out, if your investments are those diversified (index) funds such as an S&P 500 index fund (VFINX, for example), you know your money is in some solid ‘business’ that eventually (20 years later) will deliver some reasonable returns. As long as you are comfortable with this thesis, you should sit tight and forget about the current gyration.
- For tactical investors, again, you have to ignore the current market noise. Furthermore, you should follow your strategy rigorously, especially in a time like this. Human emotion, both optimistic and pessimistic, and human desire, both greedy and fearful, are your worst enemies. This has been shown to be true time and time again.
Stock valuation is still extremely high by historical standard. For the moment, we believe it’s prudent to be cautious while riding on market uptrend. However how serious a correction might be, we have confidence in the US economy in the long term and thus in the stocks in aggregate. We just need to manage through interim losses carefully.
We again would like to emphasize that for any new investor and new money, the best way to step into this kind of markets is through dollar cost average (DCA), i.e. invest and/or follow a model portfolio in several phases (such as 2 or 3 months) instead of the whole sum at one shot.
Enjoy Newsletter
How can we improve this newsletter? Please take our survey
–Thanks to those who have already contributed — we appreciate it.
Latest Articles
- January 18, 2022: Steady And Consistency Win In The Long Term
- January 3, 2022: The Year In Rear View: Portfolio And Asset Class Review
- December 13, 2021: Present And Future
- November 22, 2021: The ‘Best’ Balanced Fund Revisited
- November 15, 2021: Q&A On MyPlanIQ Strategies And Portfolios
- November 8, 2021: Major Asset Returns In The Past Twenty Years
- November 1, 2021: Latest Momentum Factor ETFs Review
- October 25, 2021: A Long Term Theme Or Trend Doesn’t Necessarily Yield Good Returns
- October 18, 2021: Dimensional Fund Advisors DFA ETFs
- October 11, 2021: MyPlanIQ Ultra Short Term Bond Portfolio vs. Other Funds
- October 4, 2021: Asset Trends, Market Internals And Inflation Implication
- September 27, 2021: Newsletter Collection Update
- September 20, 2021: Benchmarking MyPlanIQ Fixed Income Bond Portfolios
- September 13, 2021: Benchmarking MyPlanIQ Tactical Portfolios
- August 30, 2021: Invest And Speculate: A Sensible Alternative To Buy And Hold
- August 23, 2021: Style ETF Portfolio Review
- August 16, 2021: Smart Factor ETFs Review
- August 9, 2021: Best Global Allocation Funds vs. MyPlanIQ ETF Portfolios
- August 2, 2021: Major Asset Trends And Market Internals
- July 26, 2021: Ultra Short Term Bond ‘Money Market’ Portfolio And Banking
- July 19, 2021: Take The Challenge of The ‘Best’ Balance Fund
- July 12, 2021: The Long Forgotten Bear Market Cycles
- June 28, 2021: Resuming Growth Trends Chaotically?
- June 21, 2021: Stocks Are Not Replacement Of Bonds
- June 14, 2021: Outperform The Best Performing PIMCO Income Bond Fund
- June 7, 2021: “Good” S&P Sectors
- May 17, 2021: Total Return Bond ETFs Review
- May 10, 2021: Financial Independence & Early Retirement
- May 3, 2021: Inflation, Sub Zero Interest Rate …
- April 26, 2021: The Best Active Fixed Income Funds Are Still Hard To Beat
- April 19, 2021: New And Old Useful Features
- April 12, 2021: Risk Parity Funds In Current Environment
- April 5, 2021: DoubleLine Shiller CAPE 10 Based Funds Update
- March 29, 2021: International Stocks vs. US Stocks
- March 22, 2021: Ultra Short Term Bond ETF Portfolio As A Money Market Fund
- March 15, 2021: Make Your Own Private Bank
- March 8, 2021: The Not So Orderly Market Rotation Amid Rising Bond Yields
- March 1, 2021: Average 20% Annual Returns: The Upper Bound Of Stock Investments?!
- February 22, 2021: Rising Bond Yields And Current Stock Trends
- February 8, 2021: Total Return Bond ETFs Review
- February 1, 2021: REITs And Major Asset Trends
- January 25, 2021: Industry ETFs And ARK ETFs Portfolios
- January 11, 2021: Smart Cash Management: Can I Just Withdraw From My Bond Portfolio?
- January 4, 2021: Our Investment Philosophy For 2021 And Beyond
- December 14, 2020: Style and Factor ETFs Portfolio Reviews
- December 7, 2020: A Really Long Term (30 Years) Stock Returns
- November 30, 2020: Higher Return Portfolios: Part 2
- November 16, 2020: Higher Return Portfolios
- November 9, 2020: Fixed Income Funds Update
- November 2, 2020: Polls Are Useless vs. This Investment Strategy Doesn’t Work!
- October 26, 2020: Recent Improvements
- October 19, 2020: REIT Indexes As Businesses
- October 12, 2020: Stock Indexes As Businesses
- October 5, 2020: Asset Trend Review
- September 28, 2020: Retirement Spending: Your Portfolio’s Volatility Matters
- September 21, 2020: Boring Utility Stocks Are Excellent Long Term Winners
- September 14, 2020: Surprised, Active Fixed Income Investors Have Done Better Than Stock Investors For The Last 20 Years!
- August 31, 2020: Investing In An Ultra-Low Return Environment
- August 24, 2020: Target Maturity Bond ETFs For Short Term Cash
- August 17, 2020: Newsletter Collection Update
- August 10, 2020: Fixed Income In A Speculative Era
- August 3, 2020: Sound Investment Strategies
- July 27, 2020: Total Return Bond Funds Update
- July 20, 2020: Divergence Between Value And Growth Stocks Everywhere
- July 13, 2020: Short Term Cash, Treasury Bills, CDs And Future Fixed Income
- July 6, 2020: Bond ETFs vs. Bond Mutual Funds
- June 29, 2020: Industry Sector ETF Rotation With Composite Momentum
- June 22, 2020: Industry Sector Rotation With Composite Momentum
- June 15, 2020: Advanced Minimum Equity Portfolios
- June 8, 2020: Recent Positive Developments
- June 1, 2020: Minimum Equity Portfolios
- May 18, 2020: Core Satellite Portfolios In The Current Pandemic
- May 11, 2020: Asset Trends Review
- May 4, 2020: The Real, Sensible And Wise Warren Buffett
- April 27, 2020: Total Return Bond Funds & Portfolios
- April 20, 2020: Multi-Factor ETFs and Rotation
- April 13, 2020: A Closer Look At 401(k) Investment Portfolios
- April 6, 2020: Long Term Stock Market Timing Since 1871 Revisited
- March 30, 2020: How Did Bond ETFs And Mutual Funds Fare In The Current Crisis?
- March 23, 2020: Chaos And Hope
- March 16, 2020: A Live Lesson
- March 9, 2020: Risk And Reward
- March 2, 2020: The Risk Of Coronavirus Outbreak
- February 24, 2020: Long Term Stock Valuation Based Investment Strategies
- February 10, 2020: Update On Short Term Cash, Treasury Bills and Brokered CDs
- February 3, 2020: Investment Landscape For Retirees And Would-be Retirees: Stocks
- January 27, 2020: Investment Landscape For Retirees And Would-be Retirees: Fixed Income
- January 13, 2020: Portfolio Performance: A Walk In The Past II
- January 6, 2020: Asset Outlook and Portfolio Strategies
- December 16, 2019: Q&As On Our Services
- December 9, 2019: Portfolio Constructions For Advanced Users
- December 2, 2019: Newsletter Collection Update
- November 25, 2019: Core ETFs or Core Mutual Funds Portfolios
- November 18, 2019: Introducing MyPlanIQ Asset Allocation Composite Strategy
- November 11, 2019: Market Indicator And Momentum
- November 4, 2019: Factor ETF Rotation
- October 28, 2019: Multi-factor ETFs vs. Equal Weight Multi-Factor Portfolios
- October 21, 2019: Multi-factor ETFs: Value And Momentum
- October 14, 2019: Low Volatility Factor ETFs
- October 7, 2019: Zero Commission Era Has Arrived, Is It Really That Good?
- September 30, 2019: Boosting Bond ETF Portfolio’s Return With Muni Bond ETFs
- September 23, 2019: Value ETFs
- September 16, 2019: Factor ETFs
- September 9, 2019: Momentum Factor Stock ETFs
- August 26, 2019: Employer 401k Match: Yet Another Free Lunch Not To Be Missed
- August 19, 2019: PIMCO Income Fund and Other Total Return Bond Funds Update
- August 12, 2019: Aggressive Fixed Income Portfolios?
- August 5, 2019: Long Term Investment Strategies And Short Term Market Noises
- July 29, 2019: Fixed Income Portfolios In A Lower Yield Environment
- July 22, 2019: Core Satellite Portfolios Balance Fluctuation
- July 15, 2019: Quality Stock Factor ETFs
- July 8, 2019: Surprise! Brokerages Make Most From Your Cash, Not Commissions
- July 1, 2019: Utilities Sector Review
- June 24, 2019: Asset Allocation Funds Review
- June 17, 2019: Latest Performance Comparison Among Several Advanced Strategies
- June 10, 2019: Money Market And Ultra Short Term Bond Funds
- June 3, 2019: What We Can Learn From The Seasonality Strategy
- May 20, 2019: Morningstar Portfolio Manager Awards
- May 13, 2019: Total Return Bond ETFs Review
- May 6, 2019: Global Allocation Revisited
- April 29, 2019: Asset Trend Review
- April 22, 2019: The Current State Of Fixed Income
- April 15, 2019: The Importance Of Fixed Income Returns For Retirement Spending
- April 8, 2019: Newsletter Collection Update
- April 1, 2019: S&P 500 As A Business
- March 25, 2019: Health Care Sector Review
- March 18, 2019: The Risk Of Stock Investing
- March 11, 2019: Consumer Staples Sector Review
- March 4, 2019: Global Stock Valuation Update
- February 25, 2019: ‘Bad’ Tactical Strategy
- February 11, 2019: “Best” Balanced Fund And Portfolios Revisited
- February 4, 2019: Cash And Money Market Funds: Interests And Safety
- January 28, 2019: Fixed Income Review
- January 14, 2019: Tactical Asset Allocation Portfolio Review
- January 7, 2019: Global Strategic Asset Allocation Portfolio Review
- December 17, 2018: Robinhood’s ‘Revolution’ Or Gimmick
- December 10, 2018: How Defensive Are REITs?
- December 3, 2018: Conservative Core Satellite Portfolio
- November 26, 2018: Allocation Mutual Fund Review
- November 19, 2018: Is The Recent Downtrend Sustainable?
- November 12, 2018: The Staggering Low Interest Rates From Big Banks
- November 5, 2018: The ‘Right’ Or ‘Wrong’ Decision
- October 29, 2018: Taxable Total Return Bond Plus Muni Bond Fund Based Portfolios
- October 22, 2018: DoubleLine Shiller CAPE 10 Based Fund Review
- October 15, 2018: Newsletter Collection Update
- October 8, 2018: Asset Trend Review
- October 1, 2018: Taxable vs. Tax Exempt High Yield Bonds
- September 24, 2018: High Yield Bonds In A Rising Rate Environment
- September 10, 2018: Value, Growth And Blend Stock Style Investing
- August 27, 2018: Money Market ETFs?
- August 20, 2018: How Momentum Investing Stacks Up?
- August 13, 2018: Total Return Bond ETF
- August 6, 2018: Fidelity Zero-Fee Index Funds
- July 30, 2018: Tax Efficient Portfolios
- July 23, 2018: Municipal Bond Funds And Portfolios
- July 16, 2018: A Guide To Conservative Portfolios
- July 9, 2018: Conservative Allocation Mutual Funds Based Portfolios
- July 2, 2018: Small Cap Stocks For The Long Term
- June 25, 2018: What Can We Learn From GE’s Removal From Dow Jones Index?
- June 18, 2018: The ‘Best’ Balanced Portfolio Continues To Excel
- June 11, 2018: Is 10 Year Long Enough For Portfolio Comparison?
- June 4, 2018: Action Plan: Risk Review For Investments
- May 21, 2018: Rising Rates, Consumer Staples And Stock Index
- May 14, 2018: Newsletter Collection Update
- May 7, 2018: Money Market Fund Taxonomy
- April 30, 2018: Momentum Investing Review
- April 23, 2018: Commodities In Current Environment
- April 16, 2018: Municipal Bonds As A Fixed Income Asset Class
- April 9, 2018: Exponential Or Compounding Nature In Investing
- April 2, 2018: Inside Of The Stock Chaos
- March 26, 2018: Total Return Bond Update
- March 19, 2018: Treasury Bills vs. Brokered CDs
- March 12, 2018: Defensive Conservative Portfolio Review
- March 5, 2018: Warren Buffett’s Advices
- February 26, 2018: Pros And Cons of Strategic And Tactical Portfolios In 2018
- February 12, 2018: Trend Review
- February 5, 2018: Market Selloff And Long Term Investing
- January 29, 2018: The New Addition To Our Total Return Bond Fund Candidates
- January 22, 2018: Where Are Bonds Heading?
- January 15, 2018: Tactical Portfolios Review
- January 8, 2018: Strategic Portfolios Review
- December 18, 2017: Record Highs And Risk
- December 11, 2017: Cash Return And Interest Rate Update
- December 4, 2017: Mutual Fund Star Ratings: Are They Useful?
- November 20, 2017: Thankful And Mindful
- November 13, 2017: Is This A Good Time For Retirees Or Would Be Retirees?
- November 6, 2017: Newsletter Collection Update
- October 30, 2017: Rising Interest Rates
- October 23, 2017: A Primer For Portfolios
- October 16, 2017: REITs As An Asset Class
- October 9, 2017: Conservative Portfolios Revisited
- October 2, 2017: The Role of Short Term Bond Funds
- September 25, 2017: Fees In Cash Investments
- September 18, 2017: Conservative Portfolios Review
- September 11, 2017: International Diversification Effect
- September 4, 2017: Invest And Speculate Revisited
- August 28, 2017: Total Return Bond Fund Portfolios: Where Do They Fit?
- August 21, 2017: Portfolio Performance: A Walk In The Past
- August 14, 2017: Fidelity Commission Free ETFs Update
- August 7, 2017: I Didn’t Learn Anything — Mistake vs. Temporary Underperformance
- July 31, 2017: Asset Classes And Fund Choices: A Primer
- July 24, 2017: Total Return Bond Fund Portfolios And Cash
- July 17, 2017: Long Term Stock Holding Periods For Retirement
- July 10, 2017: Half Year Asset Trend Review
- June 26, 2017: How To Beat The Best Balanced Allocation Fund
- June 19, 2017: Newsletter Collection Update
- June 12, 2017: A Mixed Bag Performance of Momentum Investing
- June 5, 2017: How To Start A New Portfolio
- May 29, 2017: Alternative Assets And Their Role In Portfolios
- May 22, 2017: Summer Seasonality And Portfolio Management
- May 15, 2017: Cash: Banking Or Investing?
- May 8, 2017: Holding Period of Long Term Timing Portfolios
- May 1, 2017: Debate on Risk vs. Volatility
- April 24, 2017: The Long Term Stock Market Timing Return Since 1871
- April 17, 2017: Risk vs. Volatility: Long Term Stock Market Returns
- April 10, 2017: Total Return Bond ETFs And Portfolios
- April 3, 2017: Quarter End Asset Trend Review
- March 27, 2017: Practical Consideration For IRAs And 401k Accounts
- March 20, 2017: Fund Fees: That’s (Still) Outrageous
- March 13, 2017: Long Term Stock Valuation Review
- March 6, 2017: Asset Classes for Retirement Investments
- February 27, 2017: Fidelity Total Bond Fund Review
- February 20, 2017: Long Term Stock Timing Based Portfolios And Their Roles
- February 13, 2017: Alternative Investment Portfolios Review
- February 6, 2017: Tax Free Municipal Bond Investments Review
- January 30, 2017: Brokerage Specific Conservative Portfolios
- January 23, 2017: Fixed Income Portfolio Review
- January 16, 2017: Long Term Trend Following Portfolio Review
- January 9, 2017: Tactical Asset Allocation Review
- January 3, 2017: Strategic Asset Allocation Review
- December 12, 2016: Enhanced Index Funds
- December 5, 2016: Review Of Broad Base Core Mutual Funds For Brokerages
- November 28, 2016: Core Index ETFs Review
- November 21, 2016: International Exposure Of U.S. Large Companies
- November 14, 2016: Asset Trends After The Election
- November 7, 2016: Rising Rate And Current Bond Trend
- October 31, 2016: Economy Power And Long Term Stock Returns
- October 24, 2016: Current Commodity Trend And Managed Futures
- October 17, 2016: Investment Mistakes And Good Or Bad Investment Strategies
- October 10, 2016: Momentum Investing Review
- October 3, 2016: Survey & Feedback
- September 26, 2016: Fixed Income Investing: Actively Managed Funds vs. Index Funds
- September 19, 2016: Stock Investing: Actively Managed Funds vs. Index Funds
- September 12, 2016: Newsletter Update
- September 5, 2016: Overvalued Markets And Long Term Timing Strategies
- August 29, 2016: Your 401K Finally Draws Attention
- August 22, 2016: Inflation Protected Securities TIPS For Current Overvalued Markets
- August 15, 2016: Risk On: Emerging Market Stocks And Small Cap Stocks
- August 8, 2016: Portfolio Construction Using Stock ETFs And Bond Mutual Funds
- August 1, 2016: Adding Value To Your Own Investments
- July 25, 2016: Tactical Asset Allocation Funds Review
- July 18, 2016: Strategic Asset Allocation & Lazy Portfolio Review
- July 11, 2016: Asset Trend Review
- June 27, 2016: Secular Cycles For Tactical And Strategic Investment Strategies
- June 20, 2016: A World of Debt
- June 13, 2016: Managed Futures For Portfolio Building
- June 6, 2016: Newsletter Summary
- May 30, 2016: Swensen Portfolio And Permanent Portfolios
- May 23, 2016: AAII Article And Some Web Changes
- May 16, 2016: The PIMCO (Dis)Advantages
- May 9, 2016: Boost Your Dull Summer Investments
- May 2, 2016: Low Cost Index Fund Investing
- April 25, 2016: Tax Free Municipal Bond Funds & Portfolios
- April 18, 2016: Asset Class Trend Review
- April 11, 2016: Construction of Sound And Conservative Portfolios
- March 28, 2016: Total Return Bond ETFs Review
- March 21, 2016: Small And Large Company Stock Performance In Different Economic Expansion Cycles
- March 14, 2016: Are Tactical And Timing Strategies Losing Steam?
- March 7, 2016: Defined Maturity Bond Fund Analysis
- February 29, 2016: Smart Strategic Asset Allocation Rebalance When Market Trend Changes
- February 22, 2016: Be Cash Smart
- February 15, 2016: Bond ETF Portfolios
- February 8, 2016: Newsletter Collection Update
- February 1, 2016: Total Return Bond Fund Portfolios In A Volatile Period
- January 25, 2016: Alternative Portfolios Review
- January 18, 2016: Strategic Asset Allocation: A Cautious Outlook
- January 11, 2016: Review Of Trend Following Tactical Asset Allocation
- January 4, 2016: What Worked And Didn’t In 2015
- December 21, 2015: Distressed Assets
- December 14, 2015: High Yield Bonds And Their Correlation With Stocks
- December 7, 2015: Diversification And Global Allocation
- November 30, 2015: Investors and Speculators Combined
- November 23, 2015: Active Stock Fund Performance Consistency
- November 16, 2015: Permanent, Risk Parity And Alternative Portfolios Review
- November 9, 2015: Broad Base Core Mutual Fund Review
- November 2, 2015: Broad Base Index Core ETFs Review
- October 26, 2015: Total Return Bond Fund Review
- October 19, 2015: Advanced Portfolio Review
- October 12, 2015: What About Commodities?
- October 5, 2015: Core Satellite Portfolios In A 401k Account
- September 28, 2015: Risk Managed Strategic Asset Allocation Portfolios Revisited
- September 21, 2015: Quest For The Best Investment Strategy
- September 14, 2015: Core Satellite Portfolios In Market Turmoil
- September 7, 2015: Market Rout Creates An Opportunity to Reposition Your Portfolios
- August 31, 2015: Review of Asset Allocation Funds and Portfolios
- August 24, 2015: Market Rout And Your Portfolios
- August 17, 2015: ETF or Mutual Fund Based Portfolios
- August 10, 2015: Updated Newsletter Collection
- August 3, 2015: Slippery Asset Trends
- July 27, 2015: Performance Dispersion Among Momentum Based Portfolios
- July 20, 2015: Global Balanced Portfolio Benchmarks
- July 13, 2015: Pain in Tactical Portfolios
- July 6, 2015: Fixed Income Total Return Bond Funds In Strategic Asset Allocation Portfolios
- June 29, 2015: Core ETF Commission Free Portfolios
- June 22, 2015: Secular Asset Trends
- June 15, 2015: Giving Up Bonds?
- June 1, 2015: Summer Blues?
- May 26, 2015: Cash, Bonds and Stocks In A Rising Rate Environment
- May 18, 2015: Portfolio Update
- May 11, 2015: Pain in Fixed Income?
- May 4, 2015: The Balanced Stock and Long Term Treasury Bond Portfolios
- April 27, 2015: Long Term Treasury Bond Behavior
- April 20, 2015: 529 College Savings Plan Rebalance Policy Change
- April 13, 2015: Total Return Bond Funds As Smart Cash
- April 6, 2015: The Low Return Environment
- March 30, 2015: Brokerage Specific Core Mutual Fund Portfolios 2
- March 23, 2015: Investment Arithmetic for Long Term Investments
- March 16, 2015: Brokerage Specific Core Mutual Fund Portfolios
- March 9, 2015: Newsletter Collection Update
- March 2, 2015: Total Return Bond ETFs
- February 23, 2015: Why Is Global Tactical Asset Allocation Not Popular?
- February 16, 2015: Where Are Permanent Portfolios Going?
- February 9, 2015: How Have Asset Allocation Funds Done?
- February 2, 2015: Risk Management Everywhere
- January 26, 2015: Composite Portfolios Review
- January 19, 2015: Fixed Income Investing Review
- January 12, 2015: How Does Trend Following Tactical Asset Allocation Strategy Deliver Returns
- January 5, 2015: When Forecast Fails
- December 22, 2014: Long Term Asset Returns: How Long Is Long?
- December 15, 2014: Beaten Down Assets
- December 8, 2014: Implementing Core Asset Portfolios In a Brokerage
- December 1, 2014: Two Key Issues of Investment Strategies
- November 24, 2014: Holiday Readings
- November 17, 2014: Retirement Spending Portfolios Update
- November 10, 2014: Fixed Income Or Cash
- November 3, 2014: Asset Trend Review
- October 27, 2014: Investment Loss, Mistakes And Market Cycles
- October 20, 2014: Strategic Portfolios With Managed Volatility
- October 13, 2014: Embrace Volatility
- October 6, 2014: Tips For 401k Open Enrollment
- September 29, 2014: What Can We Learn From Bill Gross’ Departure From PIMCO?
- September 22, 2014: Why Total Return Bond Funds?
- September 15, 2014: Equity And Total Return Bond Fund Composite Portfolios
- September 8, 2014: Momentum Based Portfolios Review
- September 1, 2014: Risk & Diversification: Mint.com Interview
- August 25, 2014: Remember Risk
- August 18, 2014: Consistency, The Most Important Edge In Investing: Tactical Case
- August 11, 2014: What To Do In Overvalued Stock Markets
- August 4, 2014: Is This The Peak Or Correction?
- July 28, 2014: Stock Musings
- July 21, 2014: Permanent Portfolios & Four Pillar Foundation Based Framework
- July 14, 2014: Composite Portfolios Review
- July 7, 2014: Portfolio Behavior During Market Corrections
- June 30, 2014: Half Year Brokerage ETF and Mutual Fund Portfolios Review
- June 23, 2014: Newsletter Collection Update
- June 16, 2014: There Are Always Lottery Winners
- June 9, 2014: The Arithmetic of Investment Mistakes
- June 2, 2014: Tips On Portfolio Rebalance
- May 26, 2014: In Praise Of Low Cost Core Asset Class Based Portfolios
- May 19, 2014: Consistency, The Most Important Edge In Investing: Strategic Case
- May 12, 2014: How To Handle An Elevated Overvalued Market
- May 5, 2014: Asset Allocation Funds Review
- April 28, 2014: Now The Economy Backs To The ‘Old Normal’, Should Our Investments Too?
- April 21, 2014: Total Return Bond Investing In The Current Market Environment
 Diversified Asset Allocation Portfolios For Your Plans
