Resuming Growth Trends Chaotically?
The current financial markets are somewhat confusing and chaotic: investors seem to adopt and abandon growth/value stocks and large/small stocks randomly. Let’s review the recent asset trends.
Raging commodities & dumped Treasury bonds
For the very first time since many years ago (well since 2007?), commodities are finally seeing their days, rising on the top among major assets’ trend ranking:
Major Asset Classes Trend (as of 6/25/2021): Table 1
| Description | Symbol | Trend Score |
|---|---|---|
| Commodities | DBC | 21.0% |
| US Equity REITs | VNQ | 16.33% |
| US Stocks | VTI | 15.63% |
| Emerging Market Stks | VWO | 12.6% |
| International Developed Stks | VEA | 12.26% |
| Inflation Protected Bonds | TIP | 2.04% |
| Total US Bonds | BND | -0.25% |
| 10-20 Year Treasury Bonds | TLH | -3.16% |
The above table shows a fast growth driven risk appetite in a rising inflation environment. It’s of course not hard to understand this as global (at least the US) economy is now recovering strongly while the Covid pandemic is more and more contained.
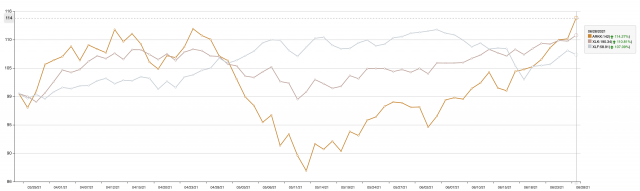
However, commodities have shown their typical unstable trend, it’s been rising and falling along the way for the past 12 months, compared with US stocks:
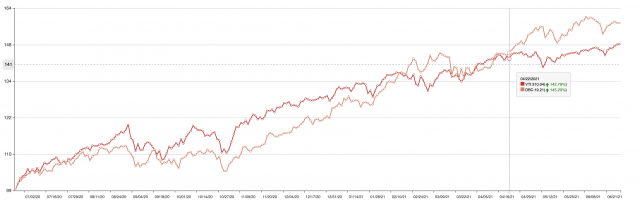
To be more precise, commodities (DBC) really started to overtake US stocks (VTI) in late April, just about two months ago.
A close up look at the following chart shows that long term Treasury bonds (so called ‘safe’ asset or an asset often shows investors’ flight to safety attitude) actually has started to recover since mid March:
Among commodities, oil price is the biggest factor:
Commodities Trend (as of 6/25/2021)
| Description | Symbol | 52 Weeks | Trend Score |
|---|---|---|---|
| US Oil | USO | 83.66% | 34.37% |
| Energy | DBE | 73.18% | 29.36% |
| Natural Gas | UNG | 36.13% | 24.67% |
| Commodity | DBC | 57.59% | 21.0% |
| Base Metals | DBB | 48.19% | 13.06% |
| Agriculture | DBA | 35.49% | 9.67% |
| Silver | SLV | 45.4% | 9.0% |
| Precious Metals | DBP | 4.75% | -0.79% |
| Gold | GLD | 0.03% | -1.69% |
Oil price almost doubled in the last one year. Everything other than Gold is up. Base metals and agriculture ETFs (BBB and DBA) have also rose strongly as the pandemic has greatly limited supplies and transportation, thus forcing prices rise.
The price of gold is more affected by inflation expectation, not much by the actual inflation. The depressing gold price indicates that investors expect a rising inflation in the near future. This is corroborated by the strong inflation protected bond price (TIP), shown in Table 1 above.
Note that it’s possible to see gold price even rises in a rising rate environment. This usually happens in the late stage of a rising rate period. When that happens, it signals that investors are now believing rates will soon start to fall.
Growth or value? Large or small?
Let’s first look at the trend scores of stock styles:
US Equity Style Trend: (as of 6/25/2021)
| Description | Symbol | 52 Weeks | Trend Score |
|---|---|---|---|
| Russell Smallcap Value | IWN | 85.55% | 24.92% |
| Russell Smallcap Index | IWM | 71.47% | 20.25% |
| Russell Midcap Value | IWS | 58.76% | 17.7% |
| Russell Midcap Indedx | IWR | 54.45% | 16.74% |
| Russell Smallcap Growth | IWO | 57.3% | 15.49% |
| Russell Largecap Growth | IWF | 44.9% | 15.32% |
| Russell Midcap Growth | IWP | 46.37% | 15.19% |
| Russell Largecap Index | IWB | 46.5% | 15.01% |
| Russell Largecap Value | IWD | 47.84% | 14.56% |
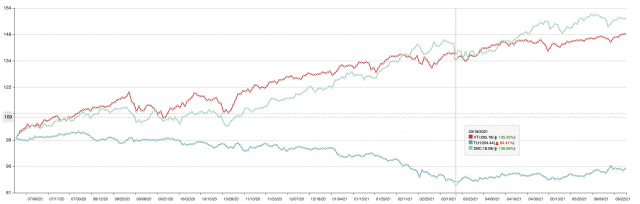
We all know that markets underwent a growth to value rotation recently, but now this rotation seems to be over (?):
So starting in early last month, growth stocks have risen strongly. It’s likely that investors are again in favor of growth stocks.
Similarly, large stocks have now recovered back and poised to overtake small stocks since mid March:
So it does look like the rotations from growth to value and from large to small are in jeopardy: maybe the go go low rate, large growth time is back.
Back to tech?
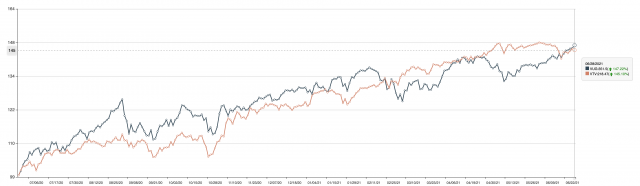
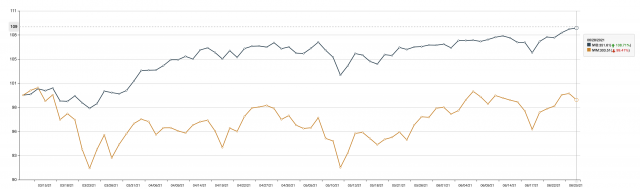
The following chart compares the famous ARK Innovation ETF (ARKK) with S&P Tech sector (XLK) and financial sector (XLF):
ARKK has risen more than 25% from its low and XLK (tech) has now also compared more favorably than a typical value sector like financials (XLF).
A final thrust before the big fall?
The above un-rotation seems to be in progress. But it does seem this is a rather speculative and chaotic chase. Well, in a market top, such frenzy speculative actions are usually rampant. A possible, though a very subjective, guess of ours is that we might be experiencing a final thrust to another record high in stocks before a big correction or a fall. This will come along with declining rates (thus rising bond prices) to propel the speculative bubble to its fullest. Basically, the theory goes that in this final thrust, growth stocks, especially tech stocks, will again take the lead as economy recovery quickens and corporate earnings are expected (or reported) to be so rosy (we did have such a taste on the last quarter’s earnings reports) that the riskiest assets are in high demand while low interest rates are still supported by the Federal Reserve and the strongest many trillion dollar fiscal stimulus.
This will eventually stop when inflation finally gets out of control or another pandemic related resurge happens again.
Again, we want to point out the above is just a subjective prediction. As always, what counts is a strategy that can handle scenarios when such a prediction happens or more importantly when such a prediction fails or postpones indefinitely. We believe it’s more important to have a strategy that can handle all possible scenarios reasonably well instead of a bet-it-all gambling strategy. For those who are not familiar with our philosophy, please refer to our investment methodology.
Market Overview
As described in the above, markets are again becoming rosy and reaching new highs almost daily. In addition to the possible run away inflation discussed above, we want to point out that the pandemic is not over. There are still quite some unknowns. Specifically, UK is now experiencing some lockdown again while new variants of virus are reported. These new virus variants might present challenge to existing vaccines. This is definitely a factor more and more people want to forget (well, it’s been one and half year and counting). But a likely factor indeed, regardless of how subjectively you want to ignore it.
We are again cautiously optimistic and reiterate the following practice:
- For strategic allocation (buy and hold) investors, ignore the current market behavior. Remember, as what we have emphasized numerous times, when you choose and commit to a strategic portfolio, you essentially know and commit that your investment horizon (or the time you need to utilize this capital) is 20 years or longer. As we pointed out, if your investments are those diversified (index) funds such as an S&P 500 index fund (VFINX, for example), you know your money is in some solid ‘business’ that eventually (20 years later) will deliver some reasonable returns. As long as you are comfortable with this thesis, you should sit tight and forget about the current gyration.
- For tactical investors, again, you have to ignore the current market noise. Furthermore, you should follow your strategy rigorously, especially in a time like this. Human emotion, both optimistic and pessimistic, and human desire, both greedy and fearful, are your worst enemies. This has been shown to be true time and time again.
Stock valuation is still extremely high by historical standard. For the moment, we believe it’s prudent to be cautious while riding on market uptrend. However how serious a correction might be, we have confidence in the US economy in the long term and thus in the stocks in aggregate. We just need to manage through interim losses carefully.
We again would like to emphasize that for any new investor and new money, the best way to step into this kind of markets is through dollar cost average (DCA), i.e. invest and/or follow a model portfolio in several phases (such as 2 or 3 months) instead of the whole sum at one shot.
Enjoy Newsletter
How can we improve this newsletter? Please take our survey
–Thanks to those who have already contributed — we appreciate it.
Latest Articles
- June 21, 2021: Stocks Are Not Replacement Of Bonds
- June 14, 2021: Outperform The Best Performing PIMCO Income Bond Fund
- June 7, 2021: “Good” S&P Sectors
- May 17, 2021: Total Return Bond ETFs Review
- May 10, 2021: Financial Independence & Early Retirement
- May 3, 2021: Inflation, Sub Zero Interest Rate …
- April 26, 2021: The Best Active Fixed Income Funds Are Still Hard To Beat
- April 19, 2021: New And Old Useful Features
- April 12, 2021: Risk Parity Funds In Current Environment
- April 5, 2021: DoubleLine Shiller CAPE 10 Based Funds Update
- March 29, 2021: International Stocks vs. US Stocks
- March 22, 2021: Ultra Short Term Bond ETF Portfolio As A Money Market Fund
- March 15, 2021: Make Your Own Private Bank
- March 8, 2021: The Not So Orderly Market Rotation Amid Rising Bond Yields
- March 1, 2021: Average 20% Annual Returns: The Upper Bound Of Stock Investments?!
- February 22, 2021: Rising Bond Yields And Current Stock Trends
- February 8, 2021: Total Return Bond ETFs Review
- February 1, 2021: REITs And Major Asset Trends
- January 25, 2021: Industry ETFs And ARK ETFs Portfolios
- January 11, 2021: Smart Cash Management: Can I Just Withdraw From My Bond Portfolio?
- January 4, 2021: Our Investment Philosophy For 2021 And Beyond
- December 14, 2020: Style and Factor ETFs Portfolio Reviews
- December 7, 2020: A Really Long Term (30 Years) Stock Returns
- November 30, 2020: Higher Return Portfolios: Part 2
- November 16, 2020: Higher Return Portfolios
- November 9, 2020: Fixed Income Funds Update
- November 2, 2020: Polls Are Useless vs. This Investment Strategy Doesn’t Work!
- October 26, 2020: Recent Improvements
- October 19, 2020: REIT Indexes As Businesses
- October 12, 2020: Stock Indexes As Businesses
- October 5, 2020: Asset Trend Review
- September 28, 2020: Retirement Spending: Your Portfolio’s Volatility Matters
- September 21, 2020: Boring Utility Stocks Are Excellent Long Term Winners
- September 14, 2020: Surprised, Active Fixed Income Investors Have Done Better Than Stock Investors For The Last 20 Years!
- August 31, 2020: Investing In An Ultra-Low Return Environment
- August 24, 2020: Target Maturity Bond ETFs For Short Term Cash
- August 17, 2020: Newsletter Collection Update
- August 10, 2020: Fixed Income In A Speculative Era
- August 3, 2020: Sound Investment Strategies
- July 27, 2020: Total Return Bond Funds Update
- July 20, 2020: Divergence Between Value And Growth Stocks Everywhere
- July 13, 2020: Short Term Cash, Treasury Bills, CDs And Future Fixed Income
- July 6, 2020: Bond ETFs vs. Bond Mutual Funds
- June 29, 2020: Industry Sector ETF Rotation With Composite Momentum
- June 22, 2020: Industry Sector Rotation With Composite Momentum
- June 15, 2020: Advanced Minimum Equity Portfolios
- June 8, 2020: Recent Positive Developments
- June 1, 2020: Minimum Equity Portfolios
- May 18, 2020: Core Satellite Portfolios In The Current Pandemic
- May 11, 2020: Asset Trends Review
- May 4, 2020: The Real, Sensible And Wise Warren Buffett
- April 27, 2020: Total Return Bond Funds & Portfolios
- April 20, 2020: Multi-Factor ETFs and Rotation
- April 13, 2020: A Closer Look At 401(k) Investment Portfolios
- April 6, 2020: Long Term Stock Market Timing Since 1871 Revisited
- March 30, 2020: How Did Bond ETFs And Mutual Funds Fare In The Current Crisis?
- March 23, 2020: Chaos And Hope
- March 16, 2020: A Live Lesson
- March 9, 2020: Risk And Reward
- March 2, 2020: The Risk Of Coronavirus Outbreak
- February 24, 2020: Long Term Stock Valuation Based Investment Strategies
- February 10, 2020: Update On Short Term Cash, Treasury Bills and Brokered CDs
- February 3, 2020: Investment Landscape For Retirees And Would-be Retirees: Stocks
- January 27, 2020: Investment Landscape For Retirees And Would-be Retirees: Fixed Income
- January 13, 2020: Portfolio Performance: A Walk In The Past II
- January 6, 2020: Asset Outlook and Portfolio Strategies
- December 16, 2019: Q&As On Our Services
- December 9, 2019: Portfolio Constructions For Advanced Users
- December 2, 2019: Newsletter Collection Update
- November 25, 2019: Core ETFs or Core Mutual Funds Portfolios
- November 18, 2019: Introducing MyPlanIQ Asset Allocation Composite Strategy
- November 11, 2019: Market Indicator And Momentum
- November 4, 2019: Factor ETF Rotation
- October 28, 2019: Multi-factor ETFs vs. Equal Weight Multi-Factor Portfolios
- October 21, 2019: Multi-factor ETFs: Value And Momentum
- October 14, 2019: Low Volatility Factor ETFs
- October 7, 2019: Zero Commission Era Has Arrived, Is It Really That Good?
- September 30, 2019: Boosting Bond ETF Portfolio’s Return With Muni Bond ETFs
- September 23, 2019: Value ETFs
- September 16, 2019: Factor ETFs
- September 9, 2019: Momentum Factor Stock ETFs
- August 26, 2019: Employer 401k Match: Yet Another Free Lunch Not To Be Missed
- August 19, 2019: PIMCO Income Fund and Other Total Return Bond Funds Update
- August 12, 2019: Aggressive Fixed Income Portfolios?
- August 5, 2019: Long Term Investment Strategies And Short Term Market Noises
- July 29, 2019: Fixed Income Portfolios In A Lower Yield Environment
- July 22, 2019: Core Satellite Portfolios Balance Fluctuation
- July 15, 2019: Quality Stock Factor ETFs
- July 8, 2019: Surprise! Brokerages Make Most From Your Cash, Not Commissions
- July 1, 2019: Utilities Sector Review
- June 24, 2019: Asset Allocation Funds Review
- June 17, 2019: Latest Performance Comparison Among Several Advanced Strategies
- June 10, 2019: Money Market And Ultra Short Term Bond Funds
- June 3, 2019: What We Can Learn From The Seasonality Strategy
- May 20, 2019: Morningstar Portfolio Manager Awards
- May 13, 2019: Total Return Bond ETFs Review
- May 6, 2019: Global Allocation Revisited
- April 29, 2019: Asset Trend Review
- April 22, 2019: The Current State Of Fixed Income
- April 15, 2019: The Importance Of Fixed Income Returns For Retirement Spending
- April 8, 2019: Newsletter Collection Update
- April 1, 2019: S&P 500 As A Business
- March 25, 2019: Health Care Sector Review
- March 18, 2019: The Risk Of Stock Investing
- March 11, 2019: Consumer Staples Sector Review
- March 4, 2019: Global Stock Valuation Update
- February 25, 2019: ‘Bad’ Tactical Strategy
- February 11, 2019: “Best” Balanced Fund And Portfolios Revisited
- February 4, 2019: Cash And Money Market Funds: Interests And Safety
- January 28, 2019: Fixed Income Review
- January 14, 2019: Tactical Asset Allocation Portfolio Review
- January 7, 2019: Global Strategic Asset Allocation Portfolio Review
- December 17, 2018: Robinhood’s ‘Revolution’ Or Gimmick
- December 10, 2018: How Defensive Are REITs?
- December 3, 2018: Conservative Core Satellite Portfolio
- November 26, 2018: Allocation Mutual Fund Review
- November 19, 2018: Is The Recent Downtrend Sustainable?
- November 12, 2018: The Staggering Low Interest Rates From Big Banks
- November 5, 2018: The ‘Right’ Or ‘Wrong’ Decision
- October 29, 2018: Taxable Total Return Bond Plus Muni Bond Fund Based Portfolios
- October 22, 2018: DoubleLine Shiller CAPE 10 Based Fund Review
- October 15, 2018: Newsletter Collection Update
- October 8, 2018: Asset Trend Review
- October 1, 2018: Taxable vs. Tax Exempt High Yield Bonds
- September 24, 2018: High Yield Bonds In A Rising Rate Environment
- September 10, 2018: Value, Growth And Blend Stock Style Investing
- August 27, 2018: Money Market ETFs?
- August 20, 2018: How Momentum Investing Stacks Up?
- August 13, 2018: Total Return Bond ETF
- August 6, 2018: Fidelity Zero-Fee Index Funds
- July 30, 2018: Tax Efficient Portfolios
- July 23, 2018: Municipal Bond Funds And Portfolios
- July 16, 2018: A Guide To Conservative Portfolios
- July 9, 2018: Conservative Allocation Mutual Funds Based Portfolios
- July 2, 2018: Small Cap Stocks For The Long Term
- June 25, 2018: What Can We Learn From GE’s Removal From Dow Jones Index?
- June 18, 2018: The ‘Best’ Balanced Portfolio Continues To Excel
- June 11, 2018: Is 10 Year Long Enough For Portfolio Comparison?
- June 4, 2018: Action Plan: Risk Review For Investments
- May 21, 2018: Rising Rates, Consumer Staples And Stock Index
- May 14, 2018: Newsletter Collection Update
- May 7, 2018: Money Market Fund Taxonomy
- April 30, 2018: Momentum Investing Review
- April 23, 2018: Commodities In Current Environment
- April 16, 2018: Municipal Bonds As A Fixed Income Asset Class
- April 9, 2018: Exponential Or Compounding Nature In Investing
- April 2, 2018: Inside Of The Stock Chaos
- March 26, 2018: Total Return Bond Update
- March 19, 2018: Treasury Bills vs. Brokered CDs
- March 12, 2018: Defensive Conservative Portfolio Review
- March 5, 2018: Warren Buffett’s Advices
- February 26, 2018: Pros And Cons of Strategic And Tactical Portfolios In 2018
- February 12, 2018: Trend Review
- February 5, 2018: Market Selloff And Long Term Investing
- January 29, 2018: The New Addition To Our Total Return Bond Fund Candidates
- January 22, 2018: Where Are Bonds Heading?
- January 15, 2018: Tactical Portfolios Review
- January 8, 2018: Strategic Portfolios Review
- December 18, 2017: Record Highs And Risk
- December 11, 2017: Cash Return And Interest Rate Update
- December 4, 2017: Mutual Fund Star Ratings: Are They Useful?
- November 20, 2017: Thankful And Mindful
- November 13, 2017: Is This A Good Time For Retirees Or Would Be Retirees?
- November 6, 2017: Newsletter Collection Update
- October 30, 2017: Rising Interest Rates
- October 23, 2017: A Primer For Portfolios
- October 16, 2017: REITs As An Asset Class
- October 9, 2017: Conservative Portfolios Revisited
- October 2, 2017: The Role of Short Term Bond Funds
- September 25, 2017: Fees In Cash Investments
- September 18, 2017: Conservative Portfolios Review
- September 11, 2017: International Diversification Effect
- September 4, 2017: Invest And Speculate Revisited
- August 28, 2017: Total Return Bond Fund Portfolios: Where Do They Fit?
- August 21, 2017: Portfolio Performance: A Walk In The Past
- August 14, 2017: Fidelity Commission Free ETFs Update
- August 7, 2017: I Didn’t Learn Anything — Mistake vs. Temporary Underperformance
- July 31, 2017: Asset Classes And Fund Choices: A Primer
- July 24, 2017: Total Return Bond Fund Portfolios And Cash
- July 17, 2017: Long Term Stock Holding Periods For Retirement
- July 10, 2017: Half Year Asset Trend Review
- June 26, 2017: How To Beat The Best Balanced Allocation Fund
- June 19, 2017: Newsletter Collection Update
- June 12, 2017: A Mixed Bag Performance of Momentum Investing
- June 5, 2017: How To Start A New Portfolio
- May 29, 2017: Alternative Assets And Their Role In Portfolios
- May 22, 2017: Summer Seasonality And Portfolio Management
- May 15, 2017: Cash: Banking Or Investing?
- May 8, 2017: Holding Period of Long Term Timing Portfolios
- May 1, 2017: Debate on Risk vs. Volatility
- April 24, 2017: The Long Term Stock Market Timing Return Since 1871
- April 17, 2017: Risk vs. Volatility: Long Term Stock Market Returns
- April 10, 2017: Total Return Bond ETFs And Portfolios
- April 3, 2017: Quarter End Asset Trend Review
- March 27, 2017: Practical Consideration For IRAs And 401k Accounts
- March 20, 2017: Fund Fees: That’s (Still) Outrageous
- March 13, 2017: Long Term Stock Valuation Review
- March 6, 2017: Asset Classes for Retirement Investments
- February 27, 2017: Fidelity Total Bond Fund Review
- February 20, 2017: Long Term Stock Timing Based Portfolios And Their Roles
- February 13, 2017: Alternative Investment Portfolios Review
- February 6, 2017: Tax Free Municipal Bond Investments Review
- January 30, 2017: Brokerage Specific Conservative Portfolios
- January 23, 2017: Fixed Income Portfolio Review
- January 16, 2017: Long Term Trend Following Portfolio Review
- January 9, 2017: Tactical Asset Allocation Review
- January 3, 2017: Strategic Asset Allocation Review
- December 12, 2016: Enhanced Index Funds
- December 5, 2016: Review Of Broad Base Core Mutual Funds For Brokerages
- November 28, 2016: Core Index ETFs Review
- November 21, 2016: International Exposure Of U.S. Large Companies
- November 14, 2016: Asset Trends After The Election
- November 7, 2016: Rising Rate And Current Bond Trend
- October 31, 2016: Economy Power And Long Term Stock Returns
- October 24, 2016: Current Commodity Trend And Managed Futures
- October 17, 2016: Investment Mistakes And Good Or Bad Investment Strategies
- October 10, 2016: Momentum Investing Review
- October 3, 2016: Survey & Feedback
- September 26, 2016: Fixed Income Investing: Actively Managed Funds vs. Index Funds
- September 19, 2016: Stock Investing: Actively Managed Funds vs. Index Funds
- September 12, 2016: Newsletter Update
- September 5, 2016: Overvalued Markets And Long Term Timing Strategies
- August 29, 2016: Your 401K Finally Draws Attention
- August 22, 2016: Inflation Protected Securities TIPS For Current Overvalued Markets
- August 15, 2016: Risk On: Emerging Market Stocks And Small Cap Stocks
- August 8, 2016: Portfolio Construction Using Stock ETFs And Bond Mutual Funds
- August 1, 2016: Adding Value To Your Own Investments
- July 25, 2016: Tactical Asset Allocation Funds Review
- July 18, 2016: Strategic Asset Allocation & Lazy Portfolio Review
- July 11, 2016: Asset Trend Review
- June 27, 2016: Secular Cycles For Tactical And Strategic Investment Strategies
- June 20, 2016: A World of Debt
- June 13, 2016: Managed Futures For Portfolio Building
- June 6, 2016: Newsletter Summary
- May 30, 2016: Swensen Portfolio And Permanent Portfolios
- May 23, 2016: AAII Article And Some Web Changes
- May 16, 2016: The PIMCO (Dis)Advantages
- May 9, 2016: Boost Your Dull Summer Investments
- May 2, 2016: Low Cost Index Fund Investing
- April 25, 2016: Tax Free Municipal Bond Funds & Portfolios
- April 18, 2016: Asset Class Trend Review
- April 11, 2016: Construction of Sound And Conservative Portfolios
- March 28, 2016: Total Return Bond ETFs Review
- March 21, 2016: Small And Large Company Stock Performance In Different Economic Expansion Cycles
- March 14, 2016: Are Tactical And Timing Strategies Losing Steam?
- March 7, 2016: Defined Maturity Bond Fund Analysis
- February 29, 2016: Smart Strategic Asset Allocation Rebalance When Market Trend Changes
- February 22, 2016: Be Cash Smart
- February 15, 2016: Bond ETF Portfolios
- February 8, 2016: Newsletter Collection Update
- February 1, 2016: Total Return Bond Fund Portfolios In A Volatile Period
- January 25, 2016: Alternative Portfolios Review
- January 18, 2016: Strategic Asset Allocation: A Cautious Outlook
- January 11, 2016: Review Of Trend Following Tactical Asset Allocation
- January 4, 2016: What Worked And Didn’t In 2015
- December 21, 2015: Distressed Assets
- December 14, 2015: High Yield Bonds And Their Correlation With Stocks
- December 7, 2015: Diversification And Global Allocation
- November 30, 2015: Investors and Speculators Combined
- November 23, 2015: Active Stock Fund Performance Consistency
- November 16, 2015: Permanent, Risk Parity And Alternative Portfolios Review
- November 9, 2015: Broad Base Core Mutual Fund Review
- November 2, 2015: Broad Base Index Core ETFs Review
- October 26, 2015: Total Return Bond Fund Review
- October 19, 2015: Advanced Portfolio Review
- October 12, 2015: What About Commodities?
- October 5, 2015: Core Satellite Portfolios In A 401k Account
- September 28, 2015: Risk Managed Strategic Asset Allocation Portfolios Revisited
- September 21, 2015: Quest For The Best Investment Strategy
- September 14, 2015: Core Satellite Portfolios In Market Turmoil
- September 7, 2015: Market Rout Creates An Opportunity to Reposition Your Portfolios
- August 31, 2015: Review of Asset Allocation Funds and Portfolios
- August 24, 2015: Market Rout And Your Portfolios
- August 17, 2015: ETF or Mutual Fund Based Portfolios
- August 10, 2015: Updated Newsletter Collection
- August 3, 2015: Slippery Asset Trends
- July 27, 2015: Performance Dispersion Among Momentum Based Portfolios
- July 20, 2015: Global Balanced Portfolio Benchmarks
- July 13, 2015: Pain in Tactical Portfolios
- July 6, 2015: Fixed Income Total Return Bond Funds In Strategic Asset Allocation Portfolios
- June 29, 2015: Core ETF Commission Free Portfolios
- June 22, 2015: Secular Asset Trends
- June 15, 2015: Giving Up Bonds?
- June 1, 2015: Summer Blues?
- May 26, 2015: Cash, Bonds and Stocks In A Rising Rate Environment
- May 18, 2015: Portfolio Update
- May 11, 2015: Pain in Fixed Income?
- May 4, 2015: The Balanced Stock and Long Term Treasury Bond Portfolios
- April 27, 2015: Long Term Treasury Bond Behavior
- April 20, 2015: 529 College Savings Plan Rebalance Policy Change
- April 13, 2015: Total Return Bond Funds As Smart Cash
- April 6, 2015: The Low Return Environment
- March 30, 2015: Brokerage Specific Core Mutual Fund Portfolios 2
- March 23, 2015: Investment Arithmetic for Long Term Investments
- March 16, 2015: Brokerage Specific Core Mutual Fund Portfolios
- March 9, 2015: Newsletter Collection Update
- March 2, 2015: Total Return Bond ETFs
- February 23, 2015: Why Is Global Tactical Asset Allocation Not Popular?
- February 16, 2015: Where Are Permanent Portfolios Going?
- February 9, 2015: How Have Asset Allocation Funds Done?
- February 2, 2015: Risk Management Everywhere
- January 26, 2015: Composite Portfolios Review
- January 19, 2015: Fixed Income Investing Review
- January 12, 2015: How Does Trend Following Tactical Asset Allocation Strategy Deliver Returns
- January 5, 2015: When Forecast Fails
- December 22, 2014: Long Term Asset Returns: How Long Is Long?
- December 15, 2014: Beaten Down Assets
- December 8, 2014: Implementing Core Asset Portfolios In a Brokerage
- December 1, 2014: Two Key Issues of Investment Strategies
- November 24, 2014: Holiday Readings
- November 17, 2014: Retirement Spending Portfolios Update
- November 10, 2014: Fixed Income Or Cash
- November 3, 2014: Asset Trend Review
- October 27, 2014: Investment Loss, Mistakes And Market Cycles
- October 20, 2014: Strategic Portfolios With Managed Volatility
- October 13, 2014: Embrace Volatility
- October 6, 2014: Tips For 401k Open Enrollment
- September 29, 2014: What Can We Learn From Bill Gross’ Departure From PIMCO?
- September 22, 2014: Why Total Return Bond Funds?
- September 15, 2014: Equity And Total Return Bond Fund Composite Portfolios
- September 8, 2014: Momentum Based Portfolios Review
- September 1, 2014: Risk & Diversification: Mint.com Interview
- August 25, 2014: Remember Risk
- August 18, 2014: Consistency, The Most Important Edge In Investing: Tactical Case
- August 11, 2014: What To Do In Overvalued Stock Markets
- August 4, 2014: Is This The Peak Or Correction?
- July 28, 2014: Stock Musings
- July 21, 2014: Permanent Portfolios & Four Pillar Foundation Based Framework
- July 14, 2014: Composite Portfolios Review
- July 7, 2014: Portfolio Behavior During Market Corrections
- June 30, 2014: Half Year Brokerage ETF and Mutual Fund Portfolios Review
- June 23, 2014: Newsletter Collection Update
- June 16, 2014: There Are Always Lottery Winners
- June 9, 2014: The Arithmetic of Investment Mistakes
- June 2, 2014: Tips On Portfolio Rebalance
- May 26, 2014: In Praise Of Low Cost Core Asset Class Based Portfolios
- May 19, 2014: Consistency, The Most Important Edge In Investing: Strategic Case
- May 12, 2014: How To Handle An Elevated Overvalued Market
- May 5, 2014: Asset Allocation Funds Review
- April 28, 2014: Now The Economy Backs To The ‘Old Normal’, Should Our Investments Too?
- April 21, 2014: Total Return Bond Investing In The Current Market Environment