Trends, Factors & Indicators
As we have reached the midpoint of 2023, it is an opportune moment to evaluate asset trends, economic indicators, and significant stock factors. Additionally, we will delve into our insights and projections for the second half of the year.
Major asset trends
The following table shows the trend scores for major asset classes at the end of June:
| Description | Symbol | 13 Weeks | 26 Weeks | 52 Weeks | Trend Score |
|---|---|---|---|---|---|
| US Stocks | VTI | 8.76% | 17.04% | 19.57% | 10.44% |
| International Developed Stks | VEA | 4.15% | 12.93% | 19.39% | 8.19% |
| Emerging Mkt Bonds | PCY | 5.23% | 11.6% | 18.51% | 8.03% |
| US High Yield Bonds | JNK | 2.39% | 7.89% | 14.37% | 5.32% |
| Treasury Bills | SHV | 2.29% | 4.07% | 6.53% | 2.68% |
| US Equity REITs | VNQ | 1.76% | 4.5% | -2.29% | 2.51% |
| Emerging Market Stks | VWO | 1.24% | 5.0% | 1.84% | 2.15% |
| US Credit Bonds | IGIB | 0.49% | 5.32% | 4.56% | 2.14% |
| Municipal Bonds | MUB | 0.35% | 3.35% | 4.69% | 1.78% |
| Gold | GLD | -2.7% | 5.09% | 5.91% | 1.36% |
| Total US Bonds | BND | -0.06% | 3.67% | 1.0% | 0.9% |
| Mortgage Back Bonds | MBB | 0.1% | 3.31% | 0.39% | 0.66% |
| International Treasury Bonds | BWX | -1.69% | 1.87% | -0.43% | 0.03% |
| Intermediate Treasuries | IEF | -1.21% | 3.1% | -1.92% | -0.26% |
| International REITs | RWX | -2.29% | -3.22% | -5.07% | -2.15% |
| Commodities | DBC | -4.38% | -7.91% | -14.21% | -5.48% |
We have included a detailed list in the above as it shows some of interesting developments:
-
The winning streak of US stocks continues, consistently outperforming other assets for over a decade since 2010. This implies that portfolios with a focus on US stocks have surpassed diversified allocation portfolios. Popular indexes like the S&P 500 (SPY) or the total US stock index (VTI) have set the benchmark, highlighting the underperformance of other portfolio types.
-
Treasury Bills (SHV), a proxy of Cash, stands out with a higher trend score compared to other major assets such as Emerging market stocks (VWO), REITs (VNQ), Bonds (BND, IGIB, MUB), and Gold (GLD). Cash is no longer considered insignificant. With a yield exceeding 5%, it has become a viable asset option, even competing against highly overvalued top-performing US stocks.
-
Commodities (DBC) exhibit their characteristic volatility, ranking at the bottom. The chart indicates that commodities have not reliably served as a hedge or diversifier since 2007.
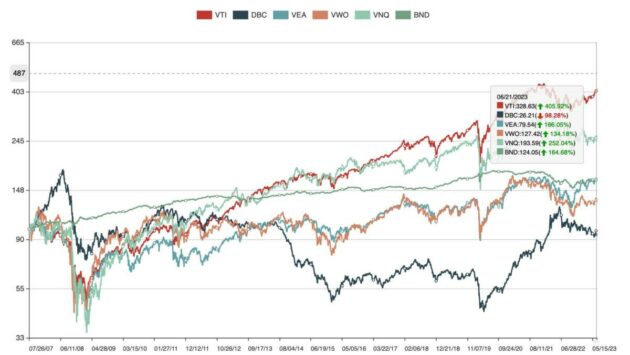
Upon examining the chart above, it becomes evident that since 2007 (the inception of VEA), both international stocks (VEA) and emerging market stocks (VWO) have displayed inferior performance compared to all other US assets, including US bonds (BND). This further emphasizes the point made earlier: global allocation portfolios have struggled to match the returns of US assets, with foreign stocks acting as a drag on portfolio performance.
Nevertheless, despite their underperformance, we maintain the belief that foreign stocks can still serve as an effective diversification tool for portfolios. Their current undervaluation suggests the potential for future appreciation, offering an opportunity for investors.
Styles & factors
Once more, we observe that within US stocks, large cap and growth stocks are demonstrating superior performance compared to small cap and value stocks. This consistent trend, interrupted briefly last year, has now resurfaced.
US Equity Trend Scores
| Description | Symbol | 13 Weeks | 26 Weeks | 52 Weeks | Trend Score |
|---|---|---|---|---|---|
| Russell Largecap Growth | IWF | 12.96% | 29.11% | 26.46% | 15.01% |
| Russell Midcap Growth | IWP | 6.34% | 16.0% | 21.92% | 10.55% |
| Russell Largecap Index | IWB | 8.8% | 16.85% | 19.26% | 10.35% |
| Russell Smallcap Growth | IWO | 7.3% | 13.69% | 18.44% | 9.44% |
| Russell Midcap Indedx | IWR | 5.01% | 9.29% | 14.65% | 7.63% |
| Russell Smallcap Index | IWM | 5.55% | 8.39% | 12.44% | 6.71% |
| Russell Midcap Value | IWS | 4.19% | 5.55% | 10.45% | 5.91% |
| Russell Largecap Value | IWD | 4.52% | 5.48% | 11.85% | 5.79% |
| Russell Smallcap Value | IWN | 3.68% | 2.99% | 6.24% | 3.94% |
The resurgence of growth stocks suggests that investors are leaning to a more favorable interest rate environment view, anticipating a return to low interest rates amidst slowing inflation.
When considering smart factors such as momentum, value, quality, size, and minimum volatility, it becomes apparent that quality stocks hold the highest rank, while value and size factors are experiencing relatively lower performance:
| Description | Symbol | 13 Weeks | 26 Weeks | 52 Weeks | Trend Score |
|---|---|---|---|---|---|
| Large Cap | SPY | 9.09% | 17.23% | 19.67% | 10.53% |
| Momentum | MTUM | 4.57% | 0.23% | 10.5% | 4.55% |
| Value | VTV | 4.26% | 3.86% | 12.59% | 5.44% |
| Quality | QUAL | 9.35% | 19.42% | 23.87% | 11.81% |
| Minimum Volatility | USMV | 2.99% | 4.38% | 8.46% | 4.25% |
| Small Cap | IWM | 5.55% | 8.39% | 12.44% | 6.71% |
If we examine the top 10 holdings of QUAL closely:
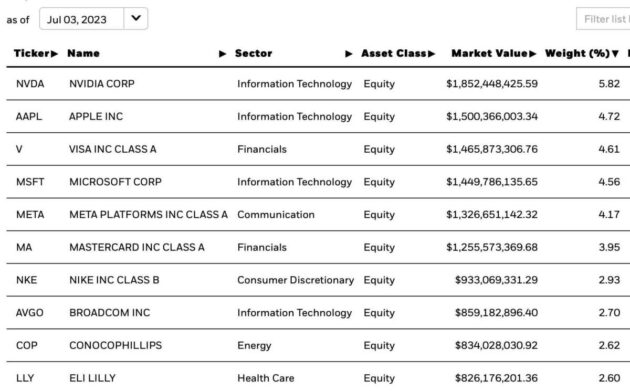
Five of these stocks are technology stocks: NVDA, AAPL, MSFT, META, and AVGO. Out of the top 10 stocks, six of them, namely NVDA, AAPL, V, MSFT, MA, and AVGO, have reached record highs. It is unsurprising to witness these tech stocks being regarded as quality stocks since their products have become deeply ingrained in every facet of our economy. It is difficult to refute the notion that technology businesses are emerging as dominant forces in the economy.
Economy indicators
MyPlanIQ’s Asset Allocation Composite (AAC) and Tactical Asset Allocation (TAA) both rely on a combination of trend scores and some key economy indicators to gauge major risk asset up or down trends (see this for more discussions). Economy indicators play an important role in our asset allocation strategies.
So far, key economy indicators are indicating a slowing economy. The key question is how slow it is.
- Unemployment rate: the May’s US unemployment rate rose above its previous value a year ago (3.7% vs. 3.6%), even though the rise has been slow, indicating a still hot job market:
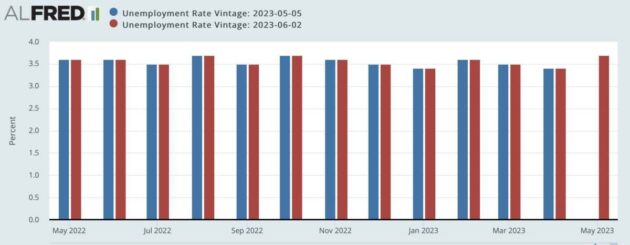
Notice unemployment rate is a lagging indicator, meaning it was usually strong even when a recession already started.
- Retail sales: this too shows a decline from a year ago.
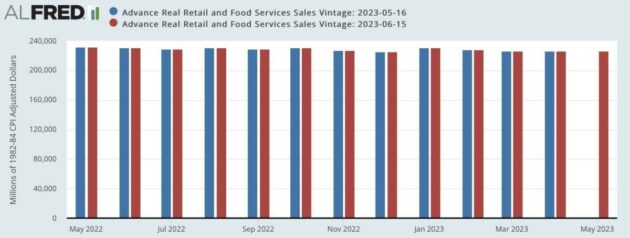
Similar to job situation, retail sales (representing consumption) has somewhat weakened, though not by a significant margin.
- Housing start: however housing has recovered strongly, sending a conflicting signal:
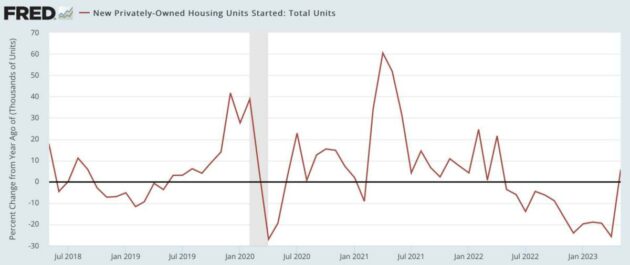
The rising mortgage rates had a very significant impact on housing in last year but it has started to recover in May.
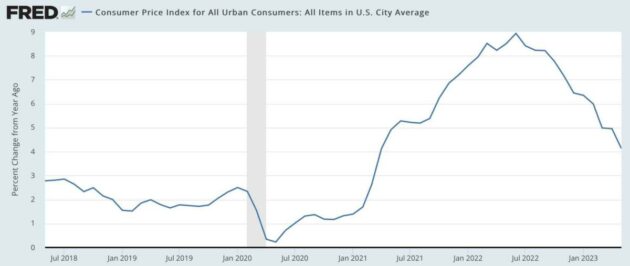
- Inflation (CPI): CPI, the main gauge of inflation, has been trending down rapidly:
In summary, inflation and employment data remain positive, although there has been a slight decline in consumption. Nevertheless, housing starts are exhibiting a robust recovery, which poses a challenge for central banks in managing inflation. Currently, a recession is not on the immediate horizon, but it is not completely out of consideration.
Seasonality
This year is one of those instances where the saying ‘sell in May and go away’ has not manifested itself — though it is important to note that summer has only just commenced, making it premature to draw definitive conclusions. Since the end of May, the S&P 500 index has displayed exceptional strength, failing to trigger the MACD sell signal utilized in our seasonal tracking portfolio STS Seasonal Timing Using VFINX Total Return Bond Fund As Cash.
Market overview
Now the second quarter has ended, investors will start to get a better picture on how earnings will be. Factset estimates that in Q2 S&P 500 companies earnings declined 6.8%. This compares with Q1’s earnings decline 2.1%. At the moment, S&P 500 index has surpassed its previous 52 week highs.
As always, we call for staying the course which is guided by the well defined and sound strategic and tactical strategies:
- For strategic allocation (buy and hold) investors, ignore the current market behavior. Remember, as what we have emphasized numerous times, when you choose and commit to a strategic portfolio, you essentially know and commit that your investment horizon (or the time you need to utilize this capital) is 20 years or preferably much longer given the current high valuation. As we pointed out, if your investments are those diversified (index) funds such as an S&P 500 index fund (VFINX, for example), you know your money is in some solid ‘business’ that eventually (20 years later and preferably many more years later) will deliver some reasonable returns. As long as you are comfortable with this thesis, you should sit tight and forget about the current gyration.
- For tactical investors, again, you have to ignore the current market noise. Furthermore, you should follow your strategy rigorously, especially in a time like this. Human emotion, both optimistic and pessimistic, and human desire, both greedy and fearful, are your worst enemies. This has been shown to be true time and time again.
Stock valuation has dropped and now valuation is becoming less hostile. However, it is still not cheap by historical standard. For the moment, we believe it’s prudent to be extra cautious. However how serious a correction might be, we have confidence in the US economy in the long term and thus in the stocks in aggregate. We just need to manage through interim losses carefully.
We again would like to emphasize that for any new investor and new money, the best way to step into this kind of markets is through dollar cost average (DCA), i.e. invest and/or follow a model portfolio in several phases (such as 2 or 3 months) instead of the whole sum at one shot.
Struggling to Select Investments for Your 401(k), IRA, or Brokerage Accounts?
Latest Articles
- Lazy Portfolios Review
- ‘Best’ Tactical Stock or Dividend Income Balanced Portfolios vs. Best Balanced Allocation Fund
- ‘Best’ Stock or Dividend Income Balanced Portfolios vs. Best Balanced Allocation Fund
- Low-Cost Stock Index Funds: Quality ‘Business Conglomerates’ for Solid, Low-Risk Long-Term Returns
- Cash And Money Market ETFs Review
- March 27, 2023: 401k Company Match: How To Maximize Your Free Money
- March 13, 2023: Bank On My Own For Safer And Much Higher Returns
- February 27, 2023: Dimensional Fund Advisors and Capital Group ETFs
- February 13, 2023: In Praise Of A Conservative Strategic Asset Allocation
- January 30, 2023: The Bond Era
- January 16, 2023: International Stocks In Asset Allocation
- January 3, 2023: Review And Outlook
- December 5, 2022: Latest Market And Trend Review
- November 21, 2022: How To Maximize Your Cash Return
- November 7, 2022: Tactical Bond Fund Portfolios Consistently Outperform
- October 24, 2022: S&P 500: A Solid ‘Business’ In A Volatile Time
- October 10, 2022: 9.62% Treasury I Bonds: Cash Is Indeed King
- September 26, 2022: Markets, Noises, Long Term Strategies …
- September 12, 2022: Factor ETFs Review
- August 29, 2022: Cash Is King
- August 15, 2022: Asset Trends Review
- August 1, 2022: What We Can Learn From 1970s And 1980s
- July 18, 2022: Fixed Income Is Becoming An Alternative
- July 1, 2022: About The Latest Rebalance
- June 6, 2022: Sector Rotation In A Rising Rate Environment
- May 23, 2022: Latest Portfolio And Trend Review
- May 9, 2022: The Secular Market Cycle Change
- April 25, 2022: Survivorship Bias, Sentiment And Market Internals …
- April 11, 2022: Asset Allocation And Risk Management
- March 28, 2022: March Madness And Steady Course
- March 14, 2022: Quality Sectors Prevail
- February 28, 2022: Asset Allocation Fund Review
- February 14, 2022: Inflation, Interest Rates And Fixed Income Investments
- February 1, 2022: Foreign Stocks And Global Asset Allocation
- January 18, 2022: Steady And Consistency Win In The Long Term
- January 3, 2022: The Year In Rear View: Portfolio And Asset Class Review
- December 13, 2021: Present And Future
- November 22, 2021: The ‘Best’ Balanced Fund Revisited
- November 15, 2021: Q&A On MyPlanIQ Strategies And Portfolios
- November 8, 2021: Major Asset Returns In The Past Twenty Years
- November 1, 2021: Latest Momentum Factor ETFs Review
- October 25, 2021: A Long Term Theme Or Trend Doesn’t Necessarily Yield Good Returns
- October 18, 2021: Dimensional Fund Advisors DFA ETFs
- October 11, 2021: MyPlanIQ Ultra Short Term Bond Portfolio vs. Other Funds
- October 4, 2021: Asset Trends, Market Internals And Inflation Implication
- September 27, 2021: Newsletter Collection Update
- September 20, 2021: Benchmarking MyPlanIQ Fixed Income Bond Portfolios
- September 13, 2021: Benchmarking MyPlanIQ Tactical Portfolios
- August 30, 2021: Invest And Speculate: A Sensible Alternative To Buy And Hold
- August 23, 2021: Style ETF Portfolio Review
- August 16, 2021: Smart Factor ETFs Review
- August 9, 2021: Best Global Allocation Funds vs. MyPlanIQ ETF Portfolios
- August 2, 2021: Major Asset Trends And Market Internals
- July 26, 2021: Ultra Short Term Bond ‘Money Market’ Portfolio And Banking
- July 19, 2021: Take The Challenge of The ‘Best’ Balance Fund
- July 12, 2021: The Long Forgotten Bear Market Cycles
- June 28, 2021: Resuming Growth Trends Chaotically?
- June 21, 2021: Stocks Are Not Replacement Of Bonds
- June 14, 2021: Outperform The Best Performing PIMCO Income Bond Fund
- June 7, 2021: “Good” S&P Sectors
- May 17, 2021: Total Return Bond ETFs Review
- May 10, 2021: Financial Independence & Early Retirement
- May 3, 2021: Inflation, Sub Zero Interest Rate …
- April 26, 2021: The Best Active Fixed Income Funds Are Still Hard To Beat
- April 19, 2021: New And Old Useful Features
- April 12, 2021: Risk Parity Funds In Current Environment
- April 5, 2021: DoubleLine Shiller CAPE 10 Based Funds Update
- March 29, 2021: International Stocks vs. US Stocks
- March 22, 2021: Ultra Short Term Bond ETF Portfolio As A Money Market Fund
- March 15, 2021: Make Your Own Private Bank
- March 8, 2021: The Not So Orderly Market Rotation Amid Rising Bond Yields
- March 1, 2021: Average 20% Annual Returns: The Upper Bound Of Stock Investments?!
- February 22, 2021: Rising Bond Yields And Current Stock Trends
- February 8, 2021: Total Return Bond ETFs Review
- February 1, 2021: REITs And Major Asset Trends
- January 25, 2021: Industry ETFs And ARK ETFs Portfolios
- January 11, 2021: Smart Cash Management: Can I Just Withdraw From My Bond Portfolio?
- January 4, 2021: Our Investment Philosophy For 2021 And Beyond
- December 14, 2020: Style and Factor ETFs Portfolio Reviews
- December 7, 2020: A Really Long Term (30 Years) Stock Returns
- November 30, 2020: Higher Return Portfolios: Part 2
- November 16, 2020: Higher Return Portfolios
- November 9, 2020: Fixed Income Funds Update
- November 2, 2020: Polls Are Useless vs. This Investment Strategy Doesn’t Work!
- October 26, 2020: Recent Improvements
- October 19, 2020: REIT Indexes As Businesses
- October 12, 2020: Stock Indexes As Businesses
- October 5, 2020: Asset Trend Review
- September 28, 2020: Retirement Spending: Your Portfolio’s Volatility Matters
- September 21, 2020: Boring Utility Stocks Are Excellent Long Term Winners
- September 14, 2020: Surprised, Active Fixed Income Investors Have Done Better Than Stock Investors For The Last 20 Years!
- August 31, 2020: Investing In An Ultra-Low Return Environment
- August 24, 2020: Target Maturity Bond ETFs For Short Term Cash
- August 17, 2020: Newsletter Collection Update
- August 10, 2020: Fixed Income In A Speculative Era
- August 3, 2020: Sound Investment Strategies
- July 27, 2020: Total Return Bond Funds Update
- July 20, 2020: Divergence Between Value And Growth Stocks Everywhere
- July 13, 2020: Short Term Cash, Treasury Bills, CDs And Future Fixed Income
- July 6, 2020: Bond ETFs vs. Bond Mutual Funds
- June 29, 2020: Industry Sector ETF Rotation With Composite Momentum
- June 22, 2020: Industry Sector Rotation With Composite Momentum
- June 15, 2020: Advanced Minimum Equity Portfolios
- June 8, 2020: Recent Positive Developments
- June 1, 2020: Minimum Equity Portfolios
- May 18, 2020: Core Satellite Portfolios In The Current Pandemic
- May 11, 2020: Asset Trends Review
- May 4, 2020: The Real, Sensible And Wise Warren Buffett
- April 27, 2020: Total Return Bond Funds & Portfolios
- April 20, 2020: Multi-Factor ETFs and Rotation
- April 13, 2020: A Closer Look At 401(k) Investment Portfolios
- April 6, 2020: Long Term Stock Market Timing Since 1871 Revisited
- March 30, 2020: How Did Bond ETFs And Mutual Funds Fare In The Current Crisis?
- March 23, 2020: Chaos And Hope
- March 16, 2020: A Live Lesson
- March 9, 2020: Risk And Reward
- March 2, 2020: The Risk Of Coronavirus Outbreak
- February 24, 2020: Long Term Stock Valuation Based Investment Strategies
- February 10, 2020: Update On Short Term Cash, Treasury Bills and Brokered CDs
- February 3, 2020: Investment Landscape For Retirees And Would-be Retirees: Stocks
- January 27, 2020: Investment Landscape For Retirees And Would-be Retirees: Fixed Income
- January 13, 2020: Portfolio Performance: A Walk In The Past II
- January 6, 2020: Asset Outlook and Portfolio Strategies
- December 16, 2019: Q&As On Our Services
- December 9, 2019: Portfolio Constructions For Advanced Users
- December 2, 2019: Newsletter Collection Update
- November 25, 2019: Core ETFs or Core Mutual Funds Portfolios
- November 18, 2019: Introducing MyPlanIQ Asset Allocation Composite Strategy
- November 11, 2019: Market Indicator And Momentum
- November 4, 2019: Factor ETF Rotation
- October 28, 2019: Multi-factor ETFs vs. Equal Weight Multi-Factor Portfolios
- October 21, 2019: Multi-factor ETFs: Value And Momentum
- October 14, 2019: Low Volatility Factor ETFs
- October 7, 2019: Zero Commission Era Has Arrived, Is It Really That Good?
- September 30, 2019: Boosting Bond ETF Portfolio’s Return With Muni Bond ETFs
- September 23, 2019: Value ETFs
- September 16, 2019: Factor ETFs
- September 9, 2019: Momentum Factor Stock ETFs
- August 26, 2019: Employer 401k Match: Yet Another Free Lunch Not To Be Missed
- August 19, 2019: PIMCO Income Fund and Other Total Return Bond Funds Update
- August 12, 2019: Aggressive Fixed Income Portfolios?
- August 5, 2019: Long Term Investment Strategies And Short Term Market Noises
- July 29, 2019: Fixed Income Portfolios In A Lower Yield Environment
- July 22, 2019: Core Satellite Portfolios Balance Fluctuation
- July 15, 2019: Quality Stock Factor ETFs
- July 8, 2019: Surprise! Brokerages Make Most From Your Cash, Not Commissions
- July 1, 2019: Utilities Sector Review
- June 24, 2019: Asset Allocation Funds Review
- June 17, 2019: Latest Performance Comparison Among Several Advanced Strategies
- June 10, 2019: Money Market And Ultra Short Term Bond Funds
- June 3, 2019: What We Can Learn From The Seasonality Strategy
- May 20, 2019: Morningstar Portfolio Manager Awards
- May 13, 2019: Total Return Bond ETFs Review
- May 6, 2019: Global Allocation Revisited
- April 29, 2019: Asset Trend Review
- April 22, 2019: The Current State Of Fixed Income
- April 15, 2019: The Importance Of Fixed Income Returns For Retirement Spending
- April 8, 2019: Newsletter Collection Update
- April 1, 2019: S&P 500 As A Business
- March 25, 2019: Health Care Sector Review
- March 18, 2019: The Risk Of Stock Investing
- March 11, 2019: Consumer Staples Sector Review
- March 4, 2019: Global Stock Valuation Update
- February 25, 2019: ‘Bad’ Tactical Strategy
- February 11, 2019: “Best” Balanced Fund And Portfolios Revisited
- February 4, 2019: Cash And Money Market Funds: Interests And Safety
- January 28, 2019: Fixed Income Review
- January 14, 2019: Tactical Asset Allocation Portfolio Review
- January 7, 2019: Global Strategic Asset Allocation Portfolio Review
- December 17, 2018: Robinhood’s ‘Revolution’ Or Gimmick
- December 10, 2018: How Defensive Are REITs?
- December 3, 2018: Conservative Core Satellite Portfolio
- November 26, 2018: Allocation Mutual Fund Review
- November 19, 2018: Is The Recent Downtrend Sustainable?
- November 12, 2018: The Staggering Low Interest Rates From Big Banks
- November 5, 2018: The ‘Right’ Or ‘Wrong’ Decision
- October 29, 2018: Taxable Total Return Bond Plus Muni Bond Fund Based Portfolios
- October 22, 2018: DoubleLine Shiller CAPE 10 Based Fund Review
- October 15, 2018: Newsletter Collection Update
- October 8, 2018: Asset Trend Review
- October 1, 2018: Taxable vs. Tax Exempt High Yield Bonds
- September 24, 2018: High Yield Bonds In A Rising Rate Environment
- September 10, 2018: Value, Growth And Blend Stock Style Investing
- August 27, 2018: Money Market ETFs?
- August 20, 2018: How Momentum Investing Stacks Up?
- August 13, 2018: Total Return Bond ETF
- August 6, 2018: Fidelity Zero-Fee Index Funds
- July 30, 2018: Tax Efficient Portfolios
- July 23, 2018: Municipal Bond Funds And Portfolios
- July 16, 2018: A Guide To Conservative Portfolios
- July 9, 2018: Conservative Allocation Mutual Funds Based Portfolios
- July 2, 2018: Small Cap Stocks For The Long Term
- June 25, 2018: What Can We Learn From GE’s Removal From Dow Jones Index?
- June 18, 2018: The ‘Best’ Balanced Portfolio Continues To Excel
- June 11, 2018: Is 10 Year Long Enough For Portfolio Comparison?
- June 4, 2018: Action Plan: Risk Review For Investments
- May 21, 2018: Rising Rates, Consumer Staples And Stock Index
- May 14, 2018: Newsletter Collection Update
- May 7, 2018: Money Market Fund Taxonomy
- April 30, 2018: Momentum Investing Review
- April 23, 2018: Commodities In Current Environment
- April 16, 2018: Municipal Bonds As A Fixed Income Asset Class
- April 9, 2018: Exponential Or Compounding Nature In Investing
- April 2, 2018: Inside Of The Stock Chaos
- March 26, 2018: Total Return Bond Update
- March 19, 2018: Treasury Bills vs. Brokered CDs
- March 12, 2018: Defensive Conservative Portfolio Review
- March 5, 2018: Warren Buffett’s Advices
- February 26, 2018: Pros And Cons of Strategic And Tactical Portfolios In 2018
- February 12, 2018: Trend Review
- February 5, 2018: Market Selloff And Long Term Investing
- January 29, 2018: The New Addition To Our Total Return Bond Fund Candidates
- January 22, 2018: Where Are Bonds Heading?
- January 15, 2018: Tactical Portfolios Review
- January 8, 2018: Strategic Portfolios Review
- December 18, 2017: Record Highs And Risk
- December 11, 2017: Cash Return And Interest Rate Update
- December 4, 2017: Mutual Fund Star Ratings: Are They Useful?
- November 20, 2017: Thankful And Mindful
- November 13, 2017: Is This A Good Time For Retirees Or Would Be Retirees?
- November 6, 2017: Newsletter Collection Update
- October 30, 2017: Rising Interest Rates
- October 23, 2017: A Primer For Portfolios
- October 16, 2017: REITs As An Asset Class
- October 9, 2017: Conservative Portfolios Revisited
- October 2, 2017: The Role of Short Term Bond Funds
- September 25, 2017: Fees In Cash Investments
- September 18, 2017: Conservative Portfolios Review
- September 11, 2017: International Diversification Effect
- September 4, 2017: Invest And Speculate Revisited
- August 28, 2017: Total Return Bond Fund Portfolios: Where Do They Fit?
- August 21, 2017: Portfolio Performance: A Walk In The Past
- August 14, 2017: Fidelity Commission Free ETFs Update
- August 7, 2017: I Didn’t Learn Anything — Mistake vs. Temporary Underperformance
- July 31, 2017: Asset Classes And Fund Choices: A Primer
- July 24, 2017: Total Return Bond Fund Portfolios And Cash
- July 17, 2017: Long Term Stock Holding Periods For Retirement
- July 10, 2017: Half Year Asset Trend Review
- June 26, 2017: How To Beat The Best Balanced Allocation Fund
- June 19, 2017: Newsletter Collection Update
- June 12, 2017: A Mixed Bag Performance of Momentum Investing
- June 5, 2017: How To Start A New Portfolio
- May 29, 2017: Alternative Assets And Their Role In Portfolios
- May 22, 2017: Summer Seasonality And Portfolio Management
- May 15, 2017: Cash: Banking Or Investing?
- May 8, 2017: Holding Period of Long Term Timing Portfolios
- May 1, 2017: Debate on Risk vs. Volatility
- April 24, 2017: The Long Term Stock Market Timing Return Since 1871
- April 17, 2017: Risk vs. Volatility: Long Term Stock Market Returns
- April 10, 2017: Total Return Bond ETFs And Portfolios
- April 3, 2017: Quarter End Asset Trend Review
- March 27, 2017: Practical Consideration For IRAs And 401k Accounts
- March 20, 2017: Fund Fees: That’s (Still) Outrageous
- March 13, 2017: Long Term Stock Valuation Review
- March 6, 2017: Asset Classes for Retirement Investments
- February 27, 2017: Fidelity Total Bond Fund Review
- February 20, 2017: Long Term Stock Timing Based Portfolios And Their Roles
- February 13, 2017: Alternative Investment Portfolios Review
- February 6, 2017: Tax Free Municipal Bond Investments Review
- January 30, 2017: Brokerage Specific Conservative Portfolios
- January 23, 2017: Fixed Income Portfolio Review
- January 16, 2017: Long Term Trend Following Portfolio Review
- January 9, 2017: Tactical Asset Allocation Review
- January 3, 2017: Strategic Asset Allocation Review
- December 12, 2016: Enhanced Index Funds
- December 5, 2016: Review Of Broad Base Core Mutual Funds For Brokerages
- November 28, 2016: Core Index ETFs Review
- November 21, 2016: International Exposure Of U.S. Large Companies
- November 14, 2016: Asset Trends After The Election
- November 7, 2016: Rising Rate And Current Bond Trend
- October 31, 2016: Economy Power And Long Term Stock Returns
- October 24, 2016: Current Commodity Trend And Managed Futures
- October 17, 2016: Investment Mistakes And Good Or Bad Investment Strategies
- October 10, 2016: Momentum Investing Review
- October 3, 2016: Survey & Feedback
- September 26, 2016: Fixed Income Investing: Actively Managed Funds vs. Index Funds
- September 19, 2016: Stock Investing: Actively Managed Funds vs. Index Funds
- September 12, 2016: Newsletter Update
- September 5, 2016: Overvalued Markets And Long Term Timing Strategies
- August 29, 2016: Your 401K Finally Draws Attention
- August 22, 2016: Inflation Protected Securities TIPS For Current Overvalued Markets
- August 15, 2016: Risk On: Emerging Market Stocks And Small Cap Stocks
- August 8, 2016: Portfolio Construction Using Stock ETFs And Bond Mutual Funds
- August 1, 2016: Adding Value To Your Own Investments
- July 25, 2016: Tactical Asset Allocation Funds Review
- July 18, 2016: Strategic Asset Allocation & Lazy Portfolio Review
- July 11, 2016: Asset Trend Review
- June 27, 2016: Secular Cycles For Tactical And Strategic Investment Strategies
- June 20, 2016: A World of Debt
- June 13, 2016: Managed Futures For Portfolio Building
- June 6, 2016: Newsletter Summary
- May 30, 2016: Swensen Portfolio And Permanent Portfolios
- May 23, 2016: AAII Article And Some Web Changes
- May 16, 2016: The PIMCO (Dis)Advantages
- May 9, 2016: Boost Your Dull Summer Investments
- May 2, 2016: Low Cost Index Fund Investing
- April 25, 2016: Tax Free Municipal Bond Funds & Portfolios
- April 18, 2016: Asset Class Trend Review
- April 11, 2016: Construction of Sound And Conservative Portfolios
- March 28, 2016: Total Return Bond ETFs Review
- March 21, 2016: Small And Large Company Stock Performance In Different Economic Expansion Cycles
- March 14, 2016: Are Tactical And Timing Strategies Losing Steam?
- March 7, 2016: Defined Maturity Bond Fund Analysis
- February 29, 2016: Smart Strategic Asset Allocation Rebalance When Market Trend Changes
- February 22, 2016: Be Cash Smart
- February 15, 2016: Bond ETF Portfolios
- February 8, 2016: Newsletter Collection Update
- February 1, 2016: Total Return Bond Fund Portfolios In A Volatile Period
- January 25, 2016: Alternative Portfolios Review
- January 18, 2016: Strategic Asset Allocation: A Cautious Outlook
- January 11, 2016: Review Of Trend Following Tactical Asset Allocation
- January 4, 2016: What Worked And Didn’t In 2015
- December 21, 2015: Distressed Assets
- December 14, 2015: High Yield Bonds And Their Correlation With Stocks
- December 7, 2015: Diversification And Global Allocation
- November 30, 2015: Investors and Speculators Combined
- November 23, 2015: Active Stock Fund Performance Consistency
- November 16, 2015: Permanent, Risk Parity And Alternative Portfolios Review
- November 9, 2015: Broad Base Core Mutual Fund Review
- November 2, 2015: Broad Base Index Core ETFs Review
- October 26, 2015: Total Return Bond Fund Review
- October 19, 2015: Advanced Portfolio Review
- October 12, 2015: What About Commodities?
- October 5, 2015: Core Satellite Portfolios In A 401k Account
- September 28, 2015: Risk Managed Strategic Asset Allocation Portfolios Revisited
- September 21, 2015: Quest For The Best Investment Strategy
- September 14, 2015: Core Satellite Portfolios In Market Turmoil
- September 7, 2015: Market Rout Creates An Opportunity to Reposition Your Portfolios
- August 31, 2015: Review of Asset Allocation Funds and Portfolios
- August 24, 2015: Market Rout And Your Portfolios
- August 17, 2015: ETF or Mutual Fund Based Portfolios
- August 10, 2015: Updated Newsletter Collection
- August 3, 2015: Slippery Asset Trends
- July 27, 2015: Performance Dispersion Among Momentum Based Portfolios
- July 20, 2015: Global Balanced Portfolio Benchmarks
- July 13, 2015: Pain in Tactical Portfolios
- July 6, 2015: Fixed Income Total Return Bond Funds In Strategic Asset Allocation Portfolios
- June 29, 2015: Core ETF Commission Free Portfolios
- June 22, 2015: Secular Asset Trends
- June 15, 2015: Giving Up Bonds?
- June 1, 2015: Summer Blues?
- May 26, 2015: Cash, Bonds and Stocks In A Rising Rate Environment
- May 18, 2015: Portfolio Update
- May 11, 2015: Pain in Fixed Income?
- May 4, 2015: The Balanced Stock and Long Term Treasury Bond Portfolios
- April 27, 2015: Long Term Treasury Bond Behavior
- April 20, 2015: 529 College Savings Plan Rebalance Policy Change
- April 13, 2015: Total Return Bond Funds As Smart Cash
- April 6, 2015: The Low Return Environment
- March 30, 2015: Brokerage Specific Core Mutual Fund Portfolios 2
- March 23, 2015: Investment Arithmetic for Long Term Investments
- March 16, 2015: Brokerage Specific Core Mutual Fund Portfolios
- March 9, 2015: Newsletter Collection Update
- March 2, 2015: Total Return Bond ETFs
- February 23, 2015: Why Is Global Tactical Asset Allocation Not Popular?
- February 16, 2015: Where Are Permanent Portfolios Going?
- February 9, 2015: How Have Asset Allocation Funds Done?
- February 2, 2015: Risk Management Everywhere
- January 26, 2015: Composite Portfolios Review
- January 19, 2015: Fixed Income Investing Review
- January 12, 2015: How Does Trend Following Tactical Asset Allocation Strategy Deliver Returns
- January 5, 2015: When Forecast Fails
- December 22, 2014: Long Term Asset Returns: How Long Is Long?
- December 15, 2014: Beaten Down Assets
- December 8, 2014: Implementing Core Asset Portfolios In a Brokerage
- December 1, 2014: Two Key Issues of Investment Strategies
- November 24, 2014: Holiday Readings
- November 17, 2014: Retirement Spending Portfolios Update
- November 10, 2014: Fixed Income Or Cash
- November 3, 2014: Asset Trend Review
- October 27, 2014: Investment Loss, Mistakes And Market Cycles
- October 20, 2014: Strategic Portfolios With Managed Volatility
- October 13, 2014: Embrace Volatility
- October 6, 2014: Tips For 401k Open Enrollment
- September 29, 2014: What Can We Learn From Bill Gross’ Departure From PIMCO?
- September 22, 2014: Why Total Return Bond Funds?
- September 15, 2014: Equity And Total Return Bond Fund Composite Portfolios
- September 8, 2014: Momentum Based Portfolios Review
- September 1, 2014: Risk & Diversification: Mint.com Interview
- August 25, 2014: Remember Risk
- August 18, 2014: Consistency, The Most Important Edge In Investing: Tactical Case
- August 11, 2014: What To Do In Overvalued Stock Markets
- August 4, 2014: Is This The Peak Or Correction?
- July 28, 2014: Stock Musings
- July 21, 2014: Permanent Portfolios & Four Pillar Foundation Based Framework
- July 14, 2014: Composite Portfolios Review
- July 7, 2014: Portfolio Behavior During Market Corrections
- June 30, 2014: Half Year Brokerage ETF and Mutual Fund Portfolios Review
- June 23, 2014: Newsletter Collection Update
- June 16, 2014: There Are Always Lottery Winners
- June 9, 2014: The Arithmetic of Investment Mistakes
- June 2, 2014: Tips On Portfolio Rebalance
- May 26, 2014: In Praise Of Low Cost Core Asset Class Based Portfolios
- May 19, 2014: Consistency, The Most Important Edge In Investing: Strategic Case
- May 12, 2014: How To Handle An Elevated Overvalued Market
- May 5, 2014: Asset Allocation Funds Review
- April 28, 2014: Now The Economy Backs To The ‘Old Normal’, Should Our Investments Too?
- April 21, 2014: Total Return Bond Investing In The Current Market Environment