-
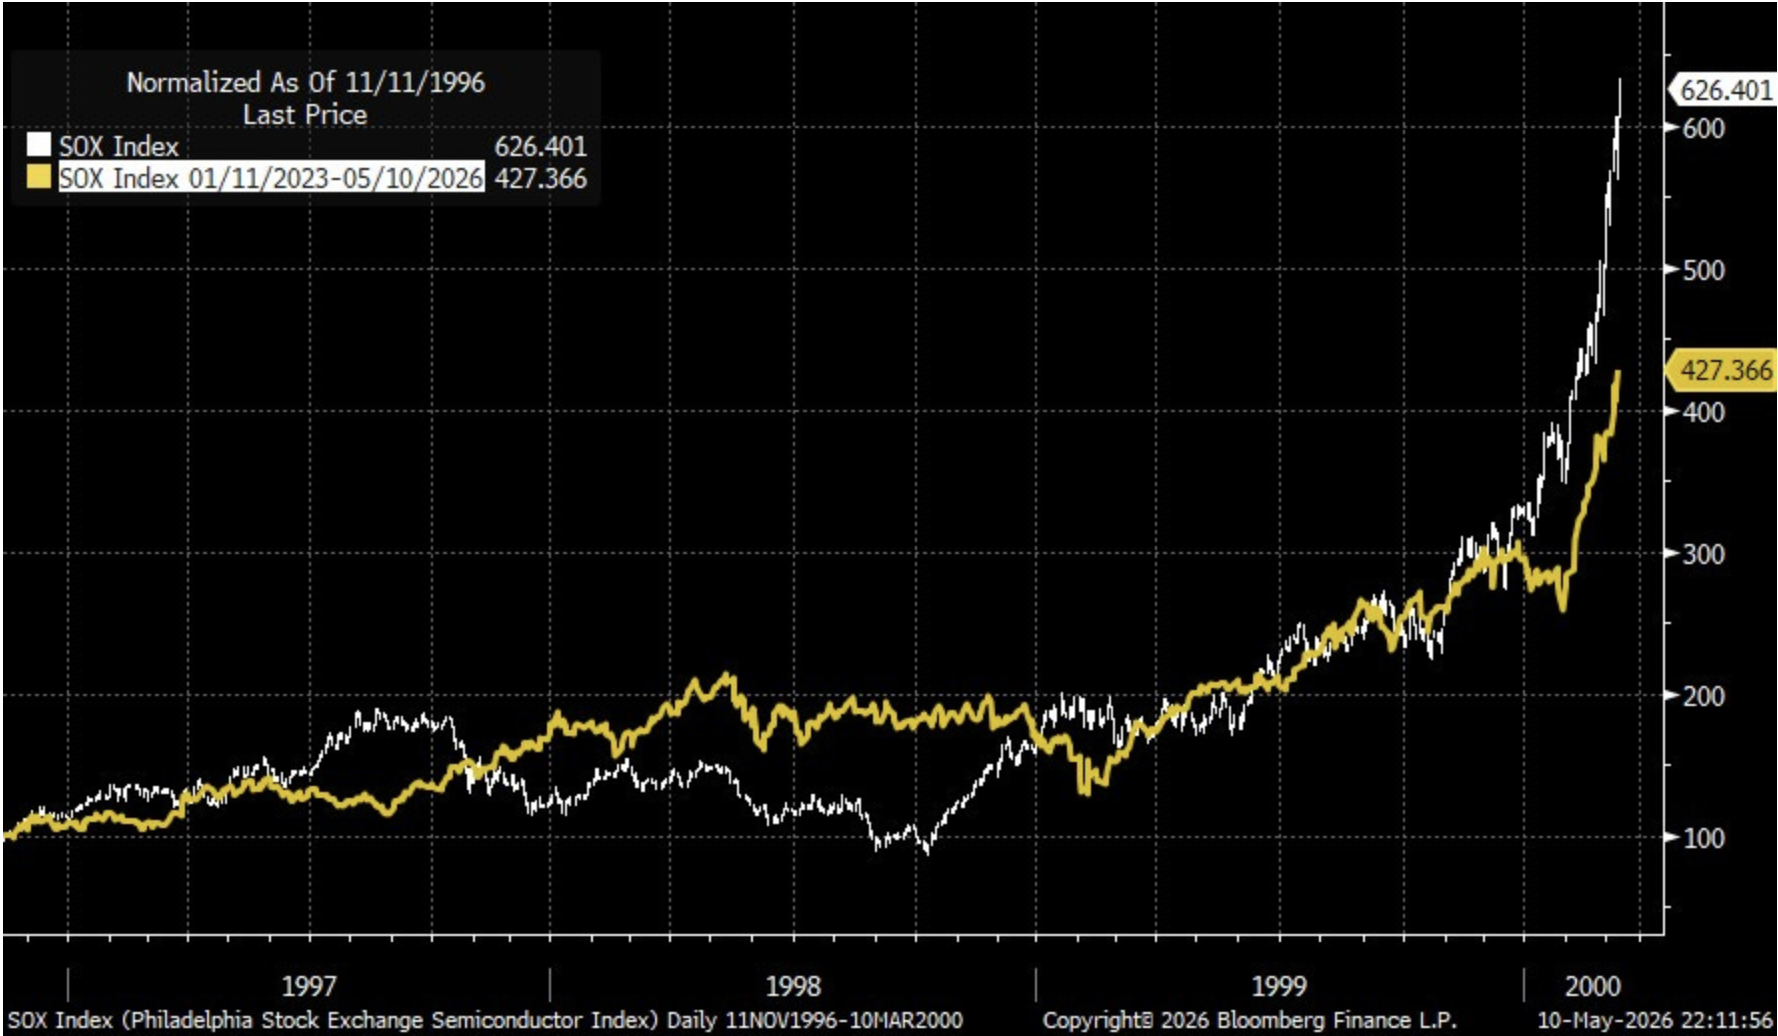
Beware of The Parabolic Stock Market Rise
Stock market melt-up risks, Social Security cap proposal, harder job market.
-

Personal Finance Year End Check List
- Latest in Retirement Savings & Personal Finance
- Personal Finance Year End Check List
- Tools & Tips: 12% Tax Bracket Is the Sweet Spot for Roth IRA Conversion
- Market Overview
-

How A Valuation Driven Bear Market Looks Like
- Latest in Retirement Savings & Personal Finance
- Stock Market Bubble & Retirement Savings
- Tools & Tips: Retirement Spending Calculator
- Market Overview
-
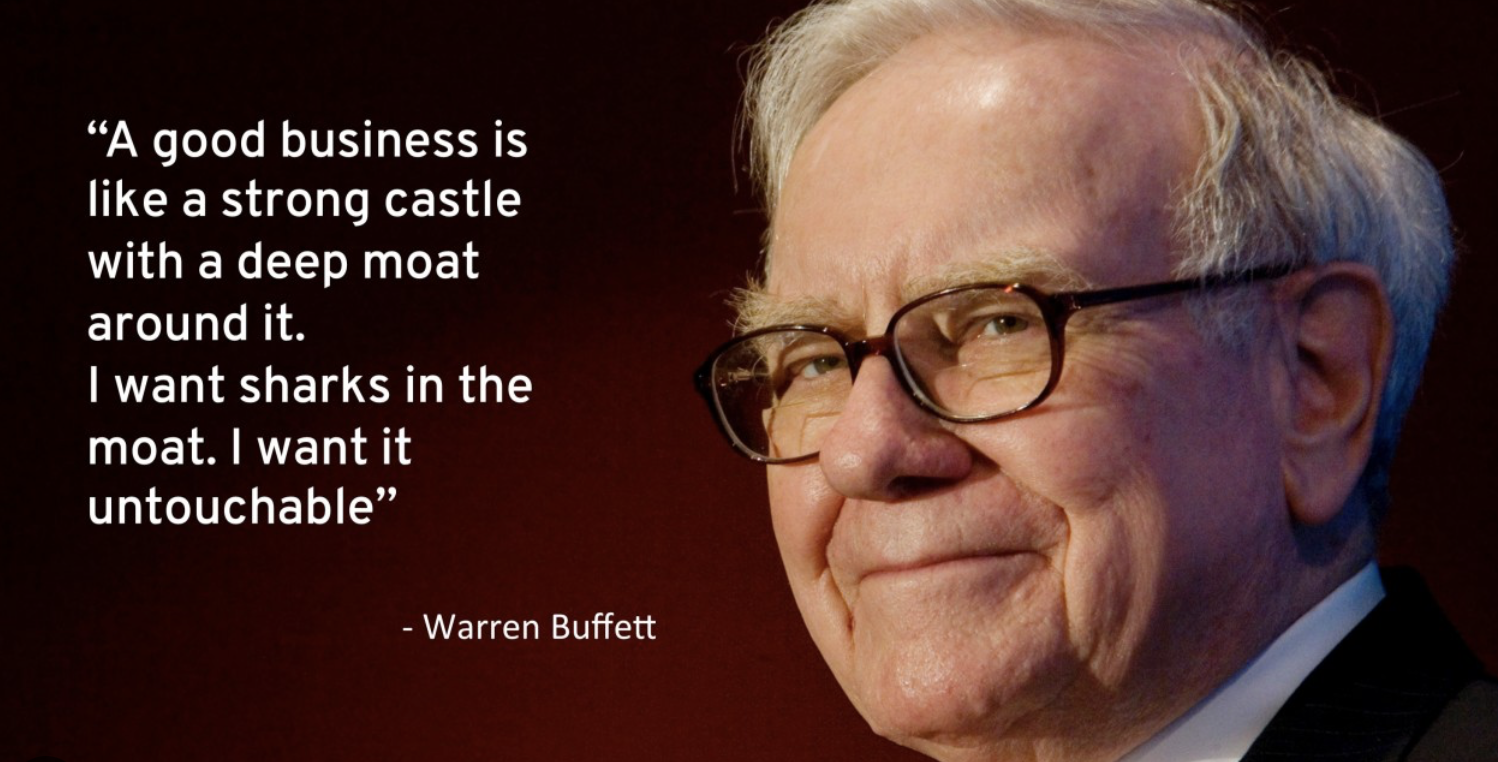
Super Stock List for 2025
Superior businesses with wide moats can have a very long runway. Their stocks reflect their business strength in the long run. We list super stocks for the various periods including up to last 50 years.
-
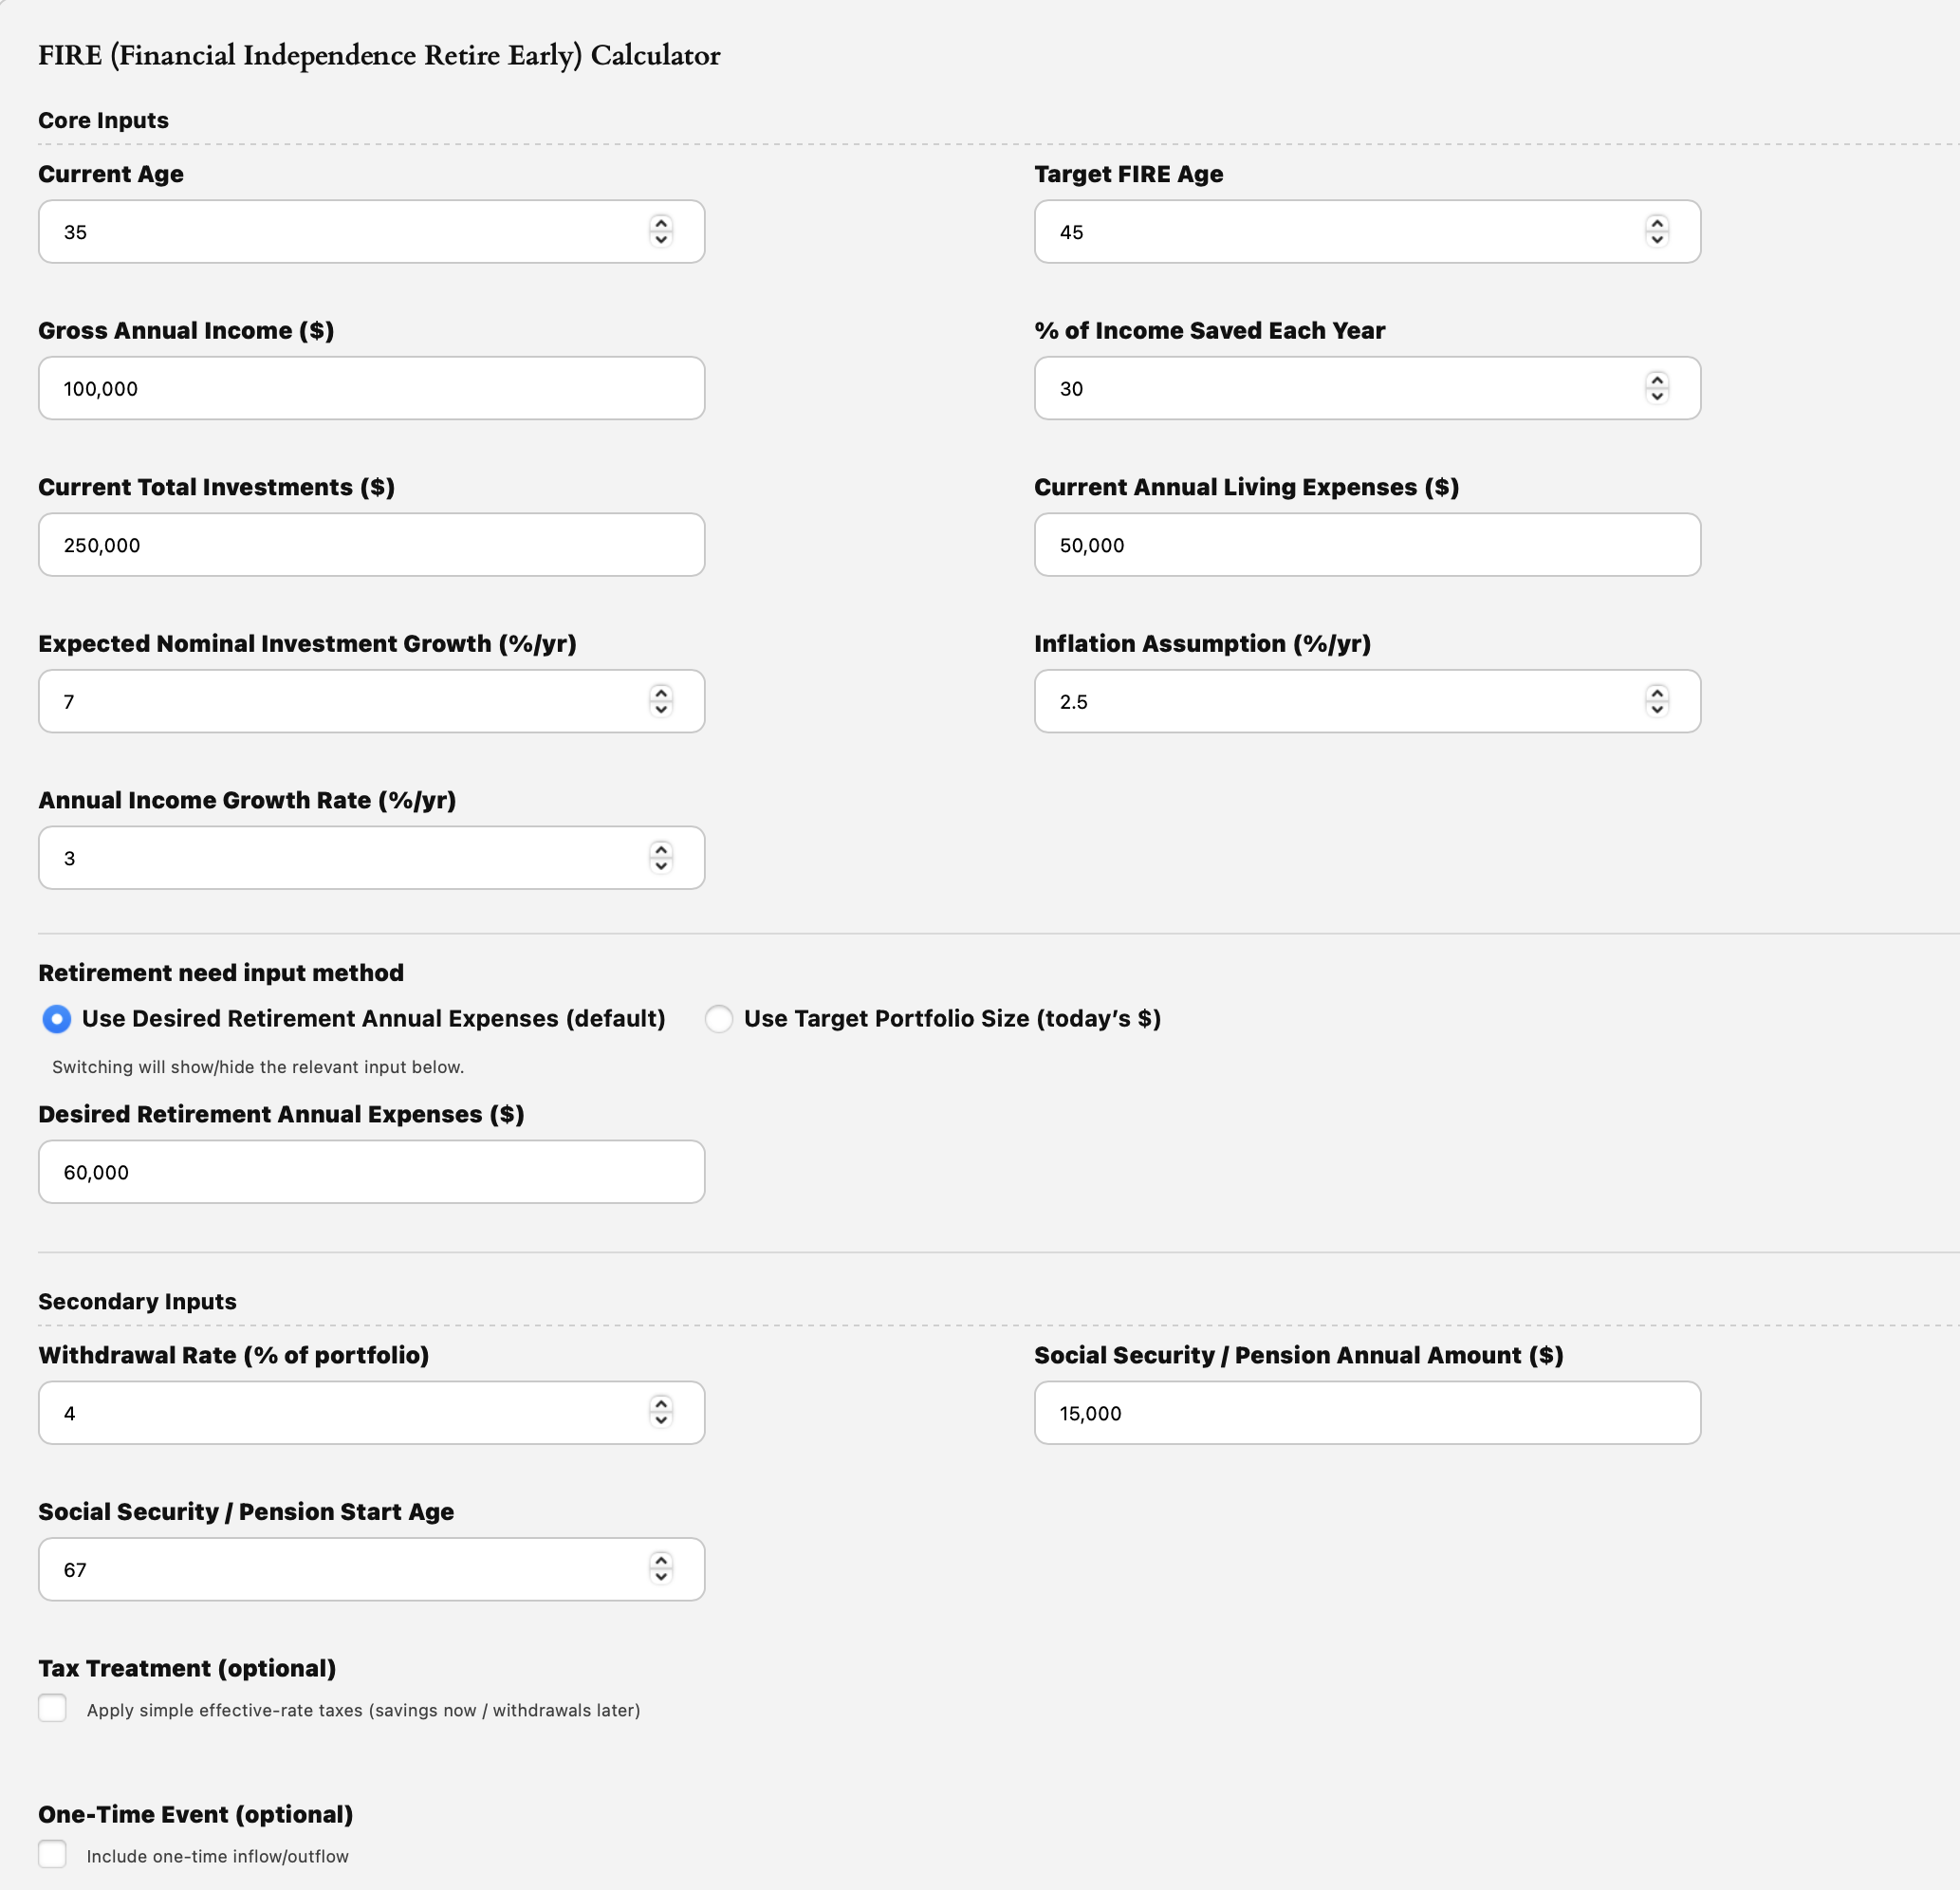
Good Time to FIRE (Financial Independence Retire Early)?
- Latest in Retirement Savings & Personal Finance: Fed to Cut Rate, AI Big Spend, Oracle of Oracle
- Good Time to FIRE (Financial Independence Retire Early)?
- Tools & Tips: FIRE (Financial Independence Retire Early) Calculator
- Market Overview
-
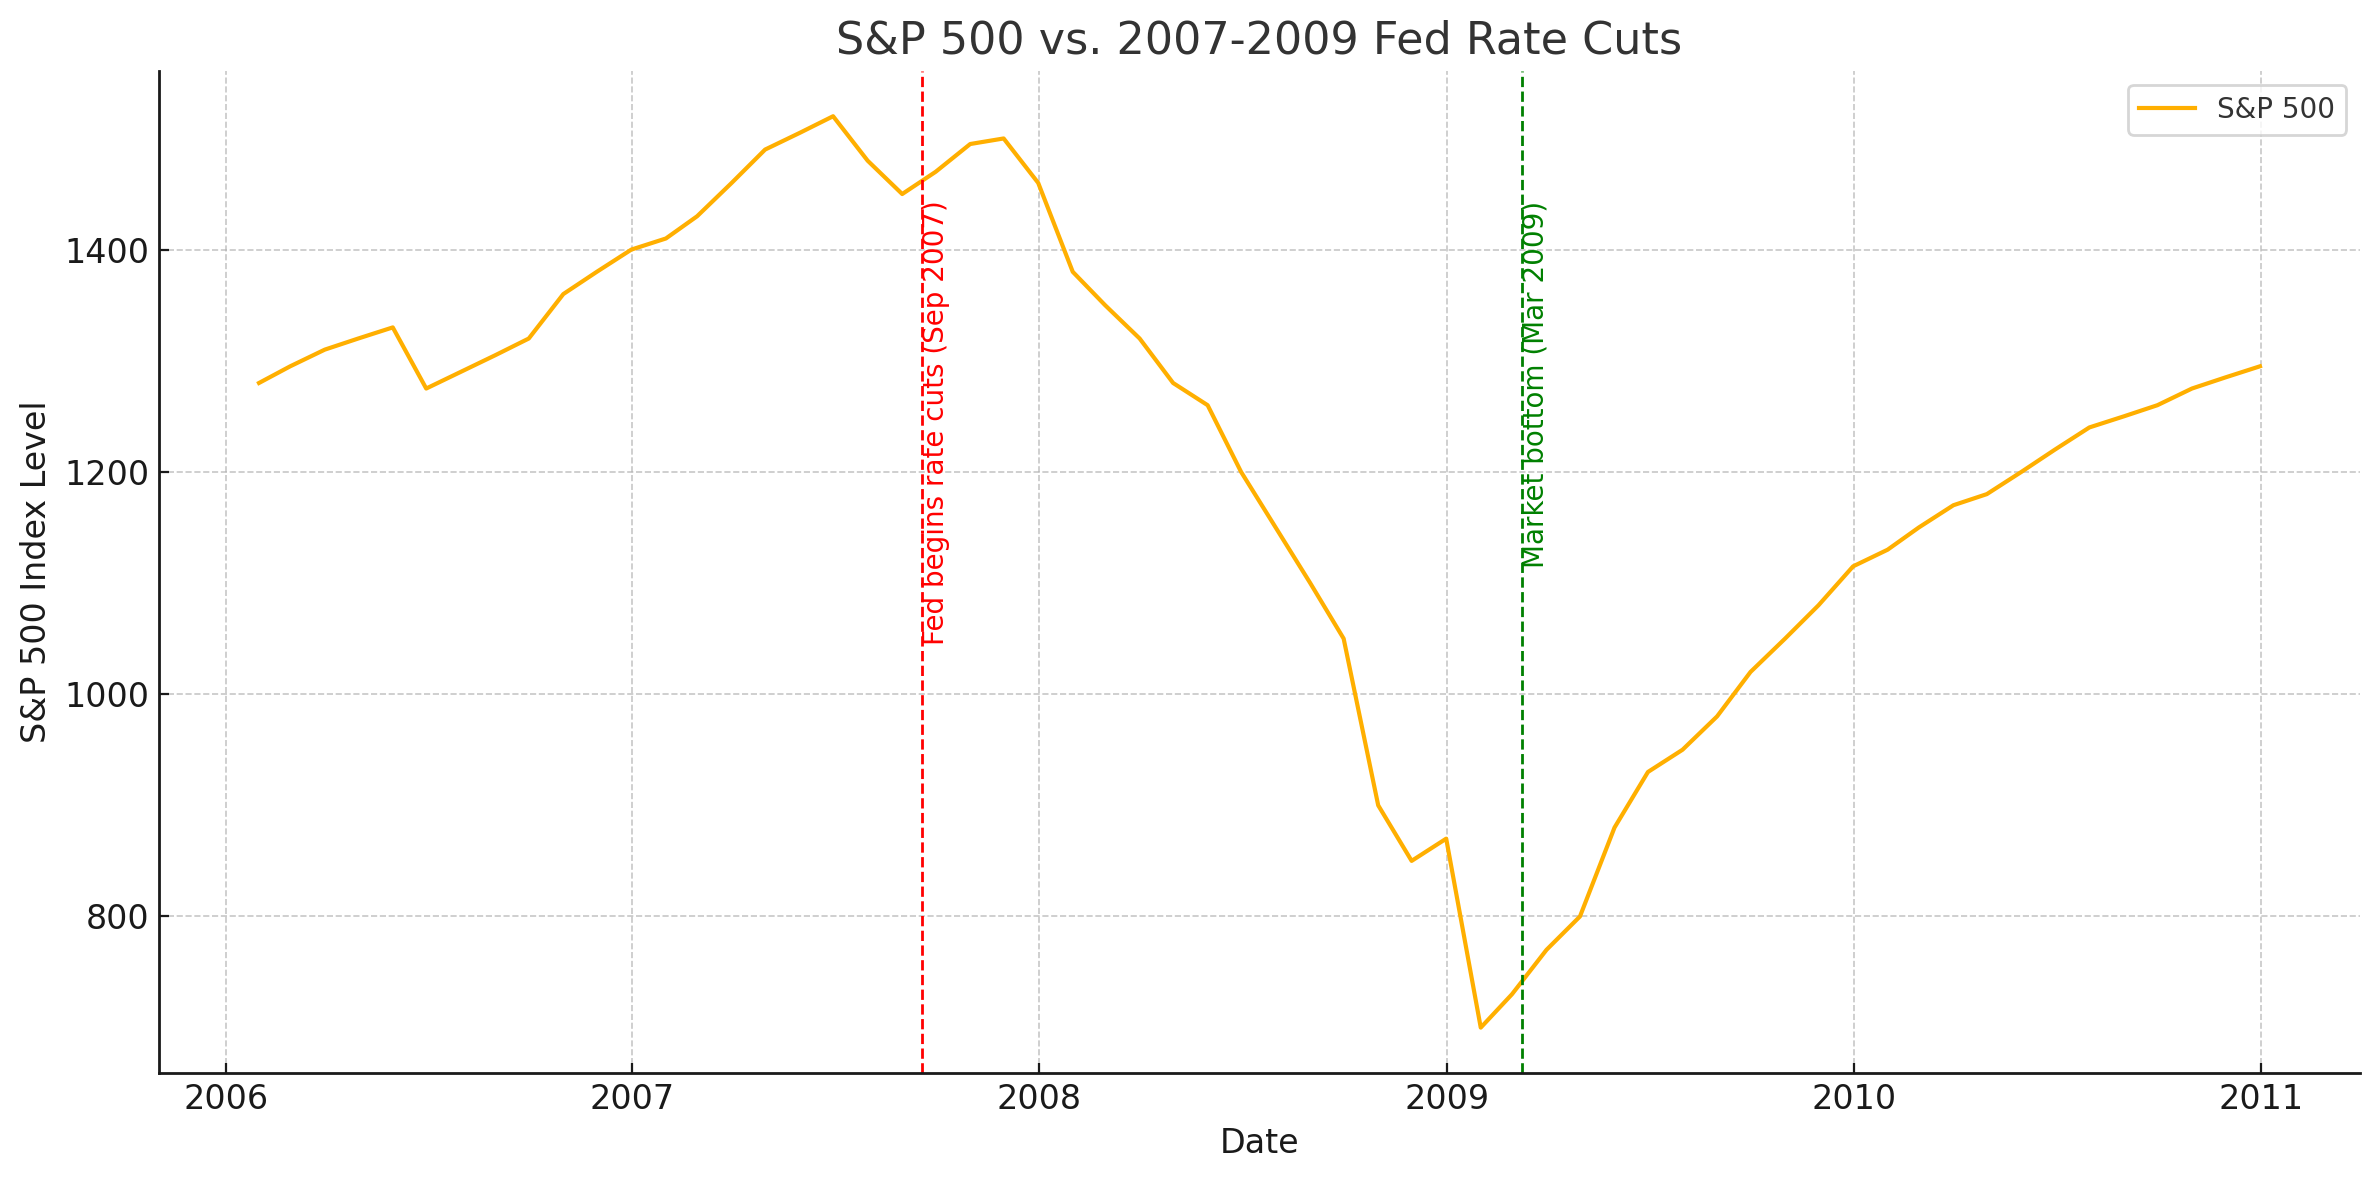
When the Fed Cuts Rates, What Really Happens to Stocks?
- Latest in Retirement Savings & Personal Finance: Job Growth Slowed, Gen Z Dipped into Retirement Savings, Best S&P 500 Earnings in Four Years
- When the Fed Cuts Rates, What Really Happens to Stocks?
- Tools & Tips: Total Compensation Calculator
- Market Overview
-
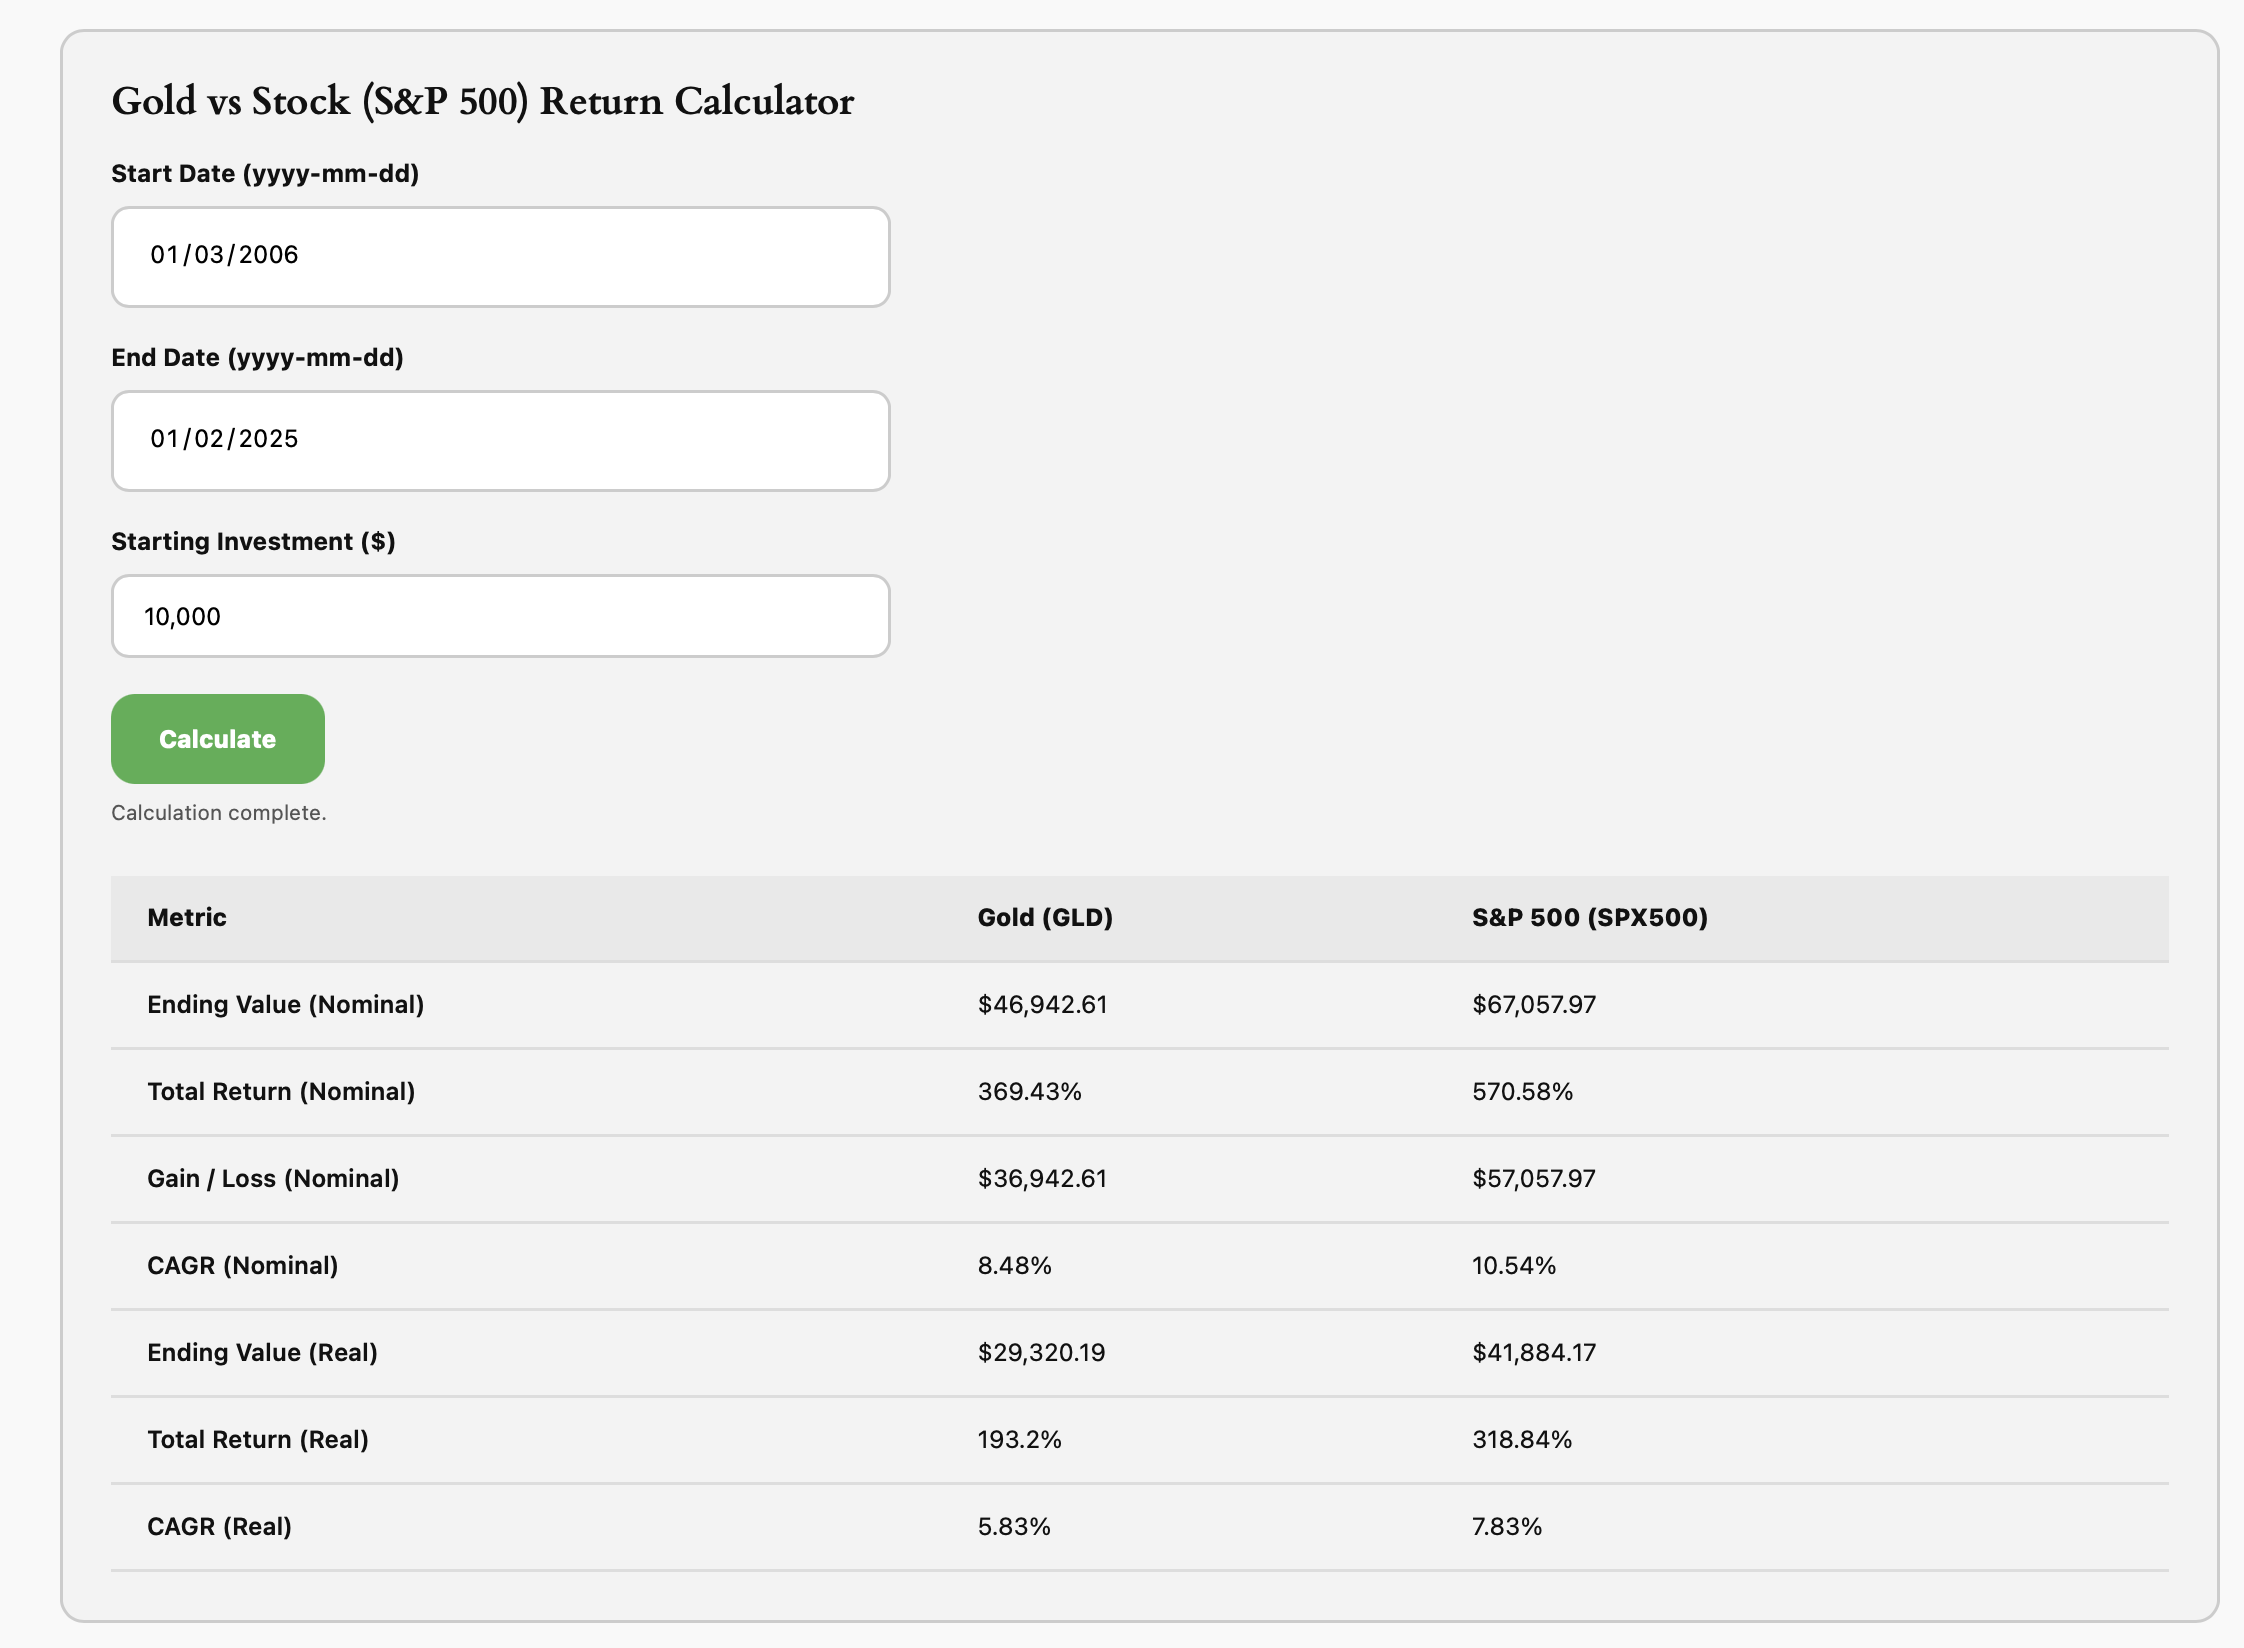
Gold Shines as a Store of Value
- Latest in Retirement Savings & Personal Finance: Rise in U.S. Bankruptcies, Surging Long-Term Bond Yields Worldwide
- Gold Shines as a Store of Value
- Tools & Tips: Gold vs Stock Return Calculator
- Market Overview
-
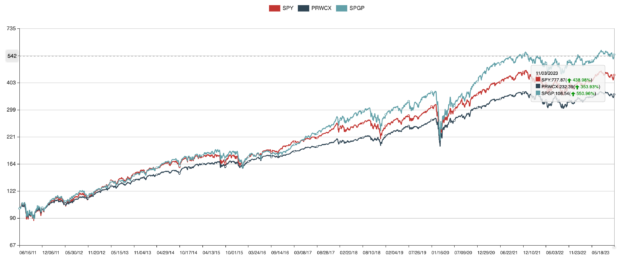
Growth At A Reasonable Price (GARP) Stock ETFs
We discuss two Growth At A Reasonable Price (GARP) ETFs: T. Rowe Price Capital Appreciation ETF TCAF and Invesco S&P GARP ETF SPGP. We further show one can again do better to outperform PRWCX by utilizing the GARP ETFs and total return bond portfolios
-
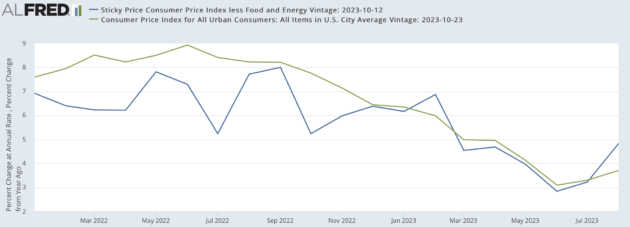
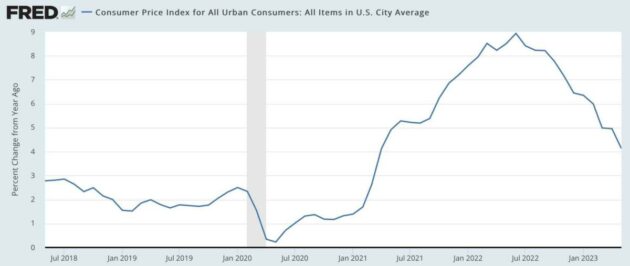
Market and Economy Review
We review the current economy and financial markets.
-
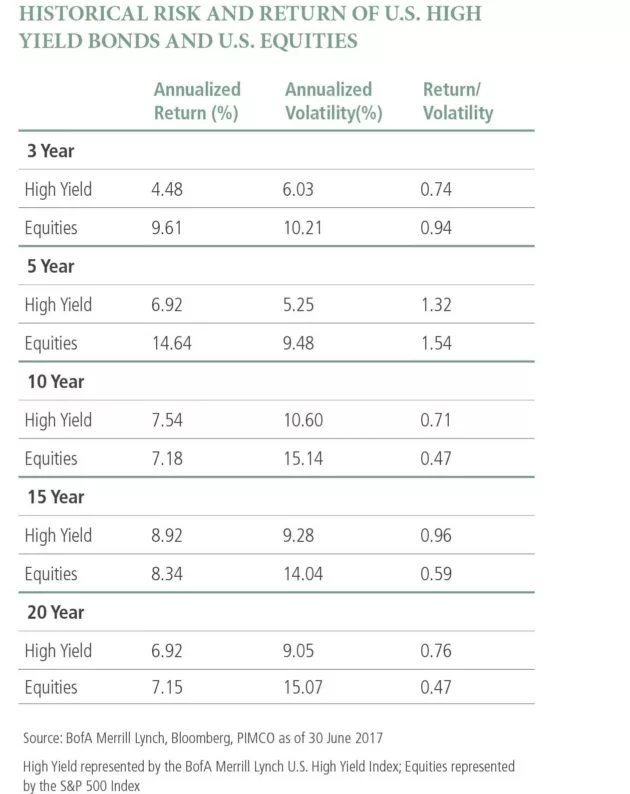
High Yield Bonds Are Good Alternatives For Aggressive Fixed Income Investors
High yield bonds, managed correctly, can be a valuable addition to boost fixed income returns.
-
Trends, Factors & Indicators
We look at several famous lazy portfolios and discuss asset allocations and diversification effect in portfolio construction.
-
Harry Browne’s Permanent Portfolio Long Term Performance
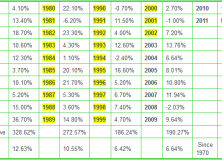
This is the latest update (as of 12/31/2016) of the performance of Harry Browne’s permanent portfolio. In 201, 6the portfolio returned 5.4% return. Since 1970, for the past 46 years, the average compound annual return of the permanent portfolio has been 8.5%. Harry Browne proposed the concept of permanent portfolio in his Fail-Safe Investing book in 1999. In the book, he showed the performance table of his ‘permanent portfolio’. The following table incorporated Harry Browne’s performance and the new performance since 2003. As of 12/31/2016: 1970 4.10% 1980 22.10% 1990 -0.70% 2000 2.70% 2010 11.92% 1971 13.40% 1981 -6.20% 1991 11.50% 2001 -1.00% 2011 8.16% 1972 18.70% 1982 23.30% 1992 4.00% 2002 7.20% 2012 5.5% 1973 10.60% 1983 4.30% 1993 12.60% 2003 13.76% 2013 -3.8% 1974 12.30% 1984 1.10% 1994 -2.40% 2004 6.64% 2014 7.6% 1975 3.70% 1985 20.10% 1995 16.60% 2005 8.01% 2015 -4.5% 1976 10.10% 1986 21.70% 1996 5.20% 2006 10.80% 2016 5.4% 1977 5.20% 1987 5.30% 1997 6.70% 2007 11.94% 1978 15.00% 1988 3.60% 1998 7.40% 2008 -2.03% 1979 36.70% 1989 14.80% 1999 4.70% 2009 9.64% Cumulative 328.62% 272.57% 186.24% 190.27% Annual 12.63% 10.55% 6.42% 6.64% Since 1970 8.48% The highlighted portion is from Browne’s book (page 81) and the rest is from MyPlanIQ’s Harry Browne Permanent Portfolio. Notice there is some discrepancy for performance between 2000 to 2002. This is because in MyPlanIQ’s portfolio, Vanguard funds and Gold ETF (GLD) are used while in Browne’s calculation, he uses the following: Stock results are for an S&P 500 Index mutual fund, including reinvestment of dividends. Bond results are for a 30-year T-bond, including interest received. Gold results are for American Eagle 1-ounce coins. Cash results are for Treasury bills, assuming a 1-year bill was bought at start of each year. Cash in MyPlanIQ’s Harry Browne Permanent Portfolio is modeled using 3 month Treasury bill’s returns. We will continue to update this table as time goes. See also Permanent Global Portfolio ETF Plan Permanent Portfolio ETF Plan
-
Harry Browne’s Permanent Portfolio Long Term Performance
This is the latest update (as of 12/31/2015) of the performance of Harry Browne’s permanent portfolio. In 2015, the portfolio had a negative -4.5% return. Since 1970, for the past 46 years, the average compound annual return of the permanent portfolio has been 8.35%. Harry Browne proposed the concept of permanent portfolio in his Fail-Safe Investing book in 1999. In the book, he showed the performance table of his ‘permanent portfolio’. The following table incorporated Harry Browne’s performance and the new performance since 2003. As of 12/31/2015: 1970 4.10% 1980 22.10% 1990 -0.70% 2000 2.70% 2010 11.92% 1971 13.40% 1981 -6.20% 1991 11.50% 2001 -1.00% 2011 8.16% 1972 18.70% 1982 23.30% 1992 4.00% 2002 7.20% 2012 5.5% 1973 10.60% 1983 4.30% 1993 12.60% 2003 13.76% 2013 -3.8% 1974 12.30% 1984 1.10% 1994 -2.40% 2004 6.64% 2014 7.6% 1975 3.70% 1985 20.10% 1995 16.60% 2005 8.01% 2015 -4.5% 1976 10.10% 1986 21.70% 1996 5.20% 2006 10.80% 1977 5.20% 1987 5.30% 1997 6.70% 2007 11.94% 1978 15.00% 1988 3.60% 1998 7.40% 2008 -2.03% 1979 36.70% 1989 14.80% 1999 4.70% 2009 9.64% Cumulative 328.62% 272.57% 186.24% 190.27% Annual 12.63% 10.55% 6.42% 6.64% Since 1970 8.35% The highlighted portion is from Browne’s book (page 81) and the rest is from MyPlanIQ’s Harry Browne Permanent Portfolio. Notice there is some discrepancy for performance between 2000 to 2002. This is because in MyPlanIQ’s portfolio, Vanguard funds and Gold ETF (GLD) are used while in Browne’s calculation, he uses the following: Stock results are for an S&P 500 Index mutual fund, including reinvestment of dividends. Bond results are for a 30-year T-bond, including interest received. Gold results are for American Eagle 1-ounce coins. Cash results are for Treasury bills, assuming a 1-year bill was bought at start of each year. Cash in MyPlanIQ’s Harry Browne Permanent Portfolio is modeled using 3 month Treasury bill’s returns. We will continue to update this table as time goes. See also Permanent Global Portfolio ETF Plan Permanent Portfolio ETF Plan
-
September 28, 2015: Risk Managed Strategic Asset Allocation Portfolios Revisited
At the current market environment, it is pertinent to explore how to adding a risk management layer to a strategic buy and hold portfolio.
-
Asset Class Trend: Large Cap Growth Stocks Stand out
In this volatile and uncertain environment, proper asset allocation is the first step to ensure safety for a long term retirement investment (such as a 401K, 403B or variable annuity) portfolio. The second step is to decide what to invest in each asset identified in the first step. It has been well recognized that high quality, multi-national large cap growth companies are the place to invest in equity portion of a portfolio. The following table shows how U.S. stock styles stack up currently. Assets Class Symbols 12/06 Trend Score 11/29 Trend Score Direction Russell Largecap Growth IWF 3.25% -1.19% ^ Russell Largecap Index IWB 2.85% -2.09% ^ Russell Largecap Value IWD 2.67% -2.83% ^ Russell Smallcap Growth IWO 2.51% -4.92% ^ Russell Smallcap Index IWM 2.01% -5.33% ^ Russell Midcap Value IWS 1.68% -3.36% ^ Russell Midcap Indedx IWR 1.56% -3.5% ^ Russell Smallcap Value IWN 1.53% -5.94% ^ Russell Midcap Growth IWP 1.49% -3.47% ^ The trend score is defined as the average of 1,4,13,26 and 52 week total returns (including dividend reinvested). Large cap growth stocks are usually those high quality (stable cash flow, higher earnings growth) companies. Russell Large Cap Growth ETF (IWF) has the following top 10 holdings: Company Symbol % Assets Apple Inc. AAPL 5.44 Exxon Mobil Corporation Common XOM 4.50 International Business Machines IBM 3.51 Microsoft Corporation MSFT 2.92 Google Inc. GOOG 2.32 Coca-Cola Company (The) Common KO 2.04 Philip Morris International Inc PM 1.89 Oracle Corporation ORCL 1.85 Schlumberger N.V. Common Stock SLB 1.57 Pepsico, Inc. Common Stock PEP 1.56 Most of them are multi-national companies that derive revenues worldwide. See also High Quality Stock ETN: Morningstar Wide Moat Focus