|
Vanguard ETF: |  |
7.4%* |
|
Diversified Core: | |
8.1%* |
|
Six Core Asset ETFs: | |
7.3%* |
Articles on DBA
- Countries All Drop -- India significantly, Japan only a little
11/16/2010
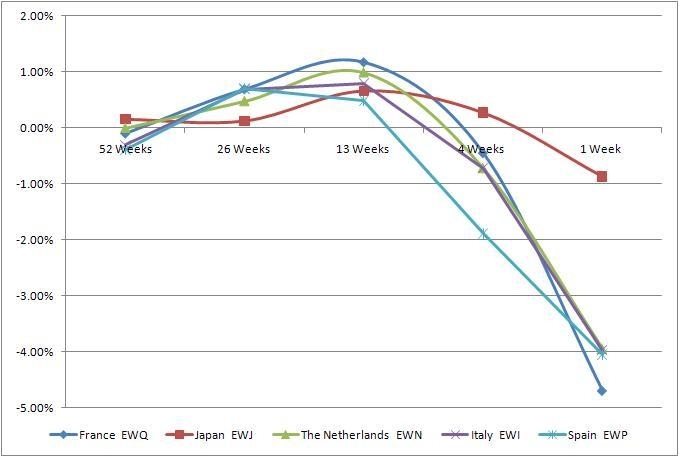
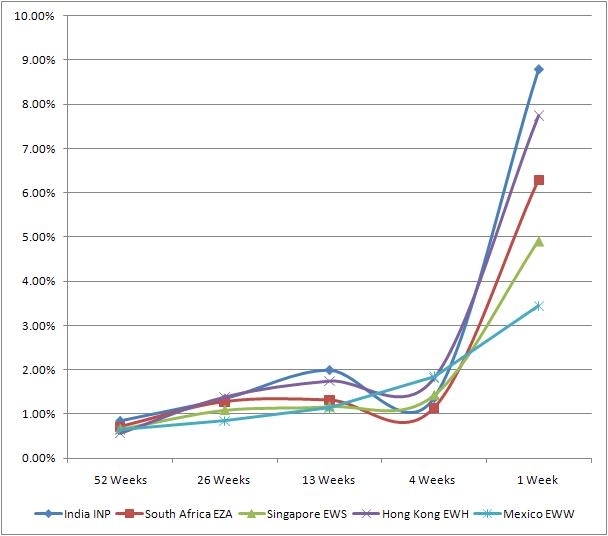
MyPlanIQ tracks detailed weekly country economic trend movement. We use ETFs that represent each geographic region and present the results here.
This is the second week of coverage and with QE2 and G20 meetings behind us. Each sovereign nation will deal with their own challenges as they react changes on the international stage.
More details are available on the MyPlanIQ website.
The largest industrial nations are meeting in Seoul this week and one of the topics on the agenda is rebalancing global growth.Nation
Symbol
15-Nov Trend Score
Direction
8-Nov Trend Score
Hong Kong
EWH
16%
v
21%
South Africa
EZA
14%
v
20%
Singapore
EWS
13%
v
18%
India
INP
12%
v
24%
Mexico
EWW
12%
v
16%
Malaysia
EWM
11%
v
16%
South Korea
EWY
10%
v
15%
Germany
EWG
8%
v
13%
Taiwan
EWT
8%
v
13%
United Kingdom
EWU
8%
v
12%
Russia
RSX
7%
v
15%
Canada
EWC
7%
v
11%
Australia
EWA
7%
v
15%
China
FXI
6%
v
12%
Switzerland
EWL
6%
v
12%
Belgium
EWK
5%
v
11%
Austria
EWO
5%
v
11%
Brazil
EWZ
5%
v
12%
France
EWQ
4%
v
10%
Japan
EWJ
4%
v
4%
The Netherlands
EWN
4%
v
9%
Italy
EWI
1%
v
5%
Spain
EWP
-1%
v
1%
India and Russia see the biggest change with India dropping out of the top three.
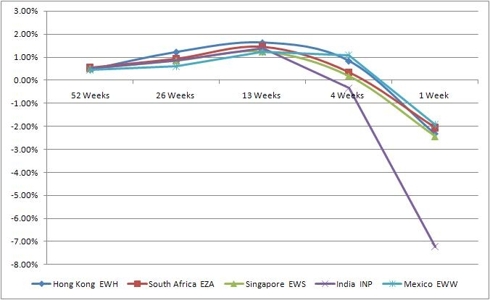
With the exception of India, the top of the group behave in a similar way as the markets pulled back in the second half of the week.
India will be one to watch to see if it bounces back next week.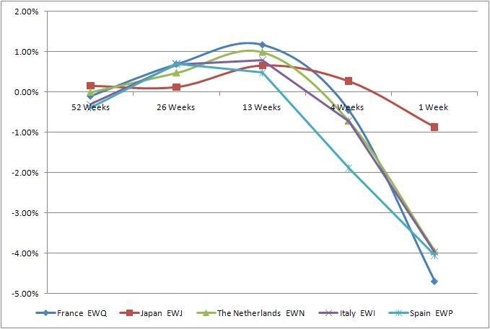
The countries at the bottom of the list also reacted in a cluster dropping around 4% with the exception of Japan that has a much more muted response.
Clearly the last week has been a challenging one and we will have to watch which ones rebound and to what extent.labels:investment,
Symbols:INP,EZA,EWS,EWH,EWW,EWM,EWY,RSX,EWA,EWT,EWC,EWZ,EWL,EWG,EWU,FXI,EWK,EWN,EWJ,EWQ,EWO,EWI,EWP,SPY,QQQQ,IWM,MDY,EFA,VEU,EEM,VWO,IYR,ICF,VNQ,GSG,DBC,DBA,USO,LQD,CSJ,CIU,HYG,JNK,PHB,TLT,IEF,SHY,SHV,BND,AGG,MUB,MBB,
- ETF Based Major Asset Class Trend Indicators For The Week of November 15
11/15/2010
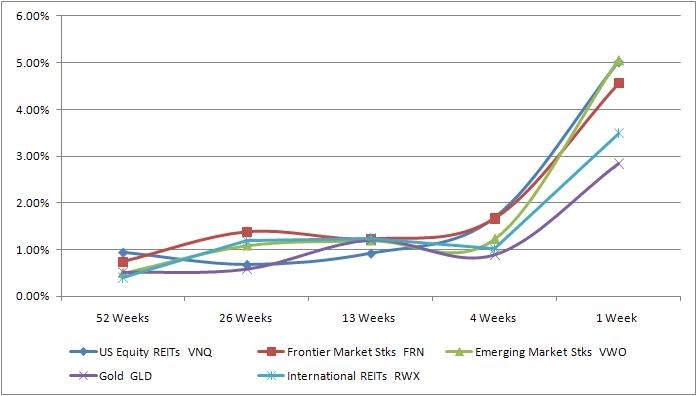
Last week, MyPlanIQ initiated tracking major asset classes trend movement. These asset trends provide insights into underlying economic and market segments and are critical to tactical asset allocation strategies. We use ETFs that represent the asset class indices. For more information, please visit MyPlanIQ 360 Degree Market View.
Now that the QE2 initiative is "old news", some of the bullishness has also evaporated. Without further policy initiatives or data showing strength in the economy, there will be concern that Wall Street's rally may be running out of fuel.However, a week of positive data could give investors hard evidence to justify a rally that lifted the S&P 500 ~ 17% from the August 31 close to the 2010 closing high hit November 5.
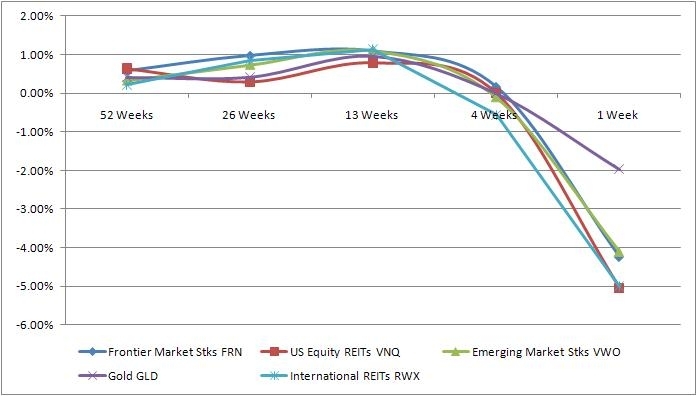
There are some concerning signson the horizon and last week the major US indices all lost over 2%. This is reflected in the major asset class trend indicators which are all down even if the relative rankings are largely unchanged.
Description
Symbol
15-Nov Trend Score
Direction
8-Nov Trend Score
Frontier Market Stks
FRN
13%
v
20%
US Equity REITs
VNQ
9%
v
18%
Emerging Market Stks
VWO
9%
v
16%
Gold
GLD
9%
v
13%
International REITs
RWX
8%
v
15%
US Stocks
VTI
7%
v
10%
International Developed Stks
EFA
6%
v
9%
US High Yield Bonds
JNK
5%
v
8%
Commodities
GSG
5%
v
7%
Emerging Mkt Bonds
PCY
5%
v
9%
Intermediate Treasuries
IEF
3%
v
5%
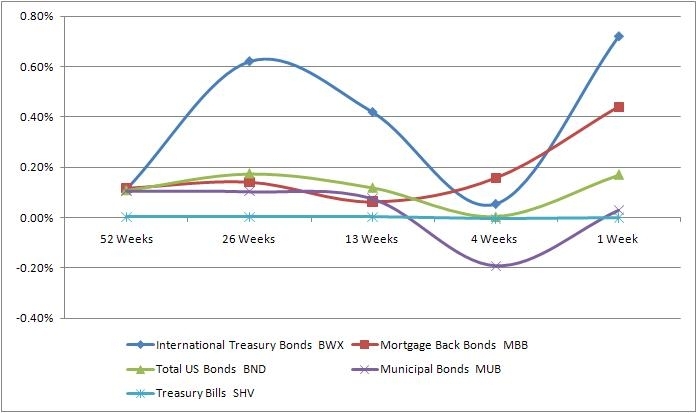
International Treasury Bonds
BWX
3%
v
6%
US Credit Bonds
CFT
2%
v
4%
Mortgage Back Bonds
MBB
1%
v
2%
Total US Bonds
BND
1%
v
2%
Treasury Bills
SHV
0%
v
0%
Municipal Bonds
MUB
-1%
v
2%
Top Five Indicators
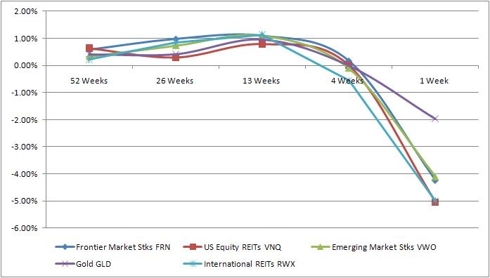
Emerging markets are going to react to the US market fluctuations and real estate is still edgy as it was a major cause of the current crisis. Gold is also down but much more heavily damped as it will continue to have strength based on inherent value and as currencies are under pressure.
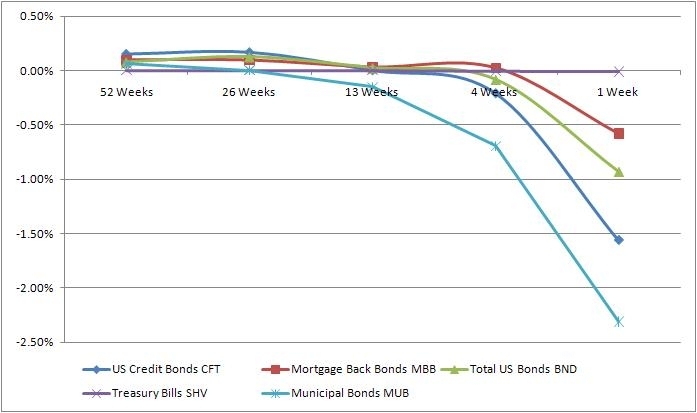
Bottom Five Indicators
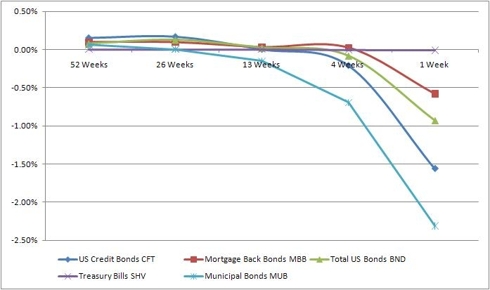
The bonds see some depression but are less volatile than the top asset classes.
In conclusion, the excitement from QE2 is over and we will see whether this down trend continues and we see a reversal towards more fixed income asset classes being desirable.labels:investment,
Symbols:EEM,VNQ,FRN,VWO,IYR,ICF,GLD,RWX,VTI,SPY,IWM,PCY,EMB,JNK,HYG,PHB,EFA,VEU,IEF,TLT,GSG,DBC,DBA,CFT,BWX,MBB,BND,MUB,SHV,AGG,
- ETFs Provide Insight Into U.S. Sectors' Performance
11/12/2010
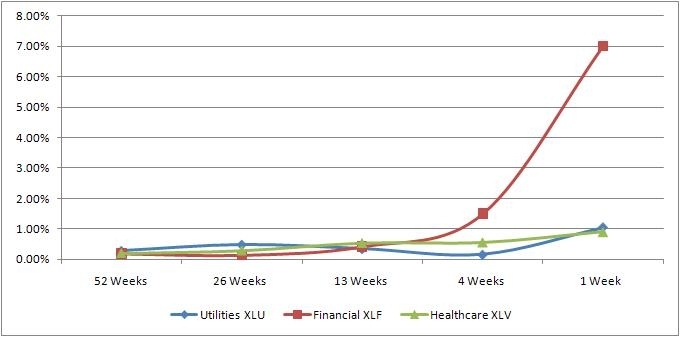
US sectors provide insight into the parts of the US economy that are flourishing or floundering. We are tracking the ETFs that represent ten different financial sectors.
More details are available on the MyPlanIQ website.
Description
Symbol
8-Nov Trend Score
Direction
Consumer Discretionary
(XLY)
14%
Week 1
Materials
(XLB)
13%
Week 1
Telecom
(IYZ)
13%
Week 1
Technology
(XLK)
12%
Week 1
Industries
(XLI)
11%
Week 1
Energy
(XLE)
10%
Week 1
Consumer Staples
(XLP)
7%
Week 1
Utilities
(XLU)
7%
Week 1
Financial
(XLF)
6%
Week 1
Healthcare
(XLV)
6%
Week 1
click to enlarge
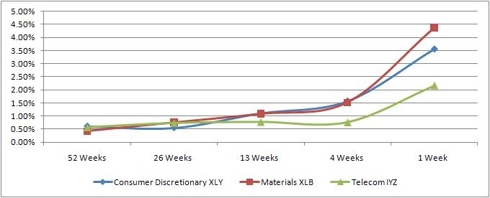
We are entering the holiday period with the QE2 wind at our backs. This is going to increase consumer confidence and consumer spending.
The materials and commodity sectors have jumped due to a weak dollar, which the QE2 program exacerbates. It is also likely to stimulate demand for materials further pushing up the price.
The telecom sector includes wireless phone providers and they will likely do well through the holiday period with the increasing success of smart phones.
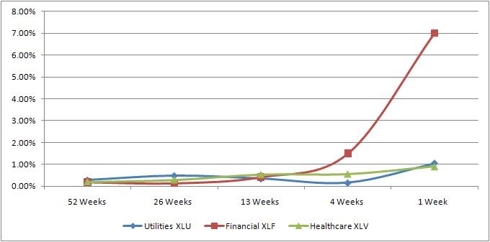
With the Republican victory in the House, some analysts are talking a lot these days about utilities stocks -- the reason being that the sector may benefit from the higher likelihood that the 15% tax rate on dividends will be extended.
The financial sector is still recovering from its meltdown and will continue to be under pressure with continuing concerns with mortgage stability and general fragility.
Healthcare's overall performance has been under pressure in this economic environment. Despite a substantial portion of their products being required for survival, sales remain sluggish. As a result, a wave of consolidation has gobbled up mid-cap companies with new products.
Some of these sectors will peak in the holiday season while others will settle over a longer time period as the political and economic climate evolves.
labels:investment,
Symbols:AGG,BND,CIU,CSJ,DBA,DBC,EEM,EFA,GSG,HYG,ICF,IEF,IWM,IYR,IYZ,JNK,LQD,MBB,MDY,MUB,PHB,QQQQ,SHV,SHY,SPY,TLT,USO,VEU,VNQ,VWO,XLB,XLE,XLF,XLI,XLK,XLP,XLU,XLV,XLY,
- International ETF's Give Insight on Global Economies
11/10/2010
While the world is becoming more connected, local conditions prevail resulting in different economic returns. MyPlanIQ tracks detailed weekly country economic trend movement. We use ETFs that represent each geographic region and present the results here.
More details are available on the MyPlanIQ website.
The largest industrial nations are meeting in Seoul this week and one of the topics on the agenda is rebalancing global growth.Country Symbol 8-Nov Trend Score Direction India INP 57% Week 1 South Africa EZA 47% Week 1 Singapore EWS 43% Week 1 Hong Kong EWH 42% Week 1 Mexico EWW 41% Week 1 Malaysia EWM 40% Week 1 South Korea EWY 37% Week 1 Russia RSX 34% Week 1 Australia EWA 29% Week 1 Taiwan EWT 28% Week 1 Canada EWC 28% Week 1 Brazil EWZ 21% Week 1 Switzerland EWL 21% Week 1 Germany EWG 20% Week 1 United Kingdom EWU 20% Week 1 China FXI 19% Week 1 Belgium EWK 13% Week 1 The Netherlands EWN 13% Week 1 Japan EWJ 12% Week 1 France EWQ 9% Week 1 Austria EWO 9% Week 1 Italy EWI -7% Week 1 Spain EWP -17% Week 1
India continues its growth as the recent visit of President Obama signals. There is increasing pressure for India to open its markets to the US to make the relationship a two way street.
South African Finance Minister Pravin Gordhan said the U.S. decision to purchase bonds to pump money into the economy may push up the rand and cost jobs. Group of 20 nations meeting in South Korea this week need to agree on ways to stimulate their economies without damaging those of others.
SINGAPORE Airlines has reported a second-quarter profit of $380 million, reversing a $159 million loss during the same July-September period last year. The results were delivered on the back of a 18 per cent jump in revenue to $3.63 billion, as load factors and yields continued to improve, the airline said on Tuesday.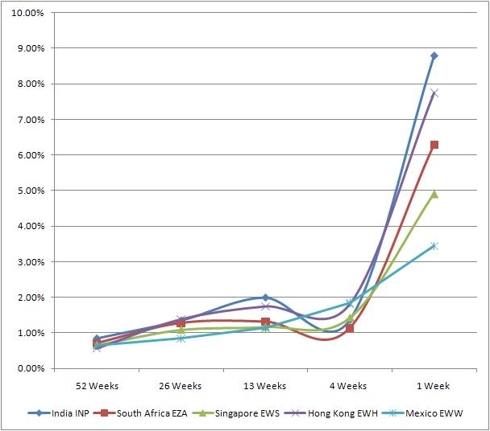
Hong Kong launched a campaign Monday to promote itself as a global financial hub and rejected suggestions that it was trying to counter growing competition from Shanghai.
President Felipe Calderón, declared his support for small and medium businesses, which produce 7 out of the 10 jobs in Mexico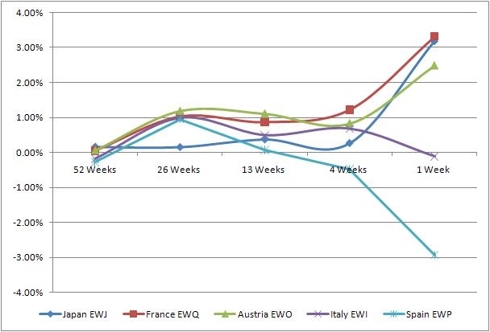
Japanese Prime Minister Naoto Kan on Tuesday pledged to bring Japan into the Trans-Pacific Strategic Economic Partnership Agreement, or TPP, saying the trade liberalization initiative will help the country return to a path of robust growth.
The Bank of France forecasts 0.5-percent fourth-quarter growth The French economy is struggling to put its strained public finances in order. There have been many protests about the move to increase the retirement age.
Recently the Austrian government greed to a rigid austerity budget which involves massive social cuts. At the same time, the government plans to raise taxes primarily for lower and middle income brackets.
Italy is the Eurozone's third largest economy, accounting for about 17% of GDP and has come through in reasonable shape. The banks are strong and Italians are Europe's best savers. Recently the the European Commission raised its growth forecast for Italy, projecting that faster export growth will see GDP expand by 1.1% this year up from 0.8% forecast in May.
Spain's troubled banking sector is back in the news again. Despite the apparently succesful stress tests carried out over the summer problems persist, and don't seem likely to go away soon. Foremost among these is the steady rise in problem loans which have now risen to an all-time high, potentially endangering the credit rating of the country's financial institutions, according to a recent report from the credit ratings agency Moody's.
In conclusion, the G20 meeting is the big ticket item this week and what results could impact the direction of the indicators.
labels:investment,
Symbols: INP,EZA,EWS,EWH,EWW,EWM,EWY,RSX,EWA,EWT,EWC,EWZ,EWL,EWG,EWU,FXI,EWK,EWN,EWJ,EWQ,EWO,EWI,EWP,SPY,QQQQ,IWM,MDY,EFA,VEU,EEM,VWO,IYR,ICF,VNQ,GSG,DBC,DBA,USO,LQD,CSJ,CIU,HYG,JNK,PHB,TLT,IEF,SHY,SHV,BND,AGG,MUB,MBB,
- ETF Based Major Asset Class Trend Indicators For The Week of November 8
11/08/2010
MyPlanIQ tracks major asset classes trend movement. Major asset trends provide insights into underlying economic and market segments and are critical to tactical asset allocation strategies. We use ETFs that represent the asset class indices. For more information, please visitMyPlanIQ 360 Degree Market View.
The Fed announced $600 billion treasury purchase, the so called QE2 that pushed most risk assets price higher. Risk assets like emerging market stocks, foreign stocks, US stocks, REITs and commodities had risen higher even before the announcement, partly due to QE2 anticipation and partly due to perceived improved economic conditions.
It is also believed that QE2 will result in US dollar devaluation and that in turns has led so called ‘commodity stockpiling’ propelling Gold and other commodities (such as agricultural commodities) to continue their recent ascent.
The only major trend change worth watching is the prices of long term treasury bonds, especially 10+ years which have continued weakness. It illustrates the market's belief that in the longer term, the Fed's actions will result in higher inflation.Asset Class Symbol 8-Nov Trend Score Direction US Equity REITs VNQ 57% ^ Frontier Market Stks FRN 47% ^ Emerging Market Stks VWO 34% ^ Gold GLD 32% v International REITs RWX 28% ^ US Stocks VTI 25% ^ Emerging Mkt Bonds PCY 20% ^ US High Yield Bonds JNK 19% ^ International Developed Stks EFA 15% ^ Intermediate Treasuries IEF 14% ^ Commodities GSG 11% ^ US Credit Bonds CFT 11% v International Treasury Bonds BWX 8% ^ Mortgage Back Bonds MBB 7% ^ Total US Bonds BND 6% ^ Municipal Bonds MUB 6% ^ Treasury Bills SHV 0% ^
Top Five Indicators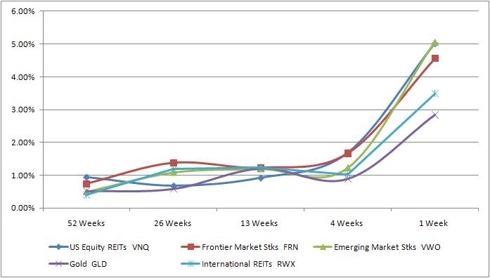
US REITs have been very strong all year, defying the perception of a weak real estate market. Emerging market and frontier markets continue their recent strength. Gold is approaching its all time high.
Bottom Five Indicators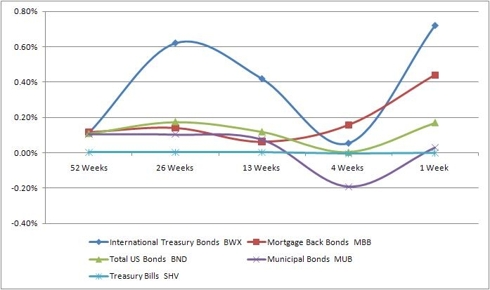
All the bottom five asset classes are fixed income, pointing to an increasing risk appetite.
In conclusion, other than long term treasury bonds, assets exhibit their continuous trends and have become stronger since QE2 announcement.labels:investment,
Symbols:EEM,VNQ,FRN,VWO,IYR,ICF,GLD,RWX,VTI,SPY,IWM,PCY,EMB,JNK,HYG,PHB,EFA,VEU,IEF,TLT,GSG,DBC,DBA,CFT,BWX,MBB,BND,MUB,SHV,AGG,
- Amber Waves of Pain: Commodities ETFs Are Killing Investors
07/26/2010