 |
Vanguard ETF: |  |
7.4%* |
|
Diversified Core: | |
8.1%* |
|
Six Core Asset ETFs: | |
7.3%* |
Articles on SPY
- Recent Calamities Don’t Slow Down US Equities But What’s Coming Next is Anybody’s Guess
03/30/2011
Catastrophic events in Japan left the world in shock, and brought an economic powerhouse to a temporary standstill seems to have had little impact on US equities as the immediate drama dies down. North Africa and the Middle East still have the possibility of exploding.
Despite everything, US growth appears to be still on track. Labor markets and last quarter’s GDP 3.1% shows the economy is moving in the right direction despite consumer sentiment being on the low side which is to be expected with current events.
US ASSETS CLASS RETURNS
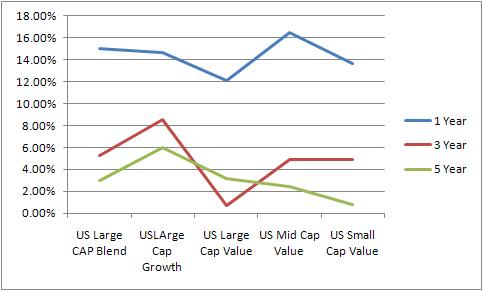
In US Equities, Large Cap Value is towards the bottom of the table as investors are looking for more risk with higher returns. However, in the light of current events and evidence of risk, large cap (safe) and value (higher return) may be an interesting compromise. Over the past five years US LARGE CAP GROWTH (ETF) has the highest 5 year returns and US MID CAP VALUE (ETF) the highest one year return.
Description
Symbol
1 Yr
3 Yr
5 Yr
1 Yr Sharpe
SPDR Dow Jones Industrial Aver
12.09%
0.73%
3.17%
72.34%
Vanguard Dividend Appreciation
11.54%
3.01%
NA
69.21%
Vanguard Value ETF
11.43%
-0.38%
1.43%
62.67%
iShares Dow Jones Select Divid
11.23%
-1.78%
-1.82%
73.78%
iShares Russell 1000 Value Ind
11.04%
-1.14%
0.29%
59.07%
iShares S&P 500 Value Index
10.73%
-1.73%
-0.29%
55.86%
SPDR S&P Dividend
8.88%
3.44%
2.12%
54.49%
This chart shows the top large cap value ETFs based on volume and return. Without sufficient volume, any ETF can suffer low liquidity or high trading friction.
The best performers in the US Large cap value stocks are:
1. SPDR Dow Jones Industrial Aver (DIA)
2. Vanguard Dividend Appreciation (VIG)
DIA is star performer in terms of return the 1 year returns are 12.09 % with an average volume of 7.8 million. The 5 year yields are also the highest at 3.17% giving us added confidence.
VIG is the second best perfomer with the return of 11.54% in year although the VIG is a new ETF being in market for less than 5 years the overall performance is very good the three year yields are 3%.
The large cap value ETF are those whose values are above that $10 billion, the size of these ETF’s give them the favourable advantage in the event of volatile period as these fund related investments are less riskier due to the change in terms of environmental factor.
Currently they are out of favour with those who are looking for return but in these days of increasing risk awareness, perhaps they will come back into fashion.
Disclosure:
MyPlanIQ does not have any business relationship with the company or companies mentioned in this article. It does not set up their retirement plans. The performance data of portfolios mentioned above are obtained through historical simulation and are hypothetical.
Symbols:DIA,DVY,IVE,IWD,SDY,VIG,VTV,SPY,VTI,
Symbols: (NYSE: DIA), (NYSE: DVY), (NYSE: IVE), (NYSE: IWD), (NYSE: SDY), (NYSE: VIG), (NYSE: VTV), (NYSE: SPY), (NYSE: VTI)
- Caterpillar's 401K Retirement Plan: Reasonable Investment Choices But Could Be More Systematic
03/28/2011
Caterpillar Inc. (CAT) manufactures and sells construction and mining equipment, diesel and natural gas engines, and industrial gas turbines worldwide. The company was formerly known as Caterpillar Tractor Co. and changed its name to Caterpillar Inc. in 1986. Caterpillar was founded in 1925 and is headquartered in Peoria, Illinois.
In this article, w report on Caterpillar Inc Investment Trust which is the master trust for Caterpillar's 401k plan.
The investment trust consists of 10 funds. These funds enable participants to gain exposure to 3 major assets: US Equity, Foreign Equity, Fixed Income.
The following table lists the asset classes those funds cover:
Asset Class Name MID-CAP BLEND SPDR S&P MidCap 400 LARGE BLEND iShares Russell 1000 Index LARGE GROWTH iShares Russell 1000 Growth Index LARGE VALUE iShares Russell 1000 Value Index SMALL BLEND iShares Russell 2000 Index LARGE BLEND iShares Russell 3000 Index High Yield Bond JPMorgan High Yield Bond R5 Emerging Markets Bond JPMorgan Emerging Mkts Debt R5 Intermediate Bond JPMorgan Bond Instl Foreign Large Blend Vanguard Total Intl Stock Index Inv Asset Class Number of funds REITs 0 Balanced Fund 0 Fixed Income 2 Commodity 0 Sector Fund 0 Foreign Equity 1 Emerging Market Equity 0 US Equity 6 Other 1 Total 10 As of Mar 25, 2011, this plan investment choice is rated as average based on MyPlanIQ Plan Rating methodology that was designed to measure how effective a plan's available investment funds are . It has the following detailed ratings:
Diversification -- Rated as below average (14%)
Fund Quality -- Rated as average (61%)
Portfolio Building -- Rated as average (60%)
Overall Rating: average (46%)Discussions
The trust presents an interesting lineup of investment choices: in the U.S. equities, it covers large, mid-cap and small cap stocks. In large cap stocks, it further gives choices in growth and value styles. But it decides to give only mid-cap blend and small blend stock styles to the participants. For international equity, it has only one choice.
On the fixed income side, it is getting more interesting: in addition to a broad base bond index fund (JPMorgan Bond Instl), it gives a high yield (junk) bond fund and an emerging market bond fund, both are at the end of the highest risk spectrum among fixed income (bond) funds.
A natural question to ask is why only those two fixed income funds? How about fixed income funds in other categories such as investment grade corporate bond, long treasury bonds or international bonds. Maybe the reason behind this is that the bond index fund covers most of the short, intermediate term government and corporate bonds. Offering two highest risk bond funds would allow participants to increase their risk premiums.
Portfolio Discussions
The chart and table below show the historical performance of moderate model portfolios employing strategic and tactical asset allocation strategies. For comparison purpose, we also include the moderate model portfolios of a typical 3 asset SIB (Simpler Is Better) plan . This SIB plan has the following candidate index funds and their ETFs equivalent:
US Equity: SPY or VTI
Foreign Equity: EFA or VEU
Fixed Income: AGG or BND
Performance chart (as of Mar 25, 2011)The following portfolios are constructed using two typical asset allocation strategies: Strategic Asset Allocation and Tactical Asset Allocation.
Strategic Asset Allocation is based on well known modern portfolio theory and its key features include: diversification, proper fund selection and periodically re-balancing.
Tactical Asset Allocation works on a diversified array of assets provided by funds in a plan and adjusts asset mixes based on market conditions such as asset price momentum utilized by TAA.
Performance table (as of Mar 25, 2011)
Portfolio Name 1Yr AR 1Yr Sharpe 3Yr AR 3Yr Sharpe 5Yr AR 5Yr Sharpe Caterpillar Inc Investment Trust Tactical Asset Allocation Moderate 4% 34% 9% 110% 9% 91% Caterpillar Inc Investment Trust Strategic Asset Allocation Moderate 12% 131% 3% 25% 4% 26% Three Core Asset ETF Benchmark Tactical Asset Allocation Moderate -1% -9% 2% 23% 4% 32% Three Core Asset ETF Benchmark Strategic Asset Allocation Moderate 12% 89% 3% 15% 4% 16% This plan's Strategic Asset Allocaton moderate portfolio matches the three asset benchmark's one in terms of returns. However, it does have higher Sharpe ratio, indicating the virtue of the US asset class choices and the extra fixed income funds.
The Tactical Asset Allocation moderate portfolio beats its three asset counterpart by a big margin. This again is due to more fund choices in US stocks and fixed income bonds.
Currently Commodities, US Equity and Real Estate are doing well. Only US Equity is available to Caterpillar Inc Investment Trust participants.
To summarize, Caterpillar Inc Investment Trust presents some reasonable investment choices. Some of major asset classes such as REITs and emerging market stocks are missing from the plan. Adding funds to allow exposure to these major assets would allow more diversification and more opportunities to enhance return while reducing risk.
Symbols:CAT,SPY,VTI,EFA,VEU,AGG,BND,HYG,JNK,PHB,CIU,BIV,GWL,PFA,IVE,IWW,JKF,VTV,ELV,PWV,RPV,SCHV,IVV,IYY,IWV,VV,DLN,RSP,SCHX,IVW,IWZ,JKE,VUG,ELG,QQQQ,RPG,SCHG,IJH,IWR,JKG,VO,MDY,EMM,PJG,DON,EZM,MVV,IJR,IWM,JKJ,VB,DSC,PJM,DES,SAA,UWM,SCHA,PCY,
Exchange Tickers: (CAT),(SPY),(VTI),(EFA),(VEU),(AGG),(BND),(HYG),(JNK),(PHB),(MDY),(IWM),(IWV),(IWW)
Disclosure:
MyPlanIQ does not have any business relationship with the company or companies mentioned in this article. It does not set up their retirement plans. The performance data of portfolios mentioned above are obtained through historical simulation and are hypothetical.
- Glassman’s redemption: Find an investment safety net
03/26/2011
by John Wasik Reuters Prism Money
 It’s hard to climb out of an abyss in which you’ve predicted that the Dow Jones Industrial Average would hit 36,000 — only to see it crash twice and get pinned to the mat for years. James Glassman was one of the many bubbly U.S. stock cheerleaders who recommended stocks for the long term at the wrong time.
As most any stock investor will tell you, the last decade for U.S. stocks has been pretty dismal with the dot-com bust, 9/11 and the 2008 meltdown buffeting investors at every turn.
Yet Glassman has made an effort to redeem himself with his latest book Safety Net: The Strategy for De-Risking Your Investments in a Time of Turbulence.
Co-authored with Kevin Hassett of Dow 36,000 at the height of the tech-lemming era, I would have thought that Glassman would have laid low in a bunker with gold, U.S. Treasury Bonds and canned goods for while. It seems that Glassman has seen the light, though, and is preaching some sound advice for a more tumultuous time.
“Yes, stocks bounced up and down,” Glassman writes of his former views on stocks, “but your job as an investor was to hang on and collect your reward for perseverance at the end. I advocated the same strategy of heavy and diversified U.S. equity holdings that most sensible advisors espoused — but with an extra dollop of optimism. And I was wrong.”
So what happened to U.S. stocks for the long run? Not a good idea in the wake of the worst 10-year period of the stock market when accounting for inflation (through 2009), Glassman notes. Now it’s time for a “margin of safety.”
While this strategy would have been great advice more than a decade ago, Glassman’s new religion is asset protection (mine, too, although for me it’s an old faith). Ironically enough, Glassman had to reach back to legendary value investor Ben Graham (and mentor of Warren Buffett) to arrive at his new safety mantra.
Glassman’s safe harbor strategy is designed to “protect you against the Category 5 hurricanes of the financial kind.” Forget about living long enough to bounce back from stock market losses. “The older you get, the less long term is left for recovery.”
In practice, Glassman advises cutting back on U.S. stocks, investing in “aspiring” markets (Brazil, China and India) and investing in bonds. Even more cautious these days, Glassman also recommends something a little exotic for most mainstream investors: a genuine hedging strategy. Here’s the skinny on that:
- Buy derivatives to protect against stock losses. You can do this through put options on stock you own or hedge the entire market. These vehicles rise in value if the market drops. There are also inverse exchange-traded funds “bear market” exchange-traded funds that do the same thing, only less precisely.
- Protect against inflation. That means boring Treasury Inflation-Protected Securities. Staples in my portfolio, unlike conventional bonds, TIPS climb in value when the Consumer Price Index rises.
- Find a safe level of stocks, bonds, currencies and hedges for your age and lifestyle and re-balance every year. Sound advice, but nothing new.
The one odd shortcoming in Glassman’s book is that he “has no place for commodities.” With inflation coming back and global demand for everything from aluminum to zinc exploding, I find this statement troubling.
I would recommend having a small portion of your portfolio (less than 15 percent) in a commodities fund like the PowerShares DB Index Tracking Fund, which holds a basket of key commodities.
Is it time to absolve Glassman for his irrational exuberance more than a decade ago? After all, he was steering a lot of investors into a maelstrom. If your road to redemption includes a generous dose of principal protection in these volatile times, a lot can be forgiven, although nothing is forgotten.
Exchange Tickers:(TIP), (SPY), (DBC)
- Accenture 401K Retirement Plan: High Quality and Low Cost Funds with Proper Diversification
03/25/2011
Accenture plc (ACN) operates as a management consulting, technology services, and outsourcing company. As a consulting and service provider, Accenture offers human resources and benefit consulting to various corporations. It is of interests to look at Accenture 401K plan offered to Accenture's employees.
The 401K plan consists of 28 funds. These funds enable participants to gain exposure to 5 major assets: US Equity, Foreign Equity, Emerging Market Equity, REITs, Fixed Income.
Asset Class Ticker Name Retirement Income FFFAX Fidelity Freedom Income Target Date 2016-2020 FFFDX Fidelity Freedom 2020 Target Date 2016-2020 FFFDX Fidelity Freedom 2020 Target Date 2016-2020 FFFDX Fidelity Freedom 2020 Target Date 2016-2020 FFFDX Fidelity Freedom 2020 Target Date 2016-2020 FFFDX Fidelity Freedom 2020 Target Date 2016-2020 FFFDX Fidelity Freedom 2020 LARGE BLEND MVEIX Monteagle Select Value Fund Intermediate-Term Bond PTTRX PIMCO Total Return Instl Intermediate-Term Bond VBMFX Vanguard Total Bond Market Index Inflation-Protected Bond VIPSX Vanguard Inflation-Protected Secs LARGE BLEND VIIIX Vanguard Institutional Index Instl Pl LARGE BLEND LLPFX Longleaf Partners LARGE VALUE LSVEX LSV Value Equity MID-CAP VALUE VMVIX Vanguard Mid-Cap Value Index Inv SMALL BLEND NAESX Vanguard Small Cap Index REAL ESTATE VGSIX Vanguard REIT Index LARGE GROWTH FCNTX Fidelity Contrafund LARGE GROWTH FOCPX Fidelity OTC LARGE GROWTH HACAX Harbor Capital Appreciation Instl LARGE GROWTH MGRIX Marsico Growth SMALL VALUE ROFIX Royce Opportunity Instl WORLD STOCK RNPFX American Funds New Perspective R5 Foreign Large Growth FDIVX Fidelity Diversified International DIVERSIFIED EMERGING MKTS VEIEX Vanguard Emerging Markets Stock Foreign Large Blend VGTSX Vanguard Total Intl Stock Index
The list of minor asset classes covered:
Diversified Emerging Mkts: EEM, GMM, PXH, DEM, SCHE
Foreign Large Blend: EFA, VEU, GWL, PFA
Inflation-protected Bond: TIP
Intermediate-term Bond: AGG, CIU, BIV, BND
Large Blend: IVV, IYY, IWV, VTI, VV, SPY, DLN, RSP, SCHX
Large Growth: IVW, IWZ, JKE, VUG, ELG, QQQQ, RPG, SCHG
Large Value: IVE, IWW, JKF, VTV, ELV, PWV, RPV, SCHV
Mid-cap Value: IJJ, IWS, JKI, VOE, EMV, PWP, RFV, UVU
Real Estate: IYR, ICF, VNQ
Retirement Income:
Small Blend: IJR, IWM, JKJ, VB, DSC, PJM, DES, SAA, UWM, SCHA
Small Value: IJS, IWN, JKL, VBR, DSV, PWY, RZV, UVT
Target Date 2016-2020: TZG
World Stock: IOO, VTAsset Class Number of funds Balanced Fund 7 REITs 1 Fixed Income 3 Commodity 0 Sector Fund 0 Foreign Equity 3 Emerging Market Equity 1 US Equity 11 Other 2 Total 28 As of Mar 24, 2011, this plan investment choice is rated as above averagebased on MyPlanIQ Plan Rating methodology that was designed to measure how effective a plan's available investment funds are . It has the following detailed ratings:
Diversification -- Rated as great (87%)
Fund Quality -- Rated as below average (27%)
Portfolio Building -- Rated as great (86%)
Overall Rating: above average (69%)From the table above, one can see that the plan has several outstanding stock funds such as Longleaf Partners (LLPFX), Royce Opportunity (ROFIX), LSV Value Equity (LSVEX) and Fidelity Contra (FCNTX). It has also the solid fixed income fund PIMCO Total Return (PTTRX). In addition, it uses many Vanguard index funds that have low cost to complete asset class coverage. The fund choices cover five major asset classes, which are fairly adequate for diversification purpose.Let's analyze further how the plan can help its participants by using two asset allocation strategies: strategic and tactical asset allocation strategies (SAA and TAA for participants in Accenture 401K).
Strategic Asset Allocation is based on well known modern portfolio theory and its key features include: diversification, proper fund selection and periodically re-balancing.
Tactical Asset Allocation works on a diversified array of assets provided by funds in a plan and adjusts asset mixes based on market conditions such as asset price momentum utilized by TAA.
The chart and table below show the historical performance of moderate model portfolios employing strategic and tactical asset allocation strategies. For comparison purpose, we also include the moderate model portfolios of a typical 5 asset SIB (Simpler Is Better) plan . This SIB plan has the following candidate index funds and their ETFs equivalent:
US Equity: SPY or VTI
Foreign Equity: EFA or VEU
REITs: IYR or VNQ or ICF
Emerging Market Equity: EEM or VWO
Fixed Income: AGG or BND
Performance chart (as of Mar 24, 2011)Performance table (as of Mar 24, 2011)
Portfolio Name 1Yr AR 1Yr Sharpe 3Yr AR 3Yr Sharpe 5Yr AR 5Yr Sharpe Accenture 401K Tactical Asset Allocation Moderate 8% 43% 12% 93% 13% 84% Accenture 401K Strategic Asset Allocation Moderate 10% 80% 6% 30% 7% 33% Five Core Asset ETF Benchmark Tactical Asset Allocation Moderate 7% 42% 8% 60% 10% 63% Five Core Asset ETF Benchmark Strategic Asset Allocation Moderate 13% 76% 4% 16% 6% 19% Accenture's Strategic and Tactical model portfolios beat their counterparts of the Five Core Asset benchmarks respectively. This indicates a solid plan that can be used for many asset allocation styles.
To summarize, Accenture 401K participants can achieve the best investment returns by adopting asset allocation strategies that are tailored to their risk profiles. Moreover, they can take advantage of the good fund choices offered by the plan.
Symbols:ACN,SPY,VTI,EFA,VEU,EEM,VWO,IYR,VNQ,ICF,AGG,BND,CIU,BIV,GWL,PFA,IVE,IWW,JKF,VTV,ELV,PWV,RPV,SCHV,TZG,IVV,IYY,IWV,VV,DLN,RSP,SCHX,IOO,VT,IVW,IWZ,JKE,VUG,ELG,QQQQ,RPG,SCHG,IJJ,IWS,JKI,VOE,EMV,PWP,RFV,UVU,IJS,IWN,JKL,VBR,DSV,PWY,RZV,UVT,IJR,IWM,JKJ,VB,DSC,PJM,DES,SAA,UWM,SCHA,GMM,PXH,DEM,SCHE,TIP,PTTRX,LSVEX,LLPFX,ROFIX,
Exchange Tickers:(ACN), (SPY), (VTI), (EFA), (VEU), (EEM), (VWO), (IYR), (VNQ), (ICF), (AGG), (BND), (CIU), (BIV), (GWL), (PFA), (IVE), (IWW), (JKF), (VTV), (ELV), (PWV), (RPV), (SCHV), (TZG), (IVV), (IYY), (IWV), (VV), (DLN), (RSP), (SCHX), (IOO), (VT), (IVW), (IWZ), (JKE), (VUG), (ELG), (QQQQ), (RPG), (SCHG), (IJJ), (IWS), (JKI), (VOE), (EMV), (PWP), (RFV), (UVU), (IJS), (IWN), (JKL), (VBR), (DSV), (PWY), (RZV), (UVT), (IJR), (IWM), (JKJ), (VB), (DSC), (PJM), (DES), (SAA), (UWM), (SCHA), (GMM), (PXH), (DEM), (SCHE), (TIP)
Disclosure:
MyPlanIQ does not have any business relationship with the company or companies mentioned in this article. It does not set up their retirement plans. The performance data of portfolios mentioned above are obtained through historical simulation and are hypothetical. - Mellon Capital Veteran Managers Are Optimistic on U.S. Stocks
03/23/2011
Veteran managers in Mellon Capital have been bullish on U.S. stocks. In fact, based on the annual report on 9/30/2010 of Vanguard Asset Allocation fund, managed by Mellon Capital, it stated that "Our calculations suggest that the S&P 500 Index should deliver a return of around 9.5% per year over the next ten years. Meanwhile, high-grade corporate bonds currently yield about 4.8%. Given the current risk landscape, an expected risk premium of around 4.7 percentage points modestly favors equities relative to bonds.Accordingly, the Mellon Capital Tactical Asset Allocation Model recommends a 15-percentage-point overweighting in equity and underweighting in fixed income relative to the benchmark.".
Let's take a closer look at a fund managed by Mellon Capital, specifically, Vanguard Asset Allocation Fund (VAAPX) (VAARX). The portfolio managers are Charles J. Jacklin and Thomas F. Loeb. Both are veterans for the fund, having managed the fund for more than 10 years. The fund is an asset allocation fund that mainly invests in U.S. stocks and bonds.
The fund was an outstanding performer in the internet bubble period, smartly navigating through the crisis and made the right bets in the market stress and at the market bottom. As a result, it only lost 15% in 2002. However, the fund was not as lucky in the 2008 financial crisis: it was heavily exposed to U.S. stocks (especially in financial stocks) going into the crisis, losing 36% in 2008. Since then, it has recovered smartly, it gained 15.5% in 2010.
The following table illustrates the asset correlation percentages for Vanguard Asset Allocation Fund in the last four weeks:Date CASH U.S. Bonds U.S. Stocks 2011-02-25 -0 36.48 63.52 2011-03-04 0 29.16 70.84 2011-03-11 -0 27.02 72.98 2011-03-18 0 22.85 74.48 In the above table, the percentages for each asset are derived based on mathematical regression analysis, they do not necessarily reflect the actual allocation percentages. In technical terms, the percentages are more or less as beta coefficients that reflect how strongly the fund is correlated with that specific asset index. The U.S. bonds are represented by ETFs such as iShares Barclay Aggregate Bond Index (AGG) or Vanguard Total Bond Index (BND). The U.S. stocks are represented by ETFs such as SPDR S&P 500 (SPY) or Vanguard Total US stock market index (VTI).
It is very telling that on 3/4/2011, the S&P 500 (SPY) was at 1321 and by the time on 3/18/2011, it lost to 1279. However, in light of this loss, the fund actually increased its beta correlation with the U.S. stocks from 70.84 to 74.48, reflecting the managers' confidence in the U.S. stock market.This is a bullish sign.
The fund has done well year to date: gaining 4.7% to 3/22/2011. For more detailed smart money manager's asset allocation funds analysis, please refer to here.As more Americans are increasingly relying on retirement investing income to fund their future retirement or financial needs, asset allocation decision plays the most important role in managing one's portfolio to enhance returns and reduce risk. We believe investors can benefit from our timely and quality analysis on some of good asset allocaiton managers' asset outlook and their portfolio management skills.
- Jabil Enables Its Employees to Access to Reasonable Funds in Their 401K Plan
03/23/2011
- Disney Offers Solid Stock Funds in Its 401K plan, But Can Expand Its Plan More Broadly
03/23/2011
- Online Pioneer Amazon.com Can Expand Its 401K Plan for More Diversification
03/22/2011
- Fund Advice Gives Sound Advice
03/22/2011
- Employees in Sprint Nextel Dial up An Average 401K Retirement Plan
03/22/2011
- Commodities Withstood the Recent Market Selloff
03/21/2011
- Earthquakes and Wars Call for Diversification and Tactical Asset Allocation in Investing
03/20/2011
- Dividend Stock ETFs Somewhat Defensive But Not Enough to Withstand Market Stress
03/17/2011
- 'Safe' Assets' Trends Back to Positive: Risk Aversion Began?
03/14/2011
- Commodity Investing: Long Short (S&P Commodity Trend Indicators) vs. Long Only
03/13/2011
- Starbucks Should Expand Its 401K Retirement Plan, Just As What It Did in Their Business
03/11/2011
- NetApp's 401K: More Diversification and Better Quality Can Help
03/10/2011
- Riding High with Global Economy, International REITs Offer Currency and Inflation Hedge
03/10/2011
- Major Assets: Risk Assets Strong While Safe Assets Have Negative Trends
03/07/2011
- Commodity ETFs: Does Everyone Need Energy Investment?
03/07/2011
- Aflac Incorporated 401(k) Savings and Profit Sharing Plan Report On 12/03/2010
12/03/2010
This report reviews Aflac Incorporated 401(k) Savings and Profit Sharing Plan plan. We will discuss the investment choices and present the plan rating by MyPlanIQ. Current economic and market conditions are discussed in the context of the investment portfolios in the plan. We will then show how participants in Aflac Incorporated 401(k) Savings and Profit Sharing Plan can achieve reasonable investment results using asset allocation strategies.
Plan Review and Rating
AFLAC Inc (Ticker:AFL) has the "Aflac Incorporated 401(k) Savings and Profit Sharing Plan".
Aflac Incorporated 401(k) Savings and Profit Sharing Plan's 401K plan consists of 11 funds. These funds enable participants to gain exposure to 3 major assets: US Equity, Foreign Equity, Fixed Income. The list of minor asset classes covered:
Foreign Large Blend: EFA, VEU, GWL, PFA
Intermediate-term Bond: AGG, CIU, BIV, BND
Large Blend: IVV, IYY, IWV, VTI, VV, SPY, DLN, RSP, SCHX
Large Growth: IVW, IWZ, JKE, VUG, ELG, QQQQ, RPG, SCHG
Large Value: IVE, IWW, JKF, VTV, ELV, PWV, RPV, SCHV
Mid-cap Growth: IJK, IWP, VOT, EMG, PWJ, RFG, UKW
Moderate Allocation: AOM
Small Growth: IJT, IWO, JKK, VBK, DSG, PWT, RZG, UKK
As of Dec 2, 2010, this plan investment choice is rated as based on MyPlanIQ Plan Rating methodology that measures the effectiveness of a plan's available investment funds. It has the following detailed ratings:
Diversification -- Rated as (35%)
Fund Quality -- Rated as (33%)
Portfolio Building -- Rated as (36%)
Overall Rating: (35%)Current Economic and Market Conditions
We have experienced an uncertain 2010: plenty of worries on whether the US economy will climb out of the great recession and recover.
- The Federal Reserve embarked on Quantitative Easing II (QE2) to stimulate the economy.
- The housing market is still at its low but largely stabilized.
- The unemployment rate is stuck at 9%.
Americans continue to face an uncertain future, given (among others) the high unemployment rate, large federal and local government debts and global trade imbalance. With such an economic backdrop, the stock and debt markets are going to be volatile. Despite this, markets have been resilient and appear positioned to rebound.
In this market it is even more critical to properly diversify and respond market changes. MyPlanIQ offers two asset allocation strategies: strategic and tactical asset allocation strategies ( SAA and TAA for participants in Aflac Incorporated 401(k) Savings and Profit Sharing Plan).
Strategic Asset Allocation is based on well known modern portfolio theory and its key features include: diversification, proper fund selection and periodically re-balancing.
Tactical Asset Allocation works on a diversified array of assets provided by funds in a plan and adjusts asset mixes based on market conditions such as asset price momentum utilized by TAA.
Portfolio Discussions
The chart and table below show the historical performance of moderate model portfolios employing strategic and tactical asset allocation strategies. For comparison purpose, we also include the moderate model portfolios of a typical 3 asset SIB (Simpler Is Better) plan . This SIB plan has the following candidate index funds and their ETFs equivalent:
US Equity: (SPY or VTI)
Foreign Equity: (EFA or VEU)
Fixed Income: (AGG or BND)
Performance chart (as of Dec 2, 2010)Performance table (as of Dec 2, 2010)
Portfolio Name 1Yr AR 1Yr Sharpe 3Yr AR 3Yr Sharpe 5Yr AR 5Yr Sharpe Aflac Incorporated 401(k) Savings and Profit Sharing Plan Tactical Asset Allocation Moderate 4% 34% 5% 64% 8% 81% Aflac Incorporated 401(k) Savings and Profit Sharing Plan Strategic Asset Allocation Moderate 10% 100% 2% 8% 6% 31% Three Core Asset ETF Index Funds Tactical Asset Allocation Moderate -4% -35% 1% 9% 4% 27% Three Core Asset ETF Index Funds Strategic Asset Allocation Moderate 9% 60% -0% -3% 4% 13% Currently, asset classes in US Equity (SPY,VTI), Foreign Equity (EFA,VEU) and Fixed Income (AGG,BND) are doing relatively well. These asset classes are available to Aflac Incorporated 401(k) Savings and Profit Sharing Plan participants.
To summarize, Aflac Incorporated 401(k) Savings and Profit Sharing Plan plan participants can achieve reasonable investment returns by adopting asset allocation strategies that are tailored to their risk profiles.
Symbols: AFL , SPY , VTI , EFA , VEU , AGG , BND , AOM , CIU , BIV , GWL , PFA , IVE , IWW , JKF , VTV , ELV , PWV , RPV , SCHV , IVV , IYY , IWV , VV , DLN , RSP , SCHX , IVW , IWZ , JKE , VUG , ELG , QQQQ , RPG , SCHG , IJK , IWP , VOT , EMG , PWJ , RFG , UKW , IJT , IWO , JKK , VBK , DSG , PWT , RZG , UKK
- ALLERGAN, INC. SAVINGS AND INVESTMENT PLAN Report On 12/03/2010
12/03/2010
- Apartment Investment and Management Company 401(k) Retirement Plan Report On 12/03/2010
12/03/2010
- ASSURANT 401(k) PLAN A&PLAN B Report On 12/03/2010
12/03/2010
- Abercrombie Fitch Co. Savings and Retirement Plan Report On 12/03/2010
12/03/2010
- Apache Design Solutions 401K Report On 12/03/2010
12/03/2010
- Allegheny Ludlum Corporation Personal Retirement and 401(k) Savings Account Plan Report On 12/03/2010
12/03/2010
- AMERICAN EXPRESS RETIREMENT SAVINGS PLAN Report On 12/03/2010
12/03/2010
- ALLEGHENY ENERGY EMPLOYEE STOCK OWNERSHIP AND SAVINGS PLAN Report On 12/03/2010
12/03/2010
- BAKER 401(k) PLAN Report On 12/03/2010
12/03/2010
- BRISTOL-MYERS SQUIBB COMPANY SAVINGS AND INVESTMENT PROGRAM Report On 12/03/2010
12/03/2010
- PEABODY WESTERN-UMWA 401(K) PLAN Report On 12/03/2010
12/03/2010
- Peabody Investments Corp.Employee Retirement Account Report On 12/03/2010
12/03/2010
- Capital Accumulation Plan of The Chubb Corporation Report On 12/03/2010
12/03/2010
- CEPHALON, INC. 401(k) PROFIT SHARING PLAN Report On 12/03/2010
12/03/2010
- CABOT OIL & GAS CORPORATION SAVINGS INVESTMENT PLAN Report On 12/03/2010
12/03/2010
- CVS CAREMARK CORPORATION AND AFFILIATED COMPANIES Report On 12/03/2010
12/03/2010
- Danaher Corporation Subsidiaries Retirement and Savings Plan Report On 12/03/2010
12/03/2010
- Danaher Corporation Subsidiaries Savings Plan Report On 12/03/2010
12/03/2010
- EQT CORPORATION SAVINGS AND PROTECTION PLAN Report On 12/03/2010
12/03/2010
- Vanguard Variable Annuity Report On 12/06/2010
12/06/2010
- The Franklin Templeton NJBEST New Jersey 529 College Savings Plan Report On 12/07/2010
12/07/2010
- TD Ameritrade Commission Free ETFs Report On 12/07/2010
12/07/2010
- Qualcomm 401(k) Plan Report On 12/07/2010
12/07/2010
- Vanguard-VA-Clone Report On 12/07/2010
12/07/2010
- Tiffany Co. Employee Profit Sharing and Retirement Savings Plan Report On 03/21/2011
03/21/2011
- Sprint Nextel 401K Plan Report On 03/21/2011
03/21/2011
- Hewlett Packard 401K Report On 06/13/2011
06/13/2011
- Hewlett Packard 401K Report On 06232011
06/23/2011