How Good Is The Six Asset ETF Benchmark Really?
03/09/2011 0 comments
The first baby boomers preparing for retirement with the still steaming financial meltdown at the forefront of our minds. We have been building a simple set of funds that have the potential to deliver good returns at a low risk.
We have seen increasing diversification can make a significant impact on simulated historical returns. Sadly, only a few retirement plans (~4%) have six asset classes but we noted that with most of us having jobs in more than one company, it may be possible to create a holistic portfolio with the combination of IRA and 401K or retirement vehicle you use.
In the last article we added the PIMCO managed bond fund to our benchmark. We noted that there are currently no ETFs that can compete in this critical area and we noted that this gave a 1% bump to the historical simulations. In a future article, we will refine each of the asset classes to see what improvement they give to build a comprehensive plan from which one can build an effective portfolio.
In this article, we are going to take a slight detour and answer two questions:
1. How well does the benchmark perform against the other plans we support
2. Is it better to have good funds with fewer asset classes than poor funds with more asset classes
We are going to answer this by showing the results of the approximately 800 plans we summarized in our initial study. Because of the number of plans, we don't provide the ability to look into individual plans but this can be provided if somebody has a specific question.
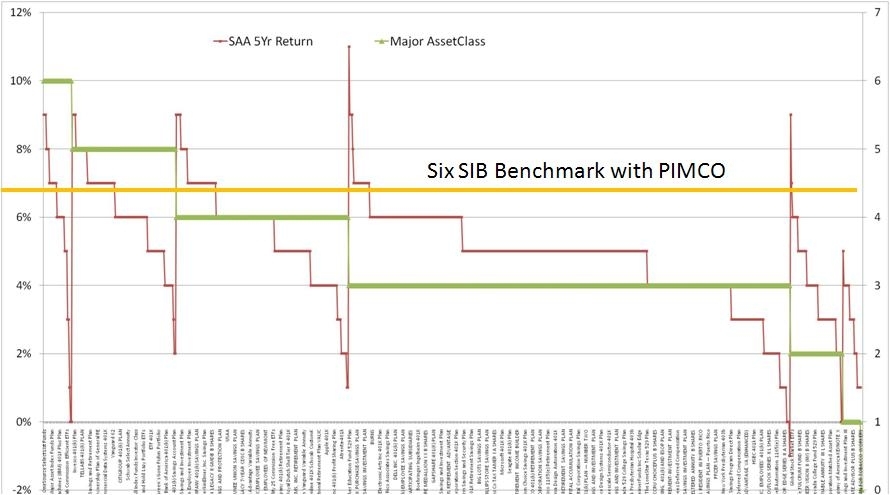
The red line are the five year returns for buy and hold strategies. The green line is the number of asset classes in the plan (axis to the right) and the gold bar is how the benchmark performed.
We note that:
- The benchmark performs in the middle region of the six asset class plans and above average in all the other plans
- The top performing plan has an 11% annual rate of return over five years but that is only one out of 800 and the next best is 9%
- There is a general trend down as the number of asset classes reduce in number but there are definite spikes
- There are a few plans in the lower number of asset classes that perform as well as any
For those who only want buy and hold strategies, there is merit in looking into the 11% and 9% plans in all asset class categories to understand what makes them tick and what the trade off is between more or less asset classes.
If we now look at the same plans with a tactical asset allocation strategy applied:
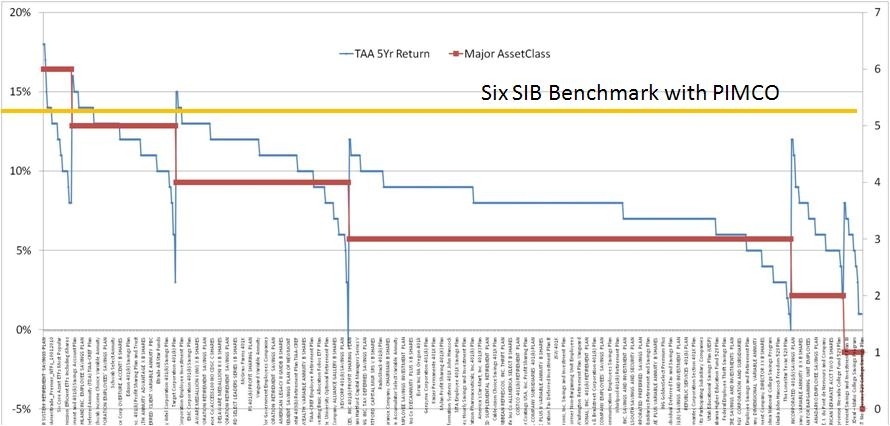
The blue line is the five year returns for tactical asset allocation strategies. The red line is the number of asset classes in the plan (axis to the right) and the gold bar is how the benchmark performed.
We note that:
- The behavior is more regulated -- there are no big spikes
- We see that some plans with a lower number of asset classes outperform the plans in a higher asset class bracket
- In general, the plans with a higher number of asset classes perform better
- The benchmark performs in the middle of the six asset class and above most of the other classes
It may be instructive to look at some of the peak performers in the lower classes but that is for another article.
The six asset benchmark with its seven funds (NYSEArca: VTI ), (NYSEArca: VEU), (NYSEArca: BND), (NYSEArca: VNQ), (NYSEArca: VWO), (NYSEArca: DBC), ), (MUTF: PTTDX) which is a substitute for (MUTF:PTTRX performs reasonably compared to any of the plans we have reviewed. If you want to stop there, you have a simple, manageable set of funds that should compete well with most plans.
Our contention is that while there are a few plans with fewer asset classes that perform very well, the best thing to do is to maximize diversification and work from there.
We will go on and see how we can improve performance further by looking at adding funds within an asset class.
If there are readers that would like to look into some of the plans that stand out from this article, please feel free to contact us.
Disclosure:
MyPlanIQ does not have any business relationship with the company or companies mentioned in this article. It does not set up their retirement plans. The performance data of portfolios mentioned above are obtained through historical simulation and are hypothetical.
Symbols: ,(NYSEArca,VTI,),(NYSEArca,VEU),(NYSEArca,BND),(NYSEArca,VNQ),(NYSEArca,VWO),(NYSEArca, ,DBC),(MUTF,PTTRX),(MUTF,PTTDX),
comments
0
![]()
Or Start FREE 30-day trial now >>
