'Safe' Assets' Trends Back to Positive: Risk Aversion Began?
03/14/2011 0 comments
Risk assets' correction in last week was across the board: virtually all risk assets, other than US REITs (VNQ), turned up negative. Among them, both international stocks (EFA) and commodities (DBC) had the largest drops: both lost 3.09%. On the other hand, most 'safe' assets had a positive week. For more detailed performance for last week, please refer to here.
From the following table, one can see that other than municipal bonds (MUB), all of 'safe' fixed income assets now have positive trend scores, meaning their return behaviors are better than cash or short term treasury bill (SHV).
| Assets Class | Symbols | 03/11 Trend Score | 03/04 Trend Score | Direction |
|---|---|---|---|---|
| Commodities | DBC | 12.94% | 16.8% | v |
| Gold | GLD | 9.46% | 9.66% | v |
| US Stocks | VTI | 8.03% | 10.61% | v |
| US Equity REITs | VNQ | 8.03% | 8.47% | v |
| International REITs | RWX | 6.89% | 9.33% | v |
| Emerging Market Stks | VWO | 4.64% | 7.17% | v |
| US High Yield Bonds | JNK | 4.13% | 4.99% | v |
| International Treasury Bonds | BWX | 4.04% | 3.49% | ^ |
| International Developed Stks | EFA | 3.28% | 7.15% | v |
| US Credit Bonds | CFT | 1.71% | 1.09% | ^ |
| Emerging Mkt Bonds | PCY | 1.18% | 0.29% | ^ |
| Intermediate Treasuries | IEF | 1.16% | -0.27% | ^ |
| Frontier Market Stks | FRN | 1.01% | 2.22% | v |
| Total US Bonds | BND | 0.97% | 0.05% | ^ |
| Mortgage Back Bonds | MBB | 0.12% | -0.55% | ^ |
| Treasury Bills | SHV | 0.05% | 0.01% | ^ |
| Municipal Bonds | MUB | -1.22% | -1.24% | ^ |
The trend score is defined as the average of 1,4,13,26 and 52 week total returns (including dividend reinvested).
It is especially telling that the trend score of intermediate term treasury bonds (IEF) are now positive, ahead of frontier market stocks (FRN). Is this the beginning of a turn?
Fundamentally, stocks across the globe are not cheap. Based on Valueline, Capital IQ and Bloomberg data collected by Prof. Damodaran at NYU, as of January 2011, the world market valuation is as follows:
| Aggregate Market Cap/Aggregate Net Income | |
| US | 27 |
| Europe | 20 |
| Emerging Market | 21.9 |
| Global | 23.1 |
By no means, the equity markets are cheap. In fact, Shiller's CAPE 10 for US stocks is currently at 24.4, compared with its long term average 16.4 (see more detailed info here). This is about 49% over valued!
Coupled with the recent relentless ascent in all risk asset prices, the markets are very prone to sharp gyration.
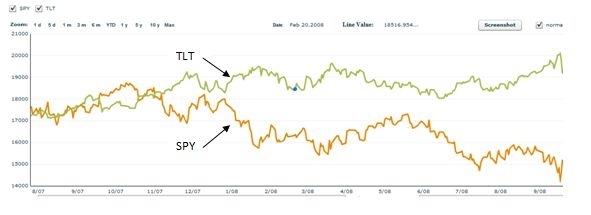
Fortunately, major stock market downturns were usually preceded by relative strong movements of other assets, especially 'safe' assets. For example, at the end of 2007, fixed income investors started to sense the danger in general economies, long term treasury bonds (TLT) started to show its strength in 8/2007. In fact, by the end of 2007, TLT has shown enough strength to be ahead of SPY. The following chart shows the total returns of both SPY and TLT between 2007 to 2008.
Nobody can predict the future and we don't know what will lie ahead this time. However, as long as one maintains a risk level that is suitable to his/her situations and adheres to a systematic way to properly allocate assets, one can withstand possible market shocks. Moreover, adopting a more active monitoring on major asset movements can be helpful to make tactical decision in risk asset exposures. For example, a tactical asset allocation strategy that uses major asset trends was effective in the last two major stock bear markets, based on historical simulation.
Though current situation does not warrant a dramatic change of asset allocations, investors with over allocated risk asset exposure should start to lighten up and get back to their normal risk level. It is a prudent way to avoid big loss in one's portfolios.
Symbols: EEM,VNQ,FRN,VWO,IYR,ICF,GLD,RWX,VTI,SPY,IWM,PCY,EMB,JNK,HYG,PHB,EFA,VEU,IEF,TLT,GSG,DBC,DBA,CFT,BWX,MBB,BND,MUB,SHV,AGG ,Symbols,(exchange), (NYSE,EEM),(NYSE,VNQ),(NYSE,FRN),(NYSE,VWO),(NYSE,IYR),(NYSE,ICF),(NYSE,GLD),(NYSE,RWX),(NYSE,VTI),(NYSE,SPY),(NYSE,IWM),(NYSE,PCY),(NYSE,EMB),(NYSE,JNK),(NYSE,HYG),(NYSE,PHB),(NYSE,EFA),(NYSE,VEU),(NYSE,IEF),(NYSE,TLT),(NYSE,GSG),(NYSE,DBC),(NYSE,DBA),(NYSE,CFT),(NYSE,BWX),(NYSE,MBB),(NYSE,BND),(NYSE,MUB),(NYSE,SHV),(NYSE,AGG),
Disclosure: MyPlanIQ does not have any business relationship with the company or companies mentioned in this article. It does not set up their retirement plans. The performance data of portfolios mentioned above are obtained through historical simulation and are hypothetical.
comments
0
![]()
Or Start FREE 30-day trial now >>
