ETF Based Major Asset Class Trend Indicators For The Week of November 15
11/15/2010 0 comments
However, a week of positive data could give investors hard evidence to justify a rally that lifted the S&P 500 ~ 17% from the August 31 close to the 2010 closing high hit November 5.
There are some concerning signson the horizon and last week the major US indices all lost over 2%. This is reflected in the major asset class trend indicators which are all down even if the relative rankings are largely unchanged.
|
Description |
Symbol |
15-Nov Trend Score |
Direction |
8-Nov Trend Score |
|
Frontier Market Stks |
FRN |
13% |
v |
20% |
|
US Equity REITs |
VNQ |
9% |
v |
18% |
|
Emerging Market Stks |
VWO |
9% |
v |
16% |
|
Gold |
GLD |
9% |
v |
13% |
|
International REITs |
RWX |
8% |
v |
15% |
|
US Stocks |
VTI |
7% |
v |
10% |
|
International Developed Stks |
EFA |
6% |
v |
9% |
|
US High Yield Bonds |
JNK |
5% |
v |
8% |
|
Commodities |
GSG |
5% |
v |
7% |
|
Emerging Mkt Bonds |
PCY |
5% |
v |
9% |
|
Intermediate Treasuries |
IEF |
3% |
v |
5% |
|
International Treasury Bonds |
BWX |
3% |
v |
6% |
|
US Credit Bonds |
CFT |
2% |
v |
4% |
|
Mortgage Back Bonds |
MBB |
1% |
v |
2% |
|
Total US Bonds |
BND |
1% |
v |
2% |
|
Treasury Bills |
SHV |
0% |
v |
0% |
|
Municipal Bonds |
MUB |
-1% |
v |
2% |
Top Five Indicators
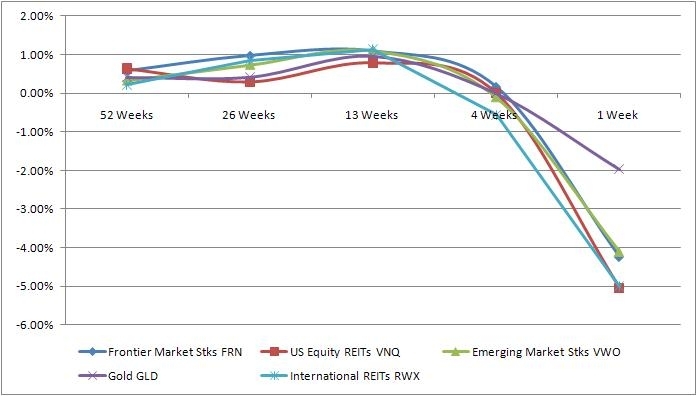
Emerging markets are going to react to the US market fluctuations and real estate is still edgy as it was a major cause of the current crisis. Gold is also down but much more heavily damped as it will continue to have strength based on inherent value and as currencies are under pressure.
Bottom Five Indicators
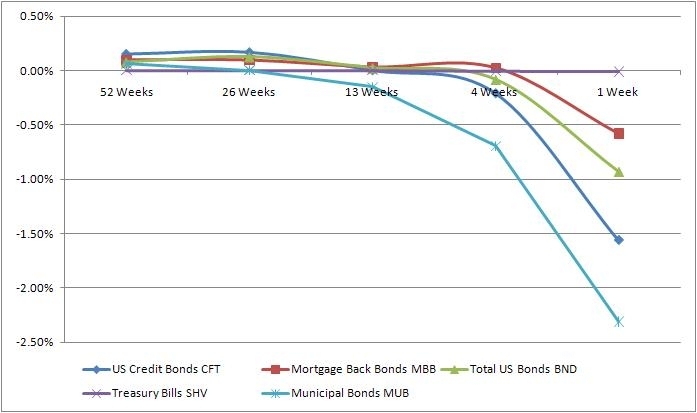
The bonds see some depression but are less volatile than the top asset classes.
In conclusion, the excitement from QE2 is over and we will see whether this down trend continues and we see a reversal towards more fixed income asset classes being desirable.
labels:investment,
Symbols:EEM,VNQ,FRN,VWO,IYR,ICF,GLD,RWX,VTI,SPY,IWM,PCY,EMB,JNK,HYG,PHB,EFA,VEU,IEF,TLT,GSG,DBC,DBA,CFT,BWX,MBB,BND,MUB,SHV,AGG,
comments 0
Or Start FREE 30-day trial now >>
