-

The Melt-Up and What It Means for Your 401(k)
- Latest in Retirement Savings & Personal Finance
- The Melt-Up and What It Means for Your 401(k)
- RMD Traps and Roth Strategies: Use Our Calculators to See Your Real Situation
- Market Overview
-
Super Businesses, Super Stocks
- Latest in Retirement Savings & Personal Finance
- Super Businesses, Super Stocks
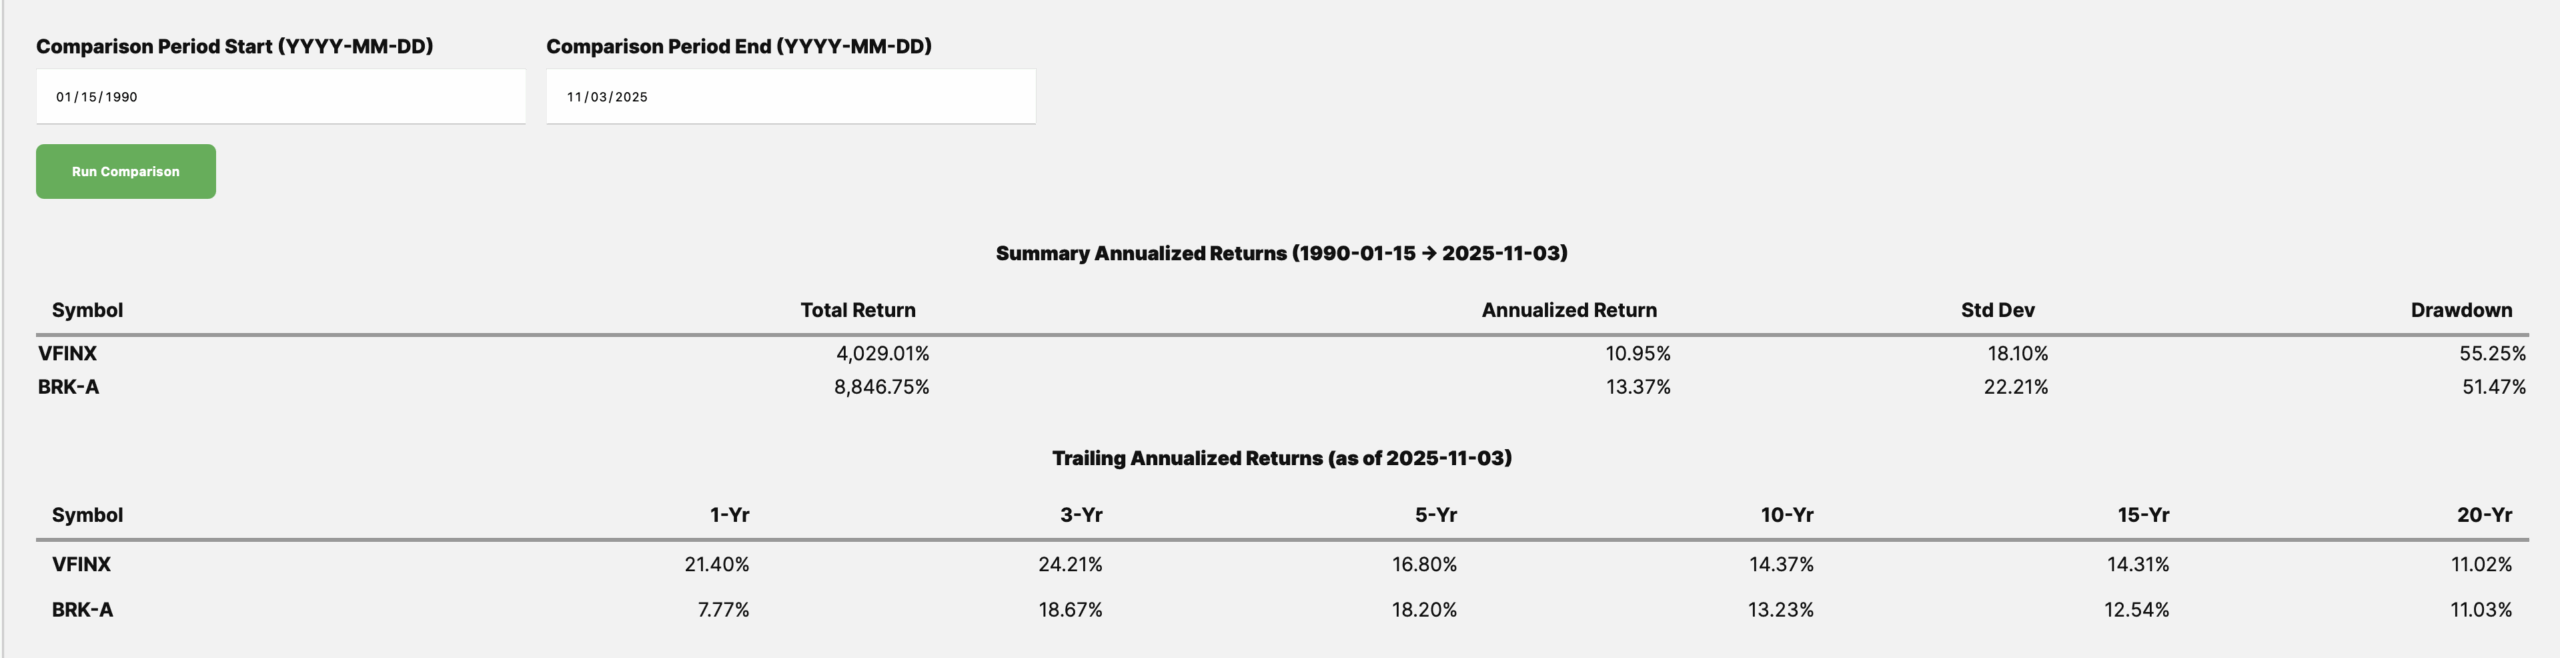
- Tools & Tips: Return Comparison Calculator
- Market Overview
-
2024 Millionaire Retirement Plans
- Latest in Retirement Savings & Personal Finance
- 2024 Millionaire Retirement Plans
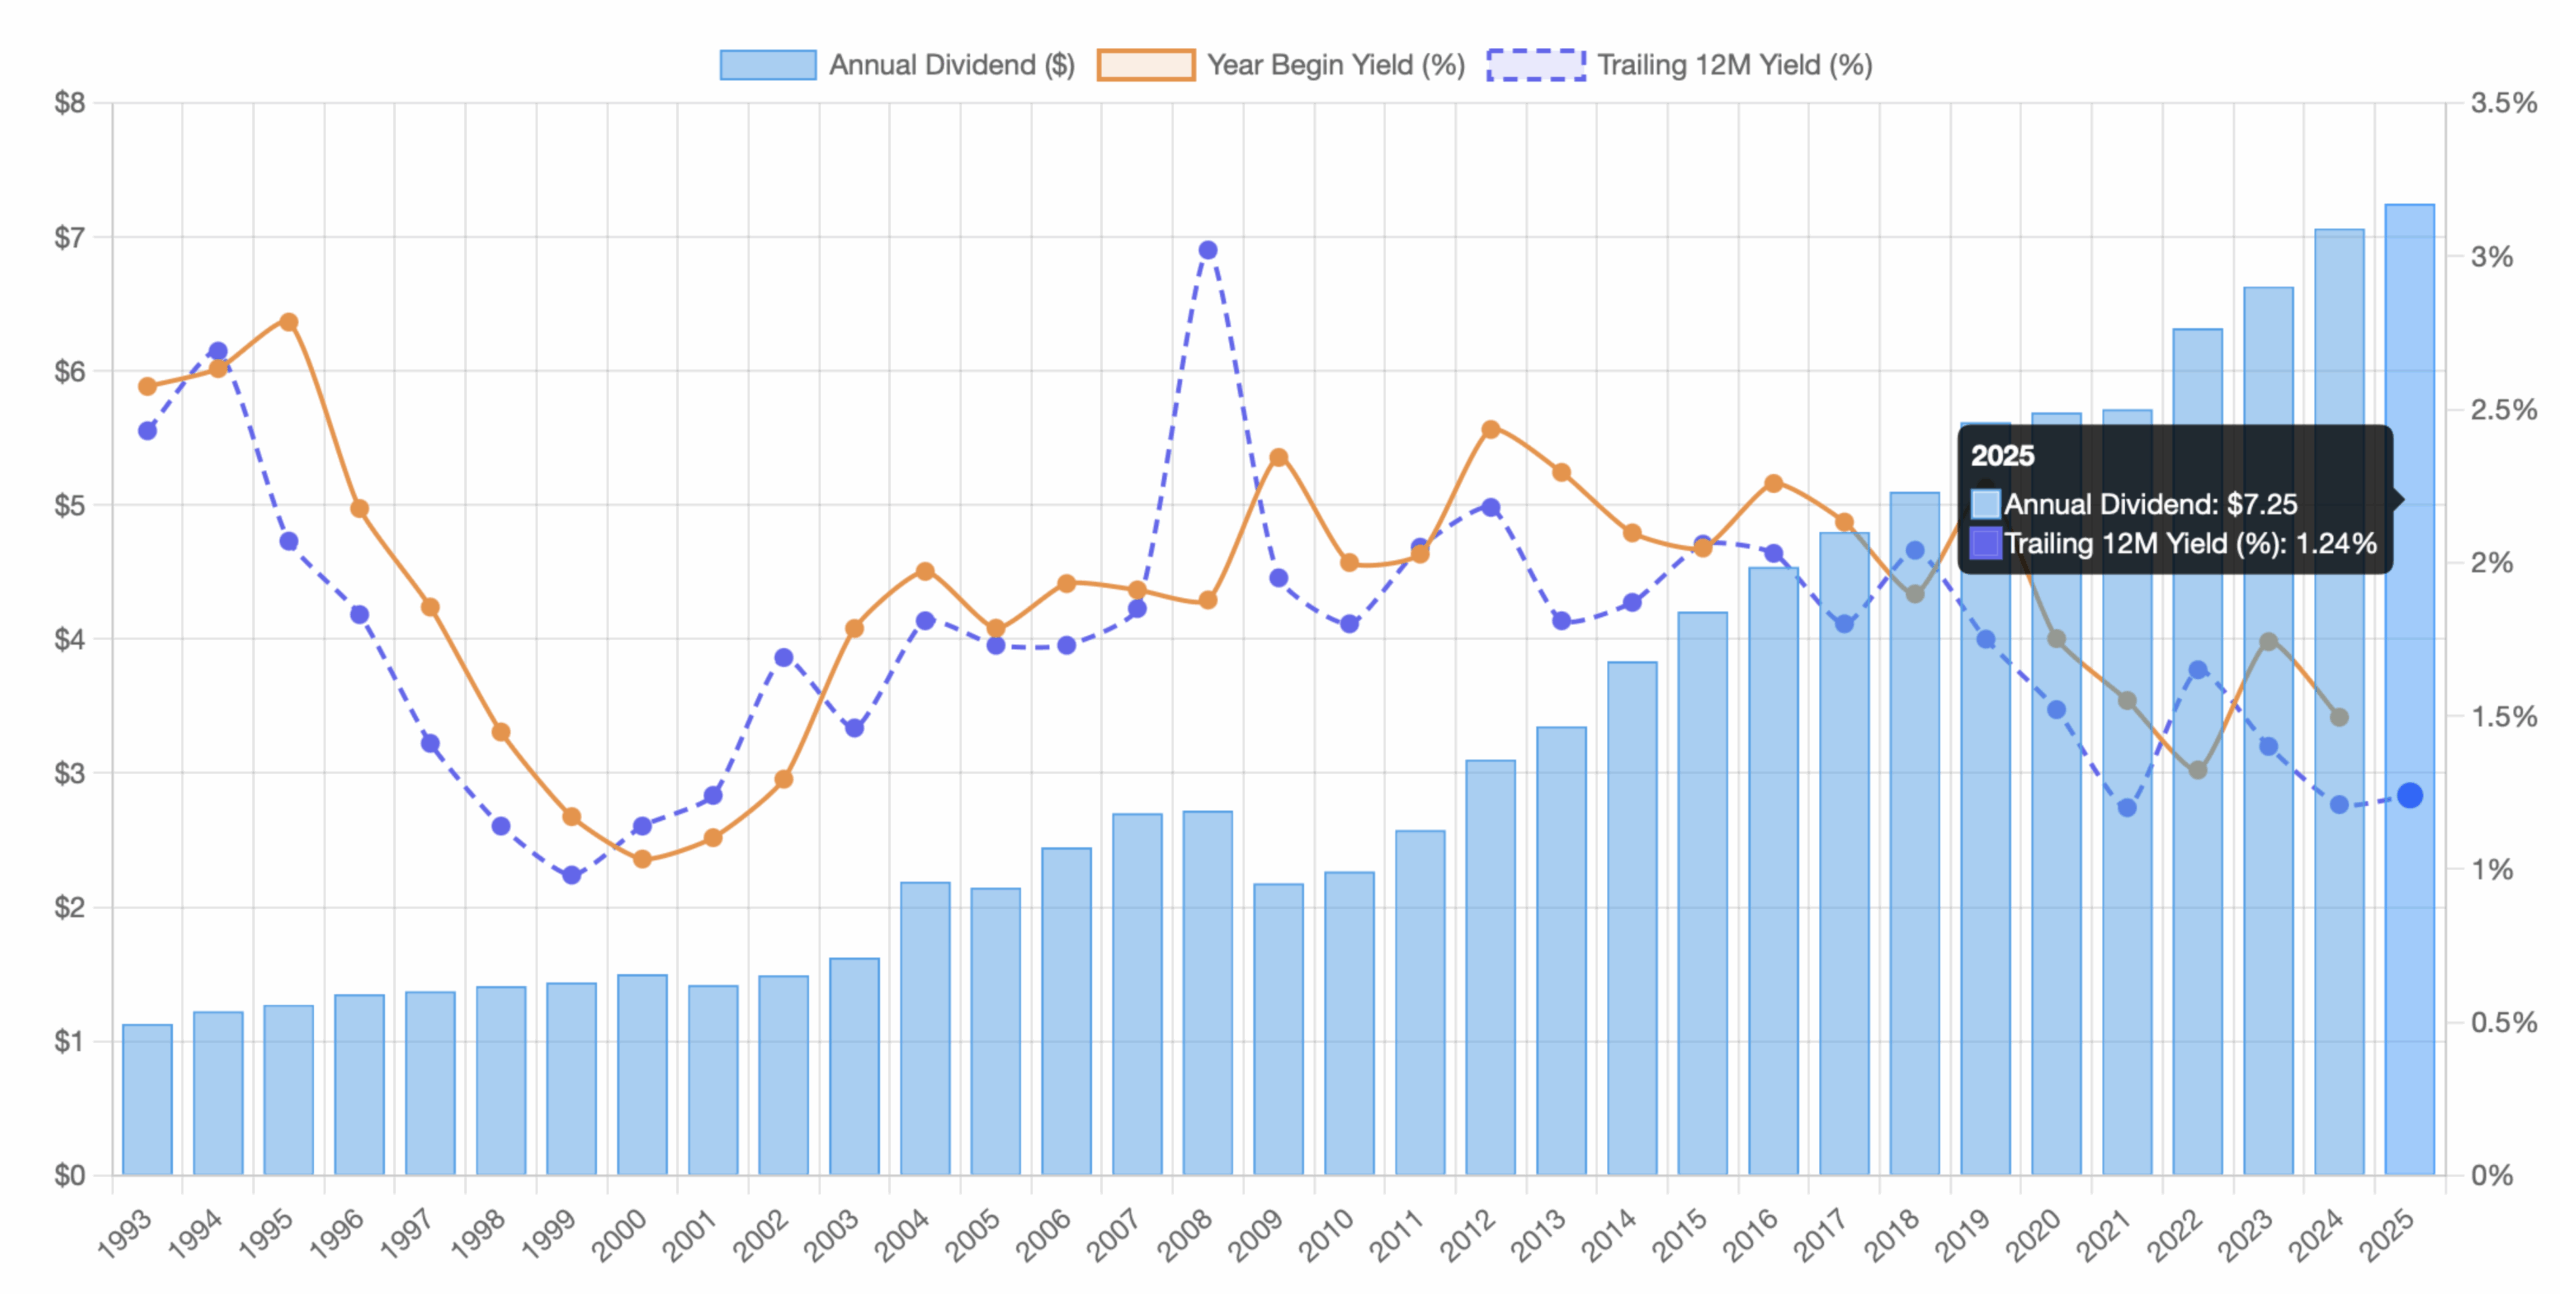
- Tools & Tips: Historical Stock Dividend Yield Chart
- Market Overview
-

The Quiet Millionaires of 2024: What Sets These Retirement Plans Apart
Every year, when new 401(k) data is released, it quietly reveals how uneven wealth building can be. In 2024, that picture is especially clear. The retirement plans with the highest average balances mostly belong to two types of organizations. On one side are high-income professionals such as physicians, lawyers, and boutique asset managers. These groups tend to have both strong personal contributions and large employer matches, often tied to firm profits. On the other side, a few large corporations, such as Texas Instruments and General Re, show that slow and steady saving across decades can also create significant wealth. MyPlanIQ recently did a study on all year 2024 retirement plans. We identified the top retirement plans that have the highest average participant account value. We limited our study in plans that have at least 100 participants. Below is a summary of the top 37 retirement plans by average account value. The numbers speak for themselves. Rank Retirement Plan Sponsor Average Account Value 1 Lone Pine Capital LLC 401(k) Profit Sharing Plan Lone Pine Capital LLC $1,612,021 2 Anesthesia Service Medical Group, Inc. 401(k) Profit Sharing Plan Trust Anesthesia Service Medical Group, Inc. $1,240,779 3 Medical Center Emergency Services Retirement Savings Thrift Plan Medical Center Emergency Services $1,217,978 4 Crescent River Port Pilots’ Association 401(k) Retirement Plan Crescent River Port Pilots’ Association $1,172,843 5 Irell & Manella Profit Sharing Plan Irell & Manella LLP $1,003,150 6 Anesthesia Consultants of Indianapolis, LLC 401(k) Profit Sharing Plan Anesthesia Consultants of Indianapolis, LLC $975,046 7 Fond du Lac Regional Clinic, S.C. 401(k) Profit Sharing Plan Fond du Lac Regional Clinic, S.C. $967,649 8 Wasatch Advisors, LP Deferred Profit Sharing Plan and Trust Wasatch Advisors, LP $924,154 9 Dodge & Cox Profit Sharing Plan Dodge & Cox $912,271 10 National Exchange Carrier Association Retirement Savings Plan National Exchange Carrier Association, Inc. $893,253 11 TI 401(k) Savings Plan Texas Instruments Incorporated $882,313 12 Employee Savings and Stock Ownership Plan of General Re Corp and its Domestic Subsidiaries General Re Corporation $862,746 13 Kleinberg, Kaplan, Wolff & Cohen, P.C. 401(k) Profit Sharing Plan Kleinberg, Kaplan, Wolff & Cohen, P.C. $860,649 14 Zeta Associates Incorporated Savings Plan Zeta Associates $829,709 15 Anesthesia Consultants of Indianapolis, LLC 401(k) Profit Sharing Plan Anesthesia Consultants of Indianapolis, LLC $804,322 16 Jennison Associates Savings Plan Jennison Associates LLC $797,881 17 Nutter, McClennen & Fish, LLP Lawyers Retirement Plan Nutter, McClennen & Fish, LLP $792,777 18 Carter Ledyard & Milburn LLP 401(k) Retirement Plan Carter Ledyard & Milburn LLP $778,761 19 Medical Anesthesia Group, P.A. Profit Sharing Plan Medical Anesthesia Group, P.A. $754,092 20 Bayerische Landesbank NY Employees Retirement Plan Bayerische Landesbank $747,774 21 Barrow, Hanley Profit Sharing & 401(k) Plan Barrow, Hanley, Mewhinney and Strauss, LLC $736,341 22 Callan LLC Retirement Savings Plan Callan LLC $717,465 23 Sills Cummis & Gross P.C. Defined Contribution Plan Sills Cummis & Gross P.C. $716,205 24 Maverick Capital, Ltd. 401(k) Plan Maverick Capital, Ltd. $676,958 25 Progressive Physician Associates, Inc. Retirement Savings Plan Progressive Physician Associates, Inc. $669,937 26 Jeffer Mangels Butler & Mitchell LLP Profit Sharing and 401(k) Plan Jeffer Mangels Butler & Mitchell LLP $663,531 27 QRM 401(k) Retirement Savings Plan Quantitative Risk Management, Inc. $662,045 28 Neuberger Berman Group 401(k) Plan Neuberger Berman Group LLC $661,047 29 MBIA Inc. Employees Pension Plan MBIA Inc. $658,502 30 Maher Terminals LLC Profit Sharing and 401(k) Plan Maher Terminals LLC $657,996 31 Willcox & Savage, P.C. Profit-Sharing Retirement Plan Willcox & Savage, P.C. $647,756 32 Morris, Nichols, Arsht & Tunnell LLP 401(k) Profit Sharing Plan Morris, Nichols, Arsht & Tunnell LLP $647,520 33 Eastman & Smith Ltd. Profit Sharing and Savings Plan and Trust Eastman & Smith Ltd. $643,627 34 APG Asset Management 401(k) Plan APG Asset Management $642,912 35 American Radiology Associates, P.A. Retirement Plan American Radiology Associates, P.A. $638,273 36 First Manhattan 401(k) Plan FMC Group Holdings LP $636,751 37 Downs Rachlin Martin Retirement Plan Downs Rachlin Martin PLLC $632,968 Across these 37 plans, the average account value stands close to $820,000, with a median around $754,000. That is a striking contrast to the national average, which remains under $120,000 for most retirement savers. The first major reason for this difference is compensation. These are high-income groups with the ability to contribute the annual maximum without hardship. Employers in these professional partnerships also tend to make hefty profit-sharing contributions. A doctor earning $400,000 a year or a law partner receiving a share of firm profits can easily reach contribution limits and still receive matching or profit-based additions on top. Over time, that combination of high base income and rich employer match drives account values far above what traditional salaried workers can achieve. The second reason is less about pay and more about time. Companies such as Texas Instruments and General Re demonstrate the quiet power of long-term consistency. Their plans have thousands of participants and more modest individual incomes, yet decades of continuous contributions and steady investment returns have compounded into substantial balances. The difference is discipline rather than income level. These two factors together explain why some retirement plans have reached the million-dollar mark while others lag far behind. High income and employer generosity create the initial lift. Long time horizons finish the job. In a period when many Americans are struggling to save even a fraction of what they will need, these plans are reminders that structure and time still matter more than luck. The quiet millionaires of 2024 did not chase returns or time markets. They simply contributed, matched, and waited long enough for patience to pay.
-
Last Quarter Checklist for 2025
- Latest in Retirement Savings & Personal Finance: All the Glittering Gold, Highest Household Credit Card Debt, More PE Funds Than McDonald’s
- Last Quarter Checklist for 2025
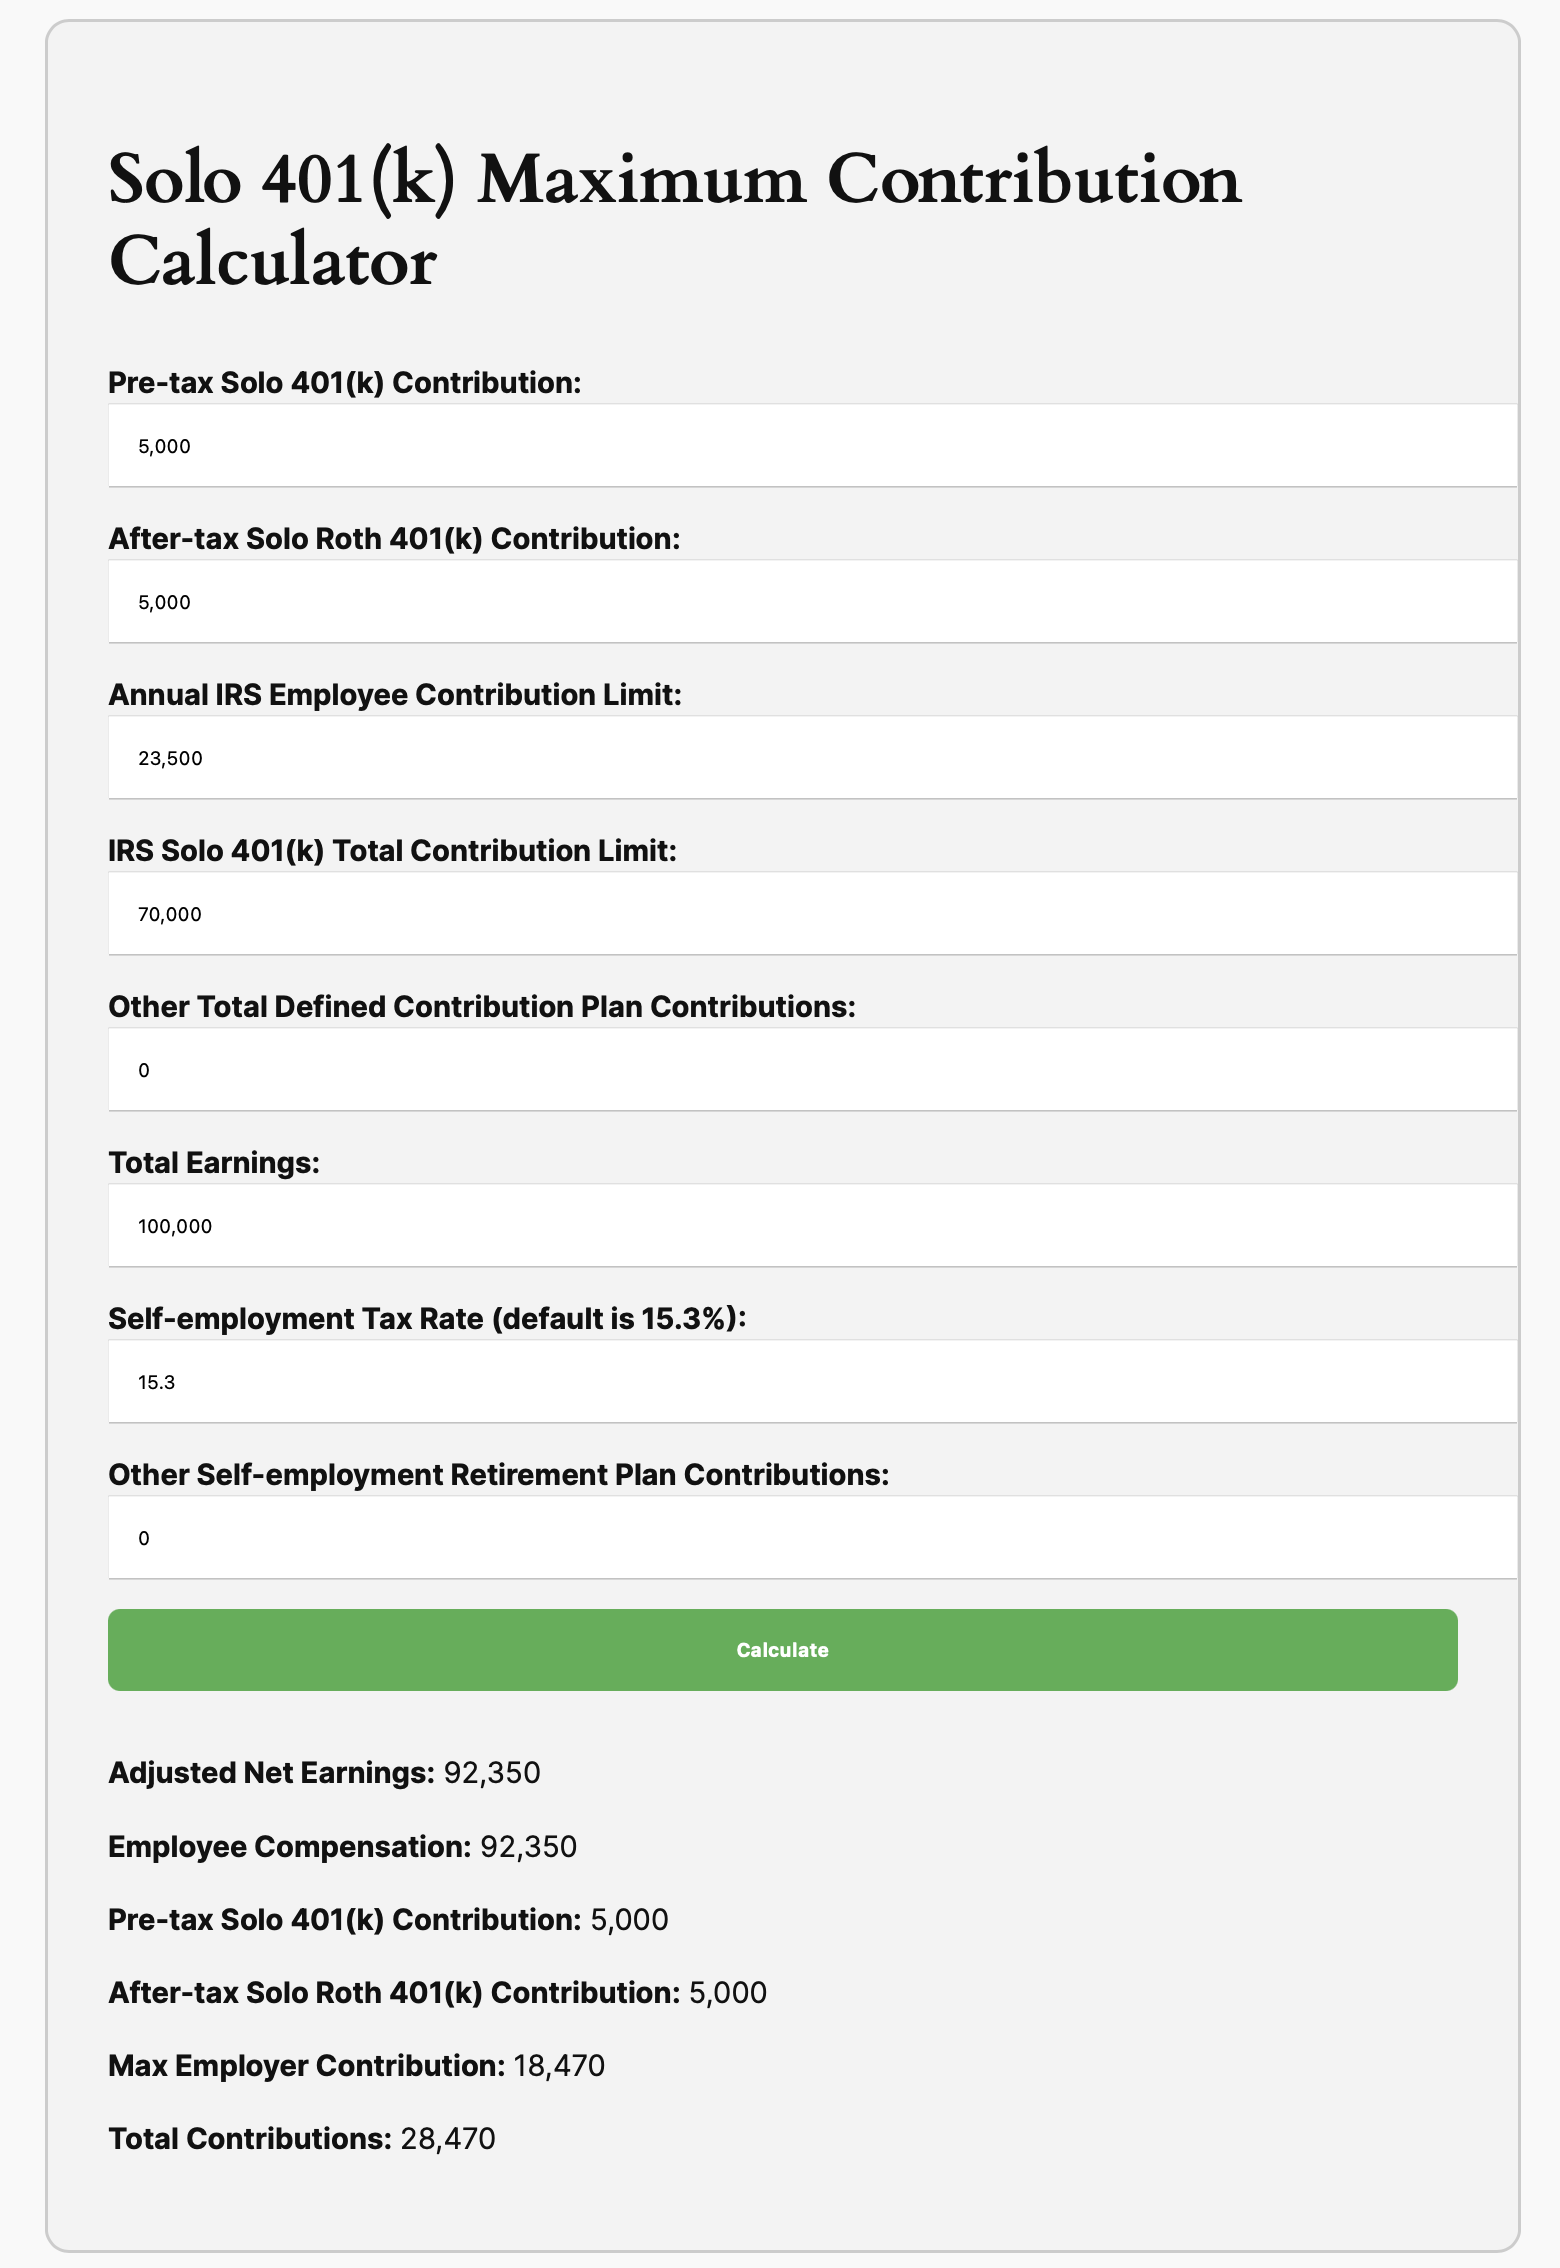
- Tools & Tips: Solo 401(k) Maximum Contribution Calculator
- Market Overview
-
Which Health Insurance Plan Is Better: HMO, PPO or HDHP?
- Latest in Retirement Savings & Personal Finance: Highest Health Benefit Cost in 15 Years, Visualize Americans’ Healthcare Affordability, Americans Admire Luxury Spending
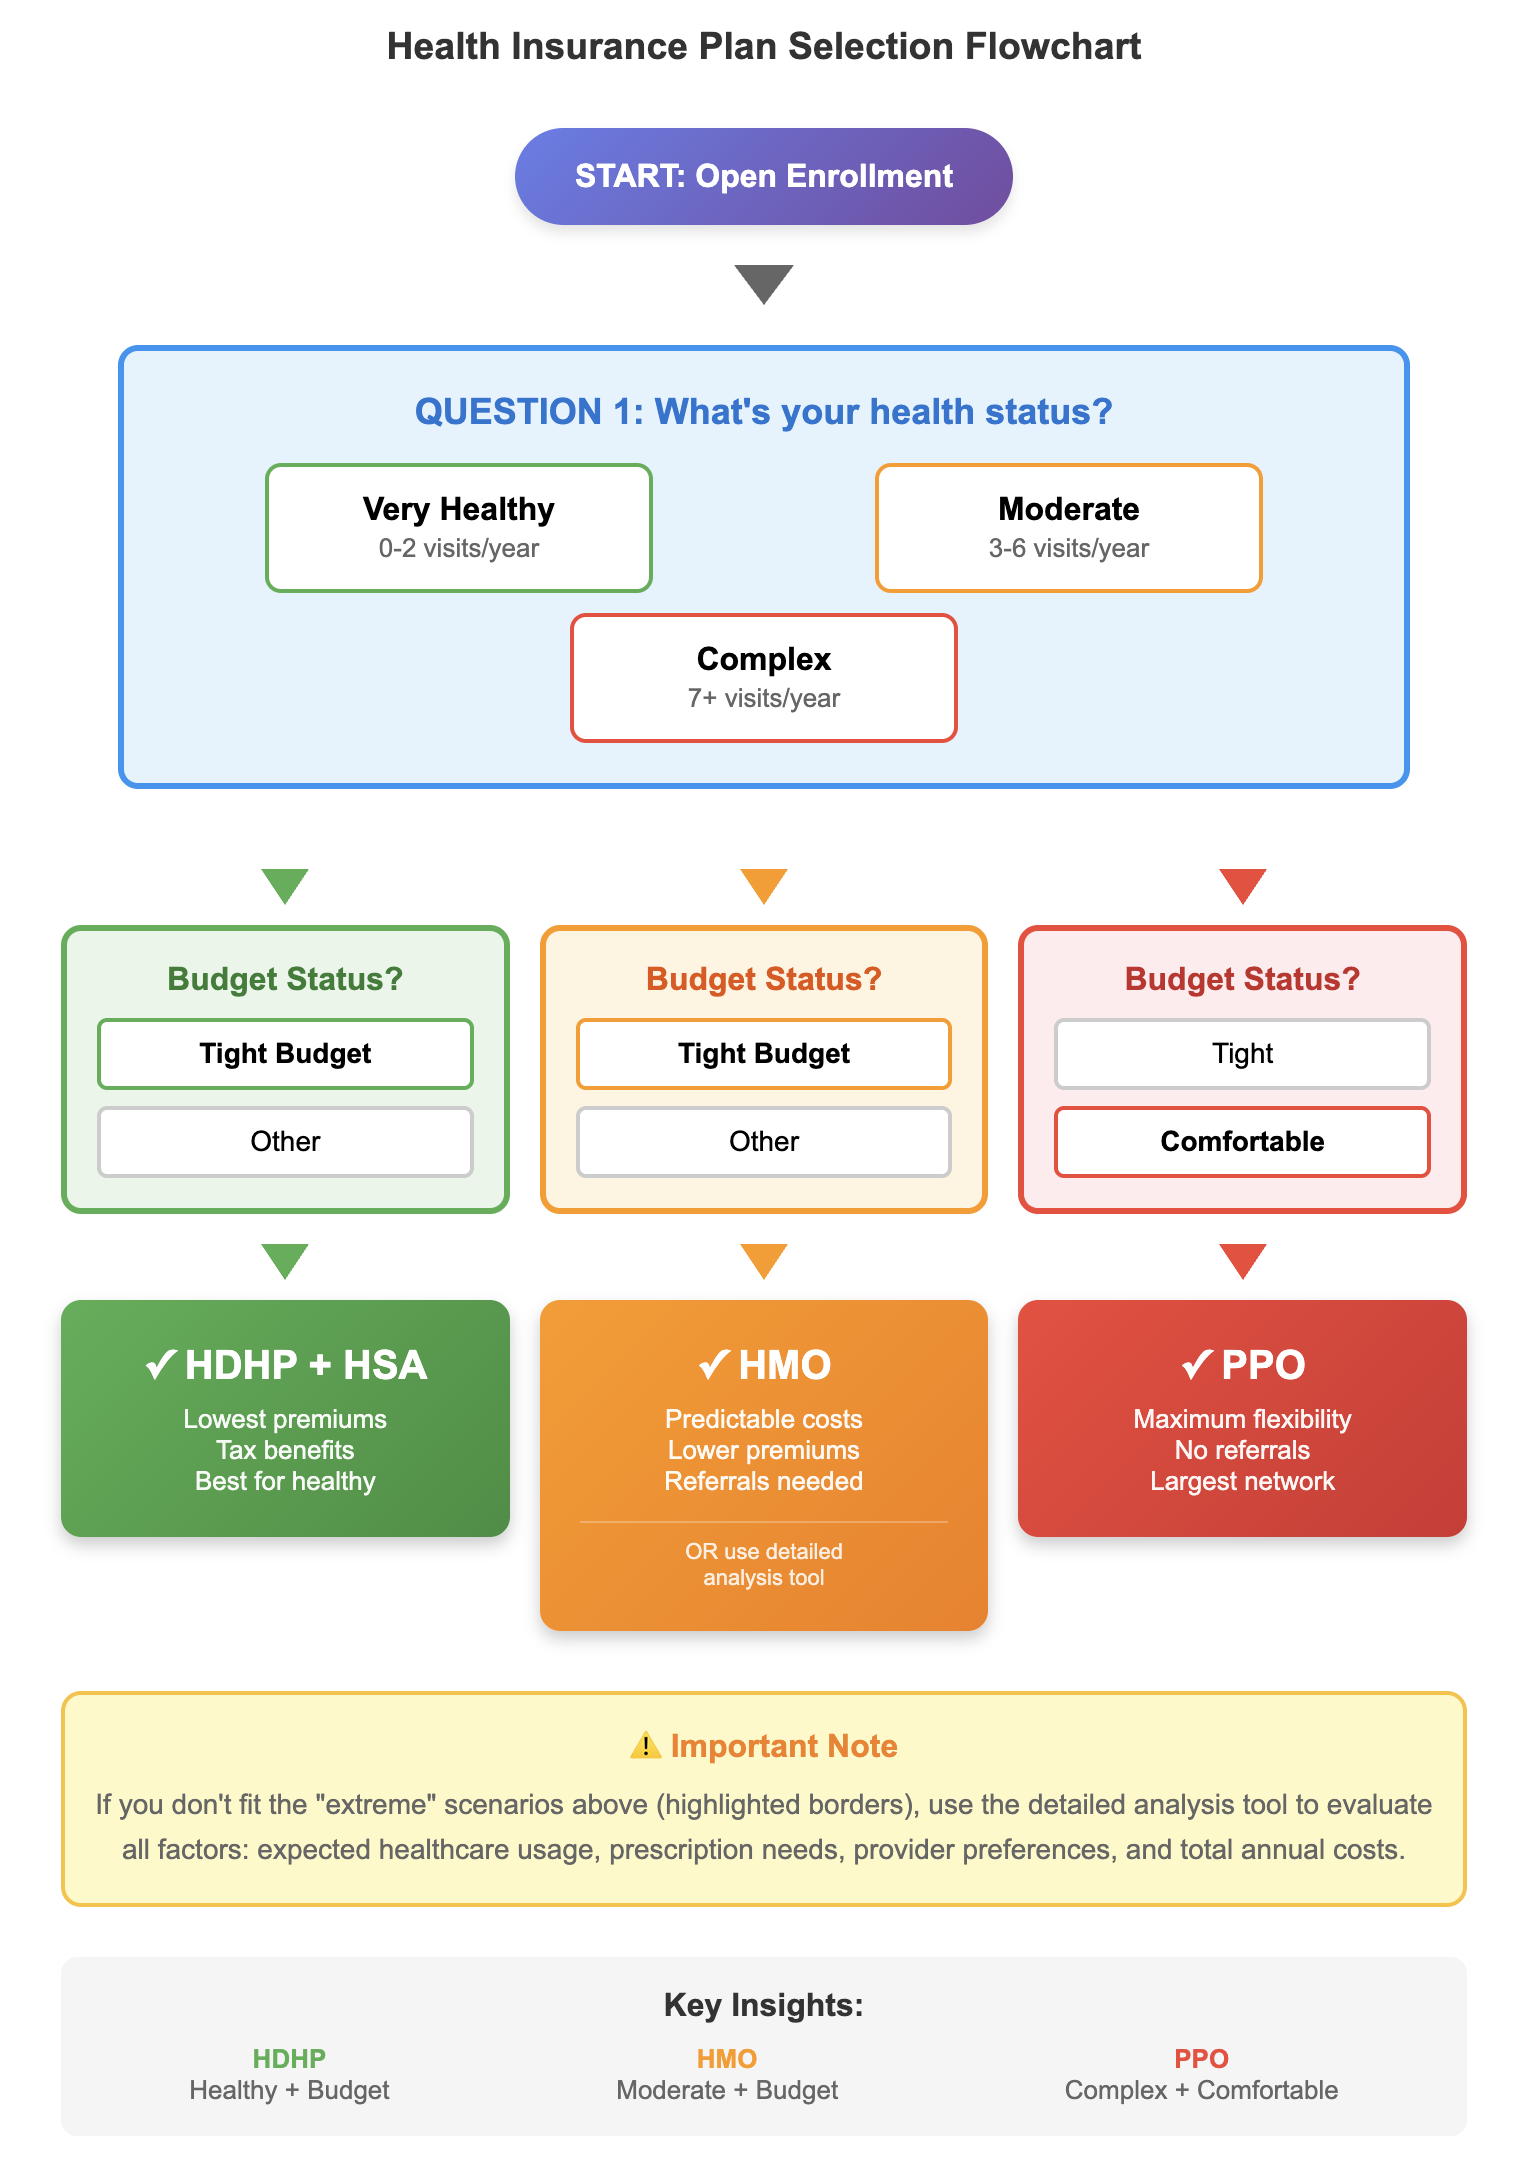
- Which Helath Insurance Plan Is Better: HMO, PPO or HDHP?
- Tools & Tips: Health Insurance Plan Type Helper
- Market Overview
-
How to Navigate Medicare Maze
- Latest in Retirement Savings & Personal Finance: Shutdown Showdown,Turning Fulough into an Opportunity,Subprime Auto Loan Trouble
- Traditional Medicare (Medigap) vs. Medicare Advantage
- Tools & Tips: Medicare Medigap vs. Medicare Advantage Total Cost Calculator
- Market Overview
-
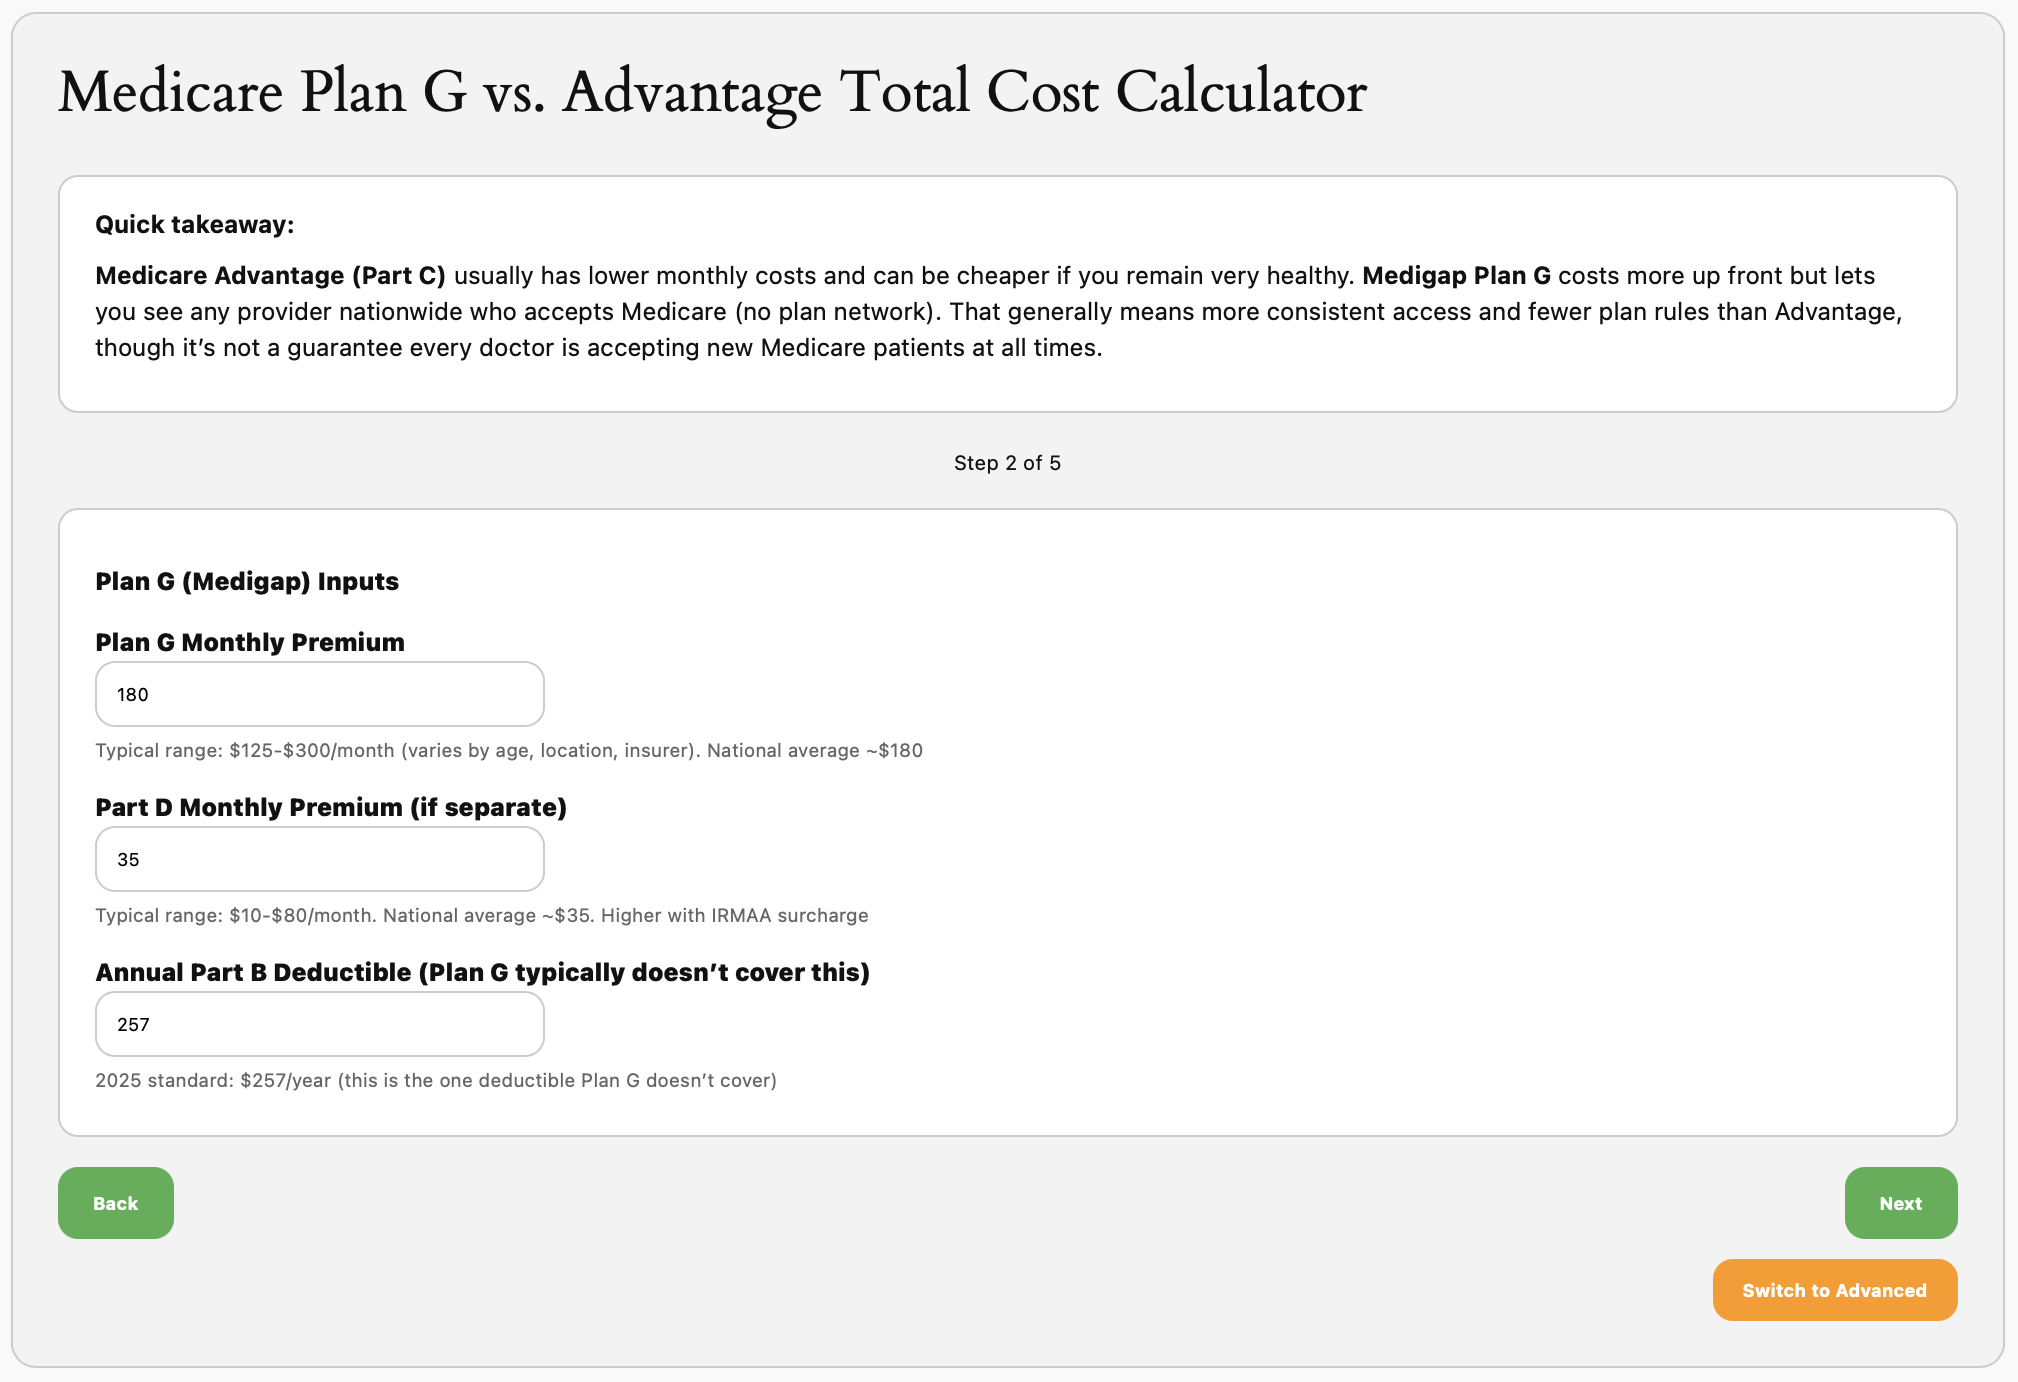
Traditional Medicare (Medigap) vs. Medicare Advantage
We compare Medigap vs. Medicare Advantage and hopefully give a clear guidance for people to weigh pros and cons between them.
-
Social Security at Risk: 2033 Deadline and What to Do
In this issue:
- Latest in Retirement Savings & Personal Finance: U.S. Household Debt Breakdown, Student Loan Reform, Private Equity & Crypto in 401(k)s
- Social Security at Risk: 2033 Deadline and What to Do
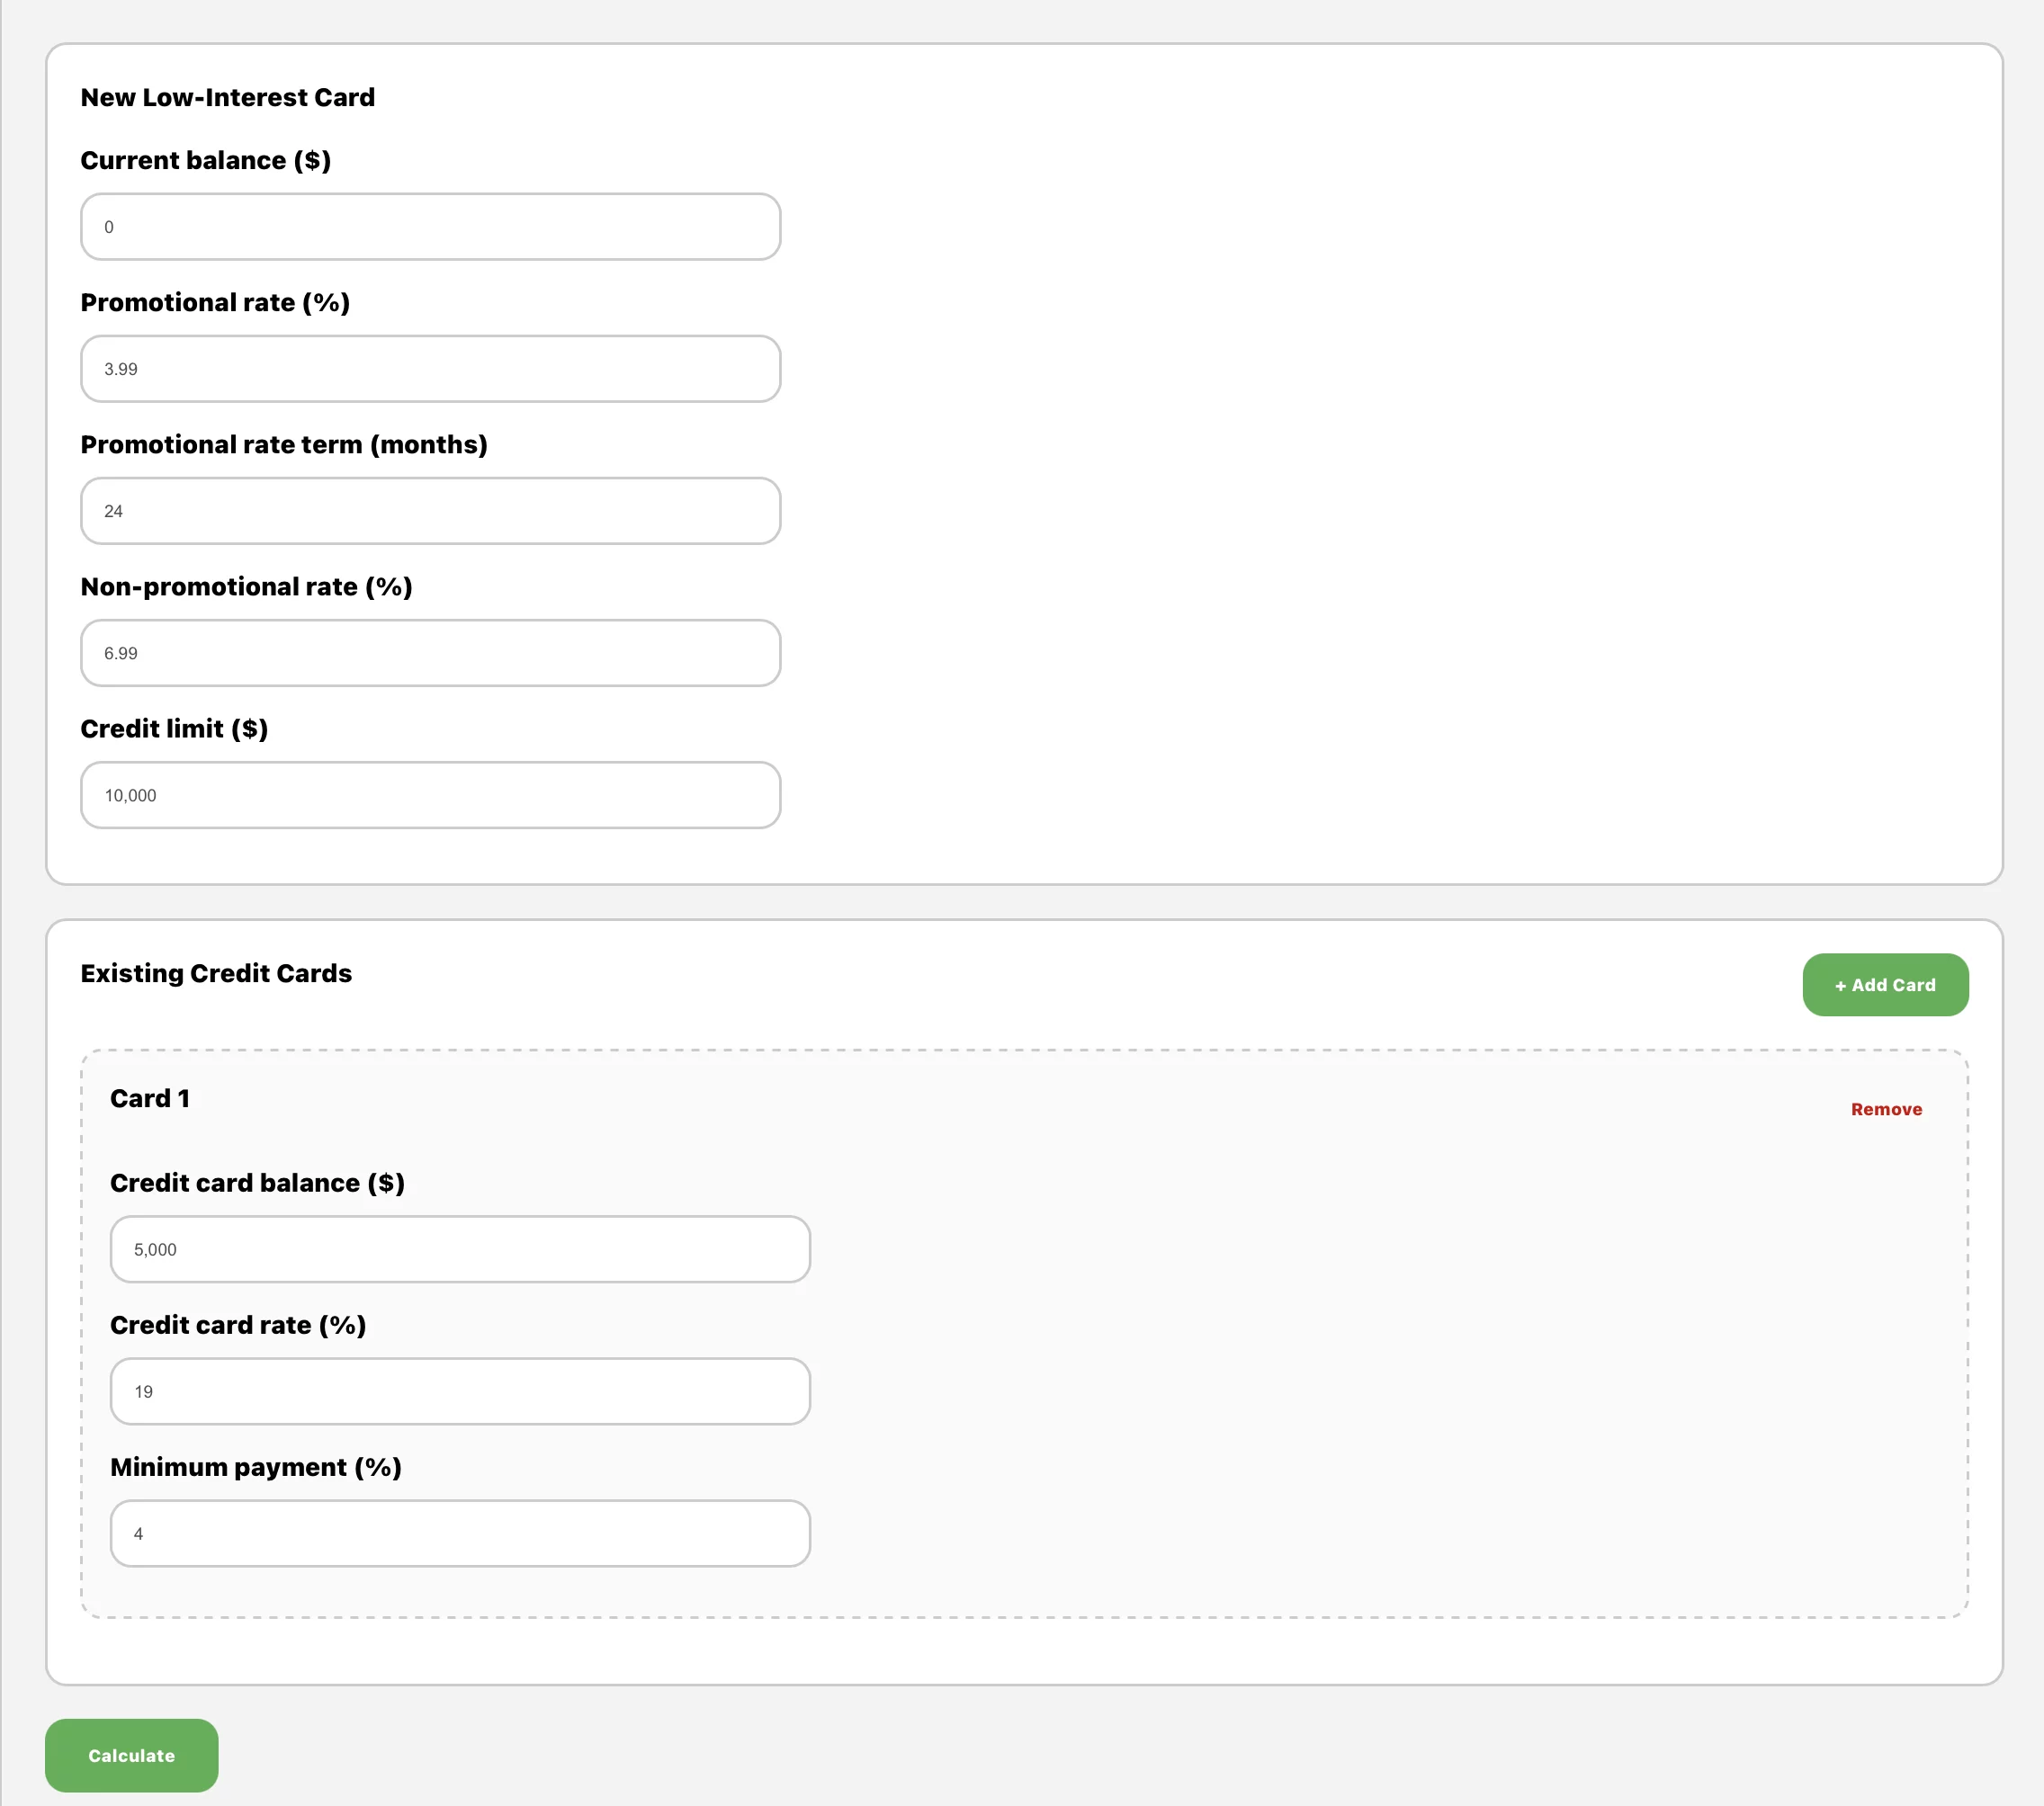
- Tools & Tips: Credit Card Balance Transfer Optimizer
- Market Overview
-

Chasing Income with Those High Yield ETFs. Smart or Misleading?
In this issue:
- Latest in Retirement Savings & Personal Finance: Missed Car Loan at a Record Level, Employment Numbers Revised Down Sharply, 31% of Retirees Considering Returning to Work
- Chasing Income with Those High Yield ETFs. Smart or Misleading?
- Tools & Tips: ULTY or MSTY Dividend Calculators
- Market Overview
-
The Most Reliable Retirement Savings: Why $1.8 Million is a Popular Lie
In this issue:
- Latest in Retirement Savings & Personal Finance: Retirement Savings Still Fall Short, Sluggish Home Sales & The Most Overvalued Stock Market
- The Most Reliable Retirement Savings Needed: Why $1.8 Million is a Popular Lie
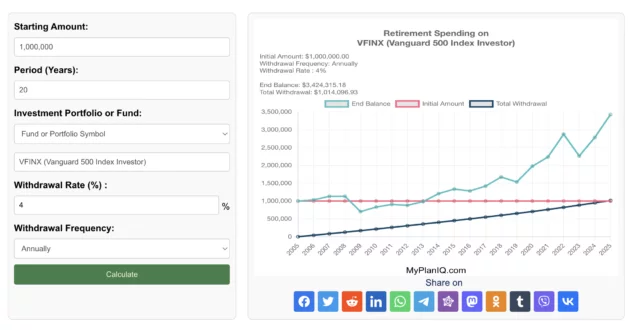
- Tools & Tips: Retirement Spending Calculator Based on a Portfolio, Fund, or Stock
- Market Overview
-

The Most Reliable Retirement Savings Amount You Need in 2025
You’ve probably come across those big retirement numbers that show up in media or surveys. Most of them sound a lot higher than what many people can actually save. Here are some popular ones: In this article, we will walk you through to show how an American with median income needs far less than the above headline numbers to retire at a similar quality life before retirement. A simple retirement spending formula is to utilize so called 4% wtihdrawal rule: the conventional wisdom goes that if you manage to withdraw 4% every year in a conservative investment portfolio (such as 70% in bonds and 30% in stocks), you probably will end up being able to extend your capital beyond 25 years: remember spending 4% every year in an account without much investment gain will deplete the account completely in 25 years (100%/4%=25). Financiall planners often use this 4% as a rule of thumb to gauge how much retirement income you need. Or put it another way, if you need to spend $10,000 a year, you would need to save $10,000 * 25 =$250,000 income before the retirement. So here are some numbers we can play with a typical American of 65 year old with median income: According to BLS data summarized by SmartAsset, full‑time workers aged 65+ earn a median of roughly $60,268 per year. Financial planners generally advise replacing 75%–85% of pre‑retirement income; Schwab specifically recommends about 80%. That puts your retirement income target at about $48,000 annually. Meanwhile, the average newly retired worker collects about $2,000 per month in Social Security, or $24,000 per year, as of 2025. That equates to Social Security covering nearly half your income goal, leaving a gap of $24,000 per year. Under the 4% safe withdrawal rule, you’d need only $24,000 * 25 = $600,000 (as 100%/4%=25) in savings to generate that supplemental income. This is far less than the headline figures! Why $600K Can Be Enough That’s not to say larger balances are useless. But if you can invest $600K conservatively and consistently earn about 4% after inflation, that portfolio should support a stable $24,000 annual withdrawal. It could last decade, and you can still manage to leave something over at the end. This amount also reduces pressure to chase high‑risk strategies during market fluctuations. In comparison, obsessing over a $1.8 million goal may mislead you into delaying retirement unnecessarily or taking undue risks. Why Realistic Targets Matter — Both Psychologically and Economically Setting an overly ambitious savings target like $1.8 million can create anxiety, discouragement, or inaction. Many people in their 50s or 60s with $300K–$400K saved may feel they’ve already failed, even if they are on track for a comfortable retirement based on income replacement. That psychological burden can erode confidence and planning energy. Economically, inflating your savings goal can steer you toward riskier investments or unnecessary financial austerity in your productive years. By contrast, a realistic target tied to your actual needs lets you invest steadily, spend reasonably now, and retire with clarity. It also makes you to focus on your investment portfolio risk, something you can manage with tools like MyPlanIQ’s Fixed‑Income and Tactical Portfolios, which aim for low‑volatility, inflation‑beating performance for retirement savings. Individuals Vary Of course, the above is just a ‘typical’ American. For all of us, we are anything but an exact typical. For people who have higher income, you can easily see that your retirement savings needed for a comfortable retirement life can double or even triple (for a person with $180,000 annual compensation before retirement, for example). Of course for such a person with $180,000 before retirement, she or he indeed might need 3*600,000 or $1.8m savings! The point is, everyone should take time to run some numbers using the basic rule of thumb discussed in this article to understand their own situation. Headline figures are just headlines. They meant to grab your attention. But the real story is always in the details.
-
The Best Age (62, 67, or 70) to Claim Your Social Security Benefits
In this issue:
- Latest in Retirement Savings & Personal Finance: Social Security Benefit Tax in One Big Beautiful Bill, The Worst US Treasury Bond Returns in History!
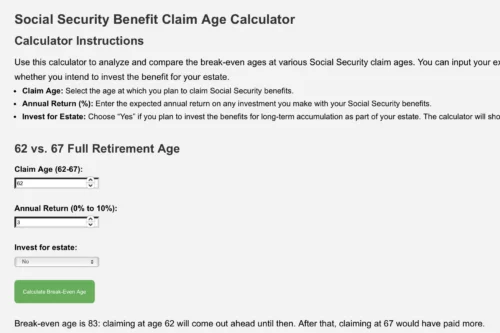
- The Best Age (62, 67, or 70) to Claim Your Social Security Benefits
- Tools & Tips: Social Security Benefit Claim Age Calculator
- Market Overview
-
Retirement Withdrawals in Optimal Order
In this issue:
- Latest in Retirement Savings & Personal Finance: Amazon Prime Day Record Sales, Inflation Rise Again? Underestimating Hobby and Pastime Costs
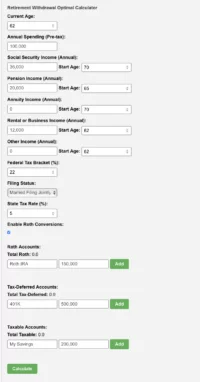
- Retirement Withdrawals in Optimal Order
- Tools & Tips: Retirement Withdrawal Optimal Calculator
- Market Overview
-
Best Strategy to Withdraw Funds in Retirement
When you retire, the order you pull funds from your accounts (whether taxable, traditional, or Roth) can make big difference.
-

Retirement Milestone Cheat Sheet
In this issue:
- Latest in Retirement Savings & Personal Finance: OBBB Tax Changes, More Debt Among Millennials, Adult Children Living at Home
- Retirement Milestone Cheat Sheet
- Tools & Tips: Main ETFs You Can Use
- Market Overview
-
Annuity Income Payout vs. Invest & Withdraw
In this issue:
- Latest in Retirement Savings & Personal Finance: Annuity Is Back, HSA & Retirement Healthcare Improvement, Growing Medical Debt Crisis
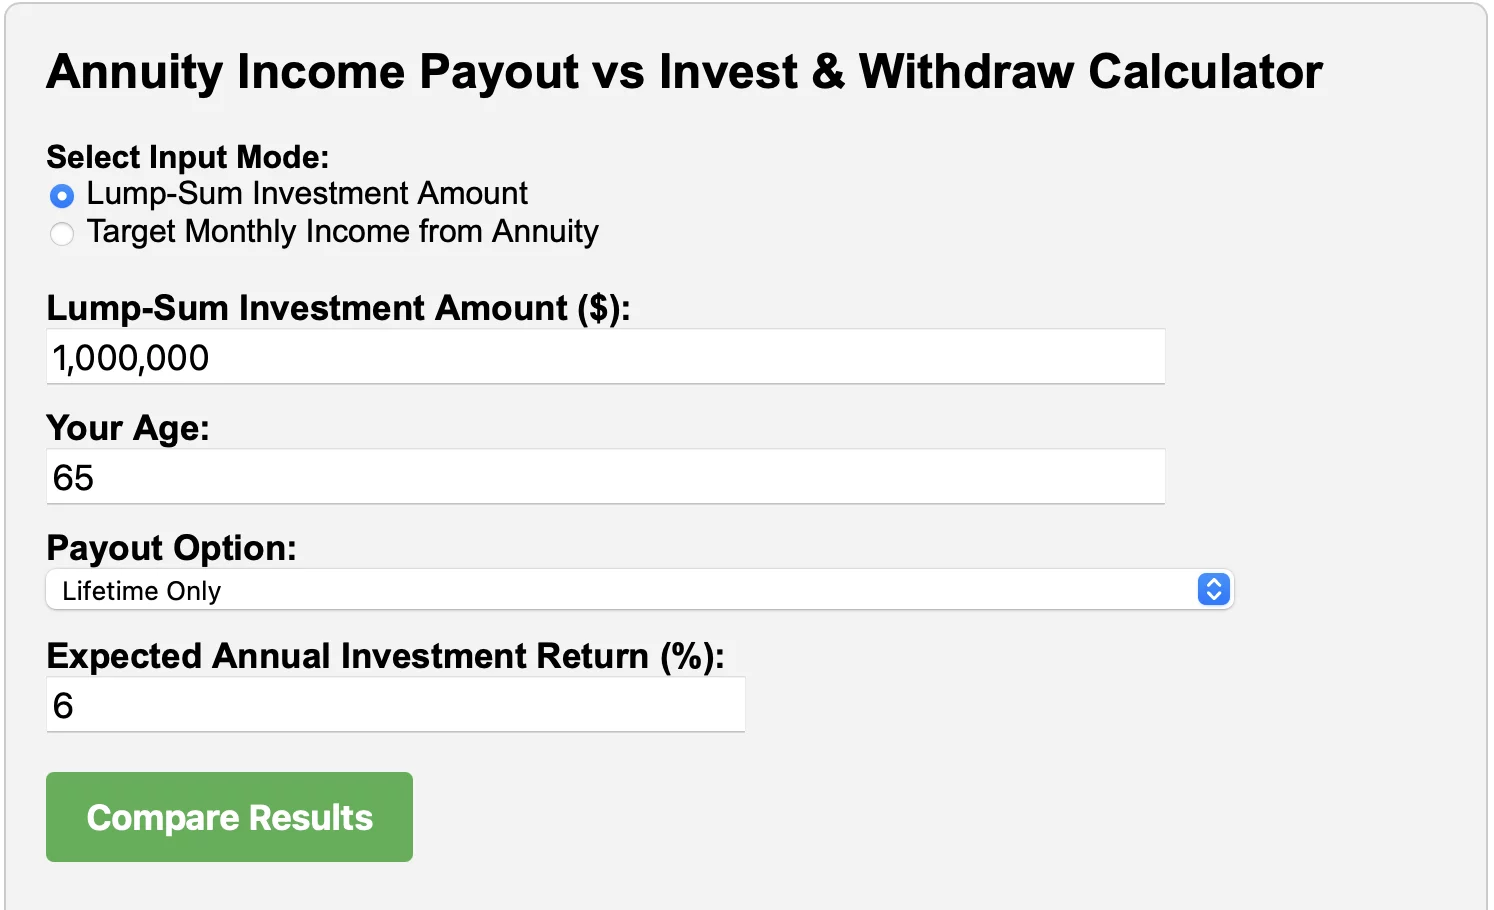
- Tools & Tips: Annuity vs Invest Calculator
- Annuity Income Payout vs. Invest & Withdraw
- Market Overview
-
Public Pay Might Be Higher Than You Think (Once You Do the Math)
In this issue:
- Latest in Retirement Savings & Personal Finance: High 401(k) Savings Rate, The Big Beautiful Bill’s Deficit Increase & Who Are Affected by the BBB
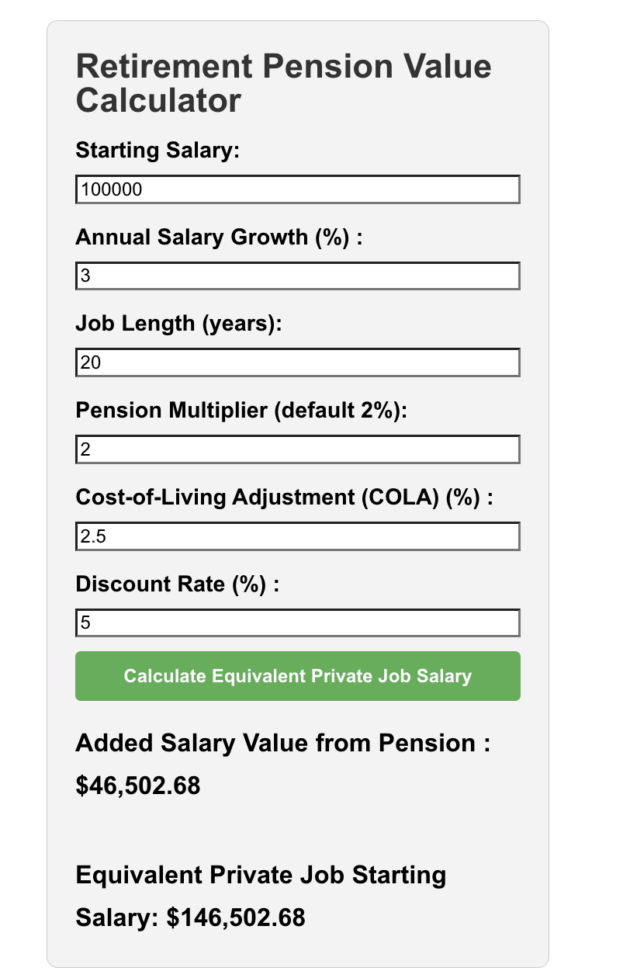
- Public Pay Might Be Higher Than You Think (Once You Do the Math)
- Tools & Tips: Retirement Pension Value Calculator
- Market Overview
-
Simple 401(k) Investment Guide
In this issue:
- Latest in Retirement Savings & Personal Finance: College Education Affordability Declined, Rising Debt Puts Your 401(k) Retirement Savings in a Pickle
- Simple 401(k) Investment Guide
- Tools & Tips: 401(k) Investment Assistant
- Market Overview
-
Income Growth, Historical 401(k) Contribution Limit Data
In this issue:
- Latest in Retirement Savings & Personal Finance: Interest Rates Rise Again, Rising Home Insurance Cost, …
- Historical Income Growth, 401(k) Contribution Limit Growth
- Tools & Tips: 401(k) Maximum Match Calculator — Marvell Semiconductor
- Market Overview