 |
Vanguard ETF: |  |
7.4%* |
|
Diversified Core: | |
8.1%* |
|
Six Core Asset ETFs: | |
7.3%* |
Articles on LQD
- Commodity Indicators for Week of November 15th
11/17/2010
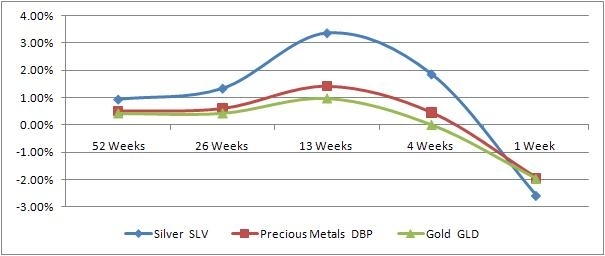
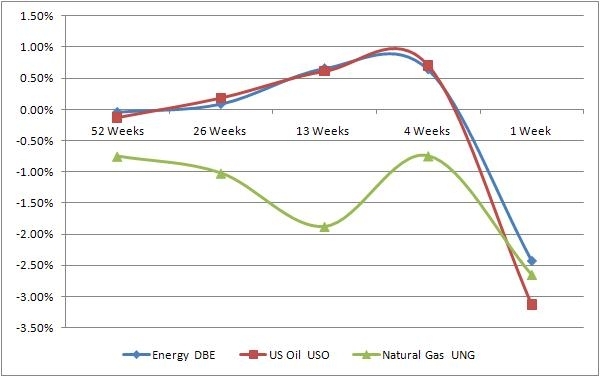
Commodities will play an increasingly important role as we climb out of the recent market mahem and inflation becomes a reality. MyPlanIQ tracks detailed weekly commodity trend movement. We use ETFs that represent commodity subgroups including agriculture, precious metals, base metals, energy and present the results here.
More details are available on the MyPlanIQ website.
Commodities can almost be split in two -- precious metals that react to currency devaluation and the rest which will be impacted by inflation and economic growth.
Most of the indicators are positive as we see turbulence in the currency markets, forecasts of a cold winter and the expectation that supplies will be tight as various economic stimulus packages spur growth.Description
Symbol
15-Nov
Direction
8-Nov
Silver
SLV
26%
v
34%
Precious Metals
DBP
12%
v
17%
Gold
GLD
9%
v
13%
Base Metals
DBB
9%
v
13%
Agriculture
DBA
8%
v
14%
Commodity
DBC
6%
v
10%
Energy
DBE
2%
v
3%
US Oil
USO
1%
v
3%
Natural Gas
UNG
-19%
v
-18%
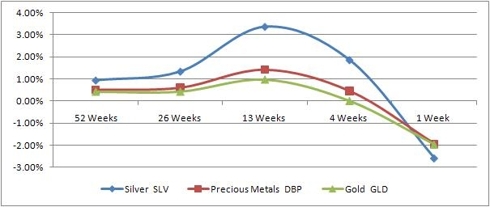
Precious metals are increasingly being seen as a currency reference point as a range of currencies that were once standards are going to be under pressure as national debt forces stringent responses. This is likely to continue for some time.
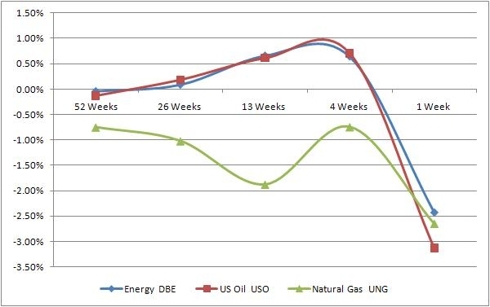
As we enter winter, the demand for oil and energy will increase, driving prices higher. This will also be impacted by the dollar as oil is traded in that currency.
Natural gas is held in check by large stockpiles reducing the liklihood of any type of shortfall even if the winter turns out to be as cold as forecasted.labels:investment,
Symbols:SLV,DBP,GLD,DBB,DBA,DBC,DBE,USO,UNG,SPY,QQQQ,IWM,MDY,EFA,VEU,EEM,VWO,IYR,ICF,VNQ,GSG,LQD,CSJ,CIU,HYG,JNK,PHB,TLT,IEF,SHY,SHV,BND,AGG,MUB,MBB,
- Where is the Smart Money Going
11/17/2010
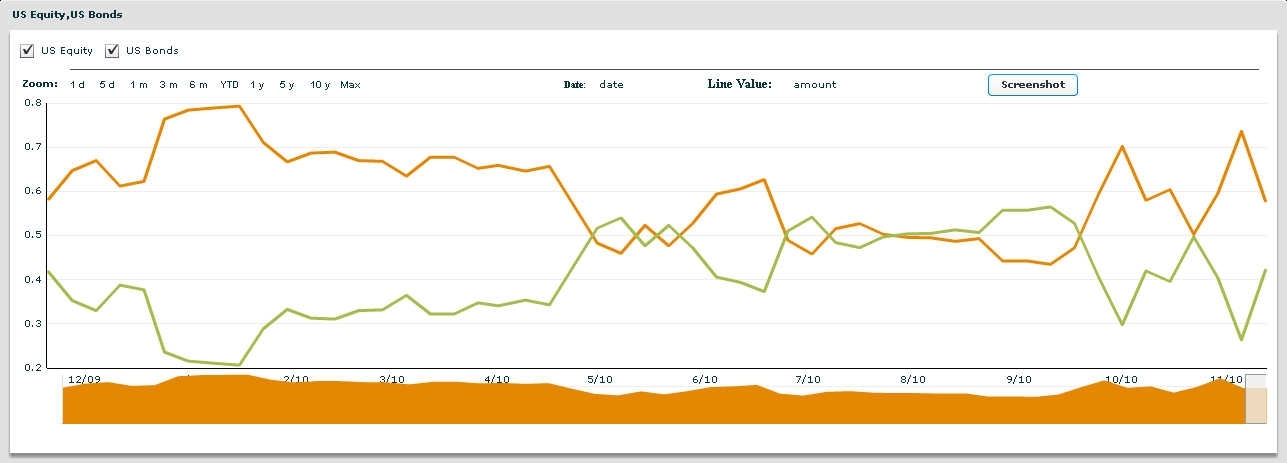
We are initiating coverage of where moderate allocation funds are putting their money. This will give an indication of whether fund managers are being more conservative or aggressive this week.
We track two separate indicators:
-
We review and assign the top 3 Moderate Allocation Funds. We then track their exposure to fixed income and risk based assets. This is calculated weekly and covers the last one year.
-
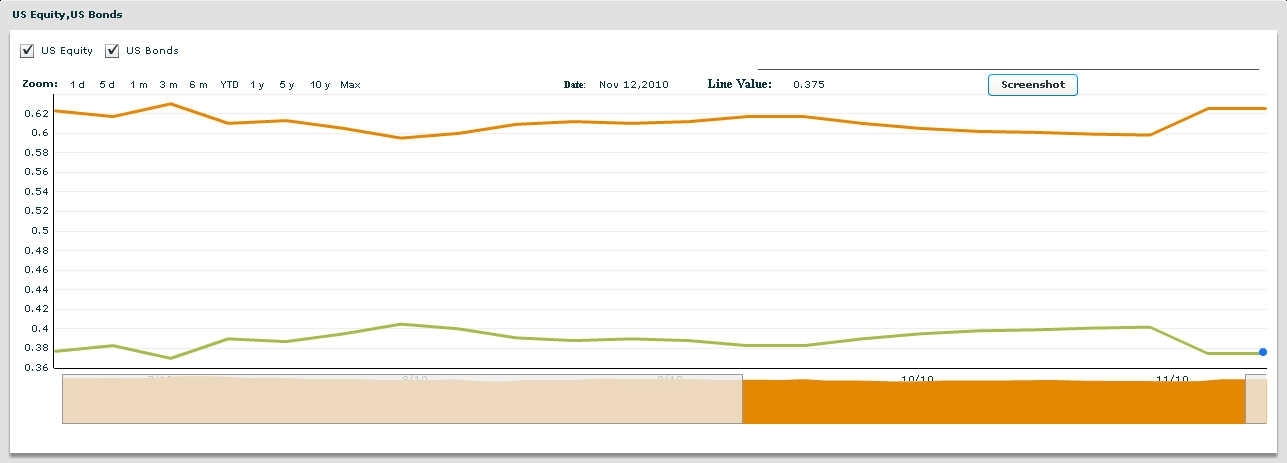
We then aggregate the exposure to fixed income and risk based assets of all Moderate Allocation Funds. It is calculated weekly and covers the last one year.
click to enlarge

We can see some big variations over the past year and considerable recent volatility. We can see the impact of QE2 driving equities up and then the weakness towards the end of the weak as most indices fell. There would be a more defensive move to fixed income assets.
At this point, the balance is marginally defensive.

The aggregate group is not reacting to the changes -- the moderate portfolios have become slightly more aggressive. This may change if the current sentiment continues.
labels:investment,
Symbols:SPY,QQQQ,IWM,MDY,EFA,VEU,EEM,VWO,IYR,ICF,VNQ,GSG,DBC,DBA,USO,LQD,CSJ,CIU,HYG,JNK,PHB,TLT,IEF,SHY,SHV,BND,AGG,MUB,MBB,
-
- Countries All Drop -- India significantly, Japan only a little
11/16/2010
MyPlanIQ tracks detailed weekly country economic trend movement. We use ETFs that represent each geographic region and present the results here.
This is the second week of coverage and with QE2 and G20 meetings behind us. Each sovereign nation will deal with their own challenges as they react changes on the international stage.
More details are available on the MyPlanIQ website.
The largest industrial nations are meeting in Seoul this week and one of the topics on the agenda is rebalancing global growth.Nation
Symbol
15-Nov Trend Score
Direction
8-Nov Trend Score
Hong Kong
EWH
16%
v
21%
South Africa
EZA
14%
v
20%
Singapore
EWS
13%
v
18%
India
INP
12%
v
24%
Mexico
EWW
12%
v
16%
Malaysia
EWM
11%
v
16%
South Korea
EWY
10%
v
15%
Germany
EWG
8%
v
13%
Taiwan
EWT
8%
v
13%
United Kingdom
EWU
8%
v
12%
Russia
RSX
7%
v
15%
Canada
EWC
7%
v
11%
Australia
EWA
7%
v
15%
China
FXI
6%
v
12%
Switzerland
EWL
6%
v
12%
Belgium
EWK
5%
v
11%
Austria
EWO
5%
v
11%
Brazil
EWZ
5%
v
12%
France
EWQ
4%
v
10%
Japan
EWJ
4%
v
4%
The Netherlands
EWN
4%
v
9%
Italy
EWI
1%
v
5%
Spain
EWP
-1%
v
1%
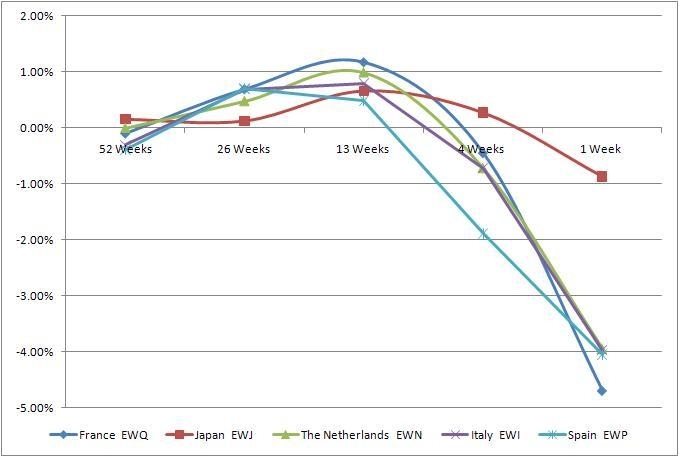
India and Russia see the biggest change with India dropping out of the top three.
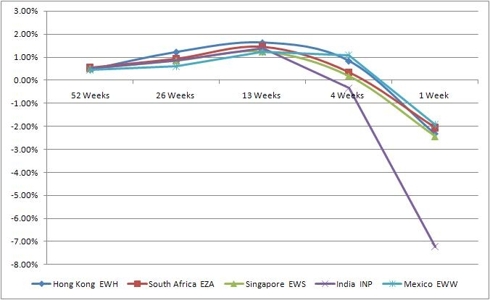
With the exception of India, the top of the group behave in a similar way as the markets pulled back in the second half of the week.
India will be one to watch to see if it bounces back next week.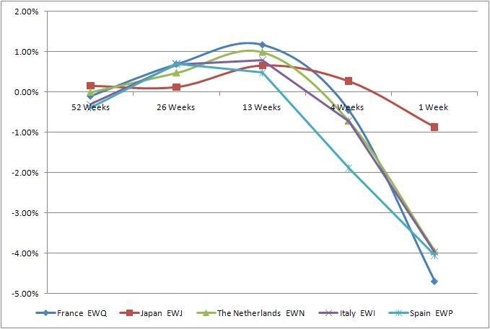
The countries at the bottom of the list also reacted in a cluster dropping around 4% with the exception of Japan that has a much more muted response.
Clearly the last week has been a challenging one and we will have to watch which ones rebound and to what extent.labels:investment,
Symbols:INP,EZA,EWS,EWH,EWW,EWM,EWY,RSX,EWA,EWT,EWC,EWZ,EWL,EWG,EWU,FXI,EWK,EWN,EWJ,EWQ,EWO,EWI,EWP,SPY,QQQQ,IWM,MDY,EFA,VEU,EEM,VWO,IYR,ICF,VNQ,GSG,DBC,DBA,USO,LQD,CSJ,CIU,HYG,JNK,PHB,TLT,IEF,SHY,SHV,BND,AGG,MUB,MBB,
- ETF Based Bond Trend Indicators For The Week of November 15
11/15/2010
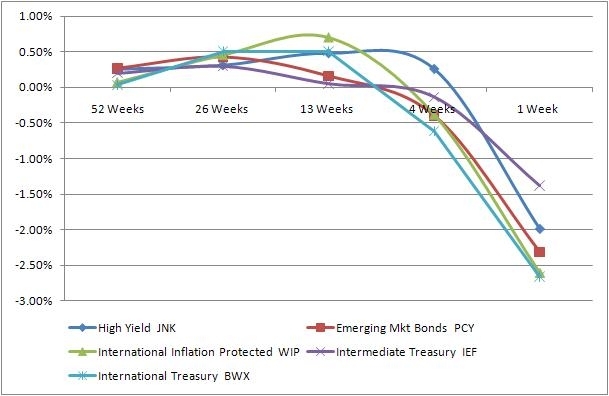
Fixed income is a key asset class categories in portfolio building. The main risks are represented by long/intermediate/short maturity bonds and high yield (junk), credit bonds. These indices provide important insight into debt market conditions that are key to asset allocation strategies. MyPlanIQ tracks detailed weekly bond trend movement. We use ETFs that represent the bond classes. For more information, please visit MyPlanIQ 360 Degree Market View.
The Federal Reserve's low rate policy has driven down bond yields to historical low. The Fed's QE2 announced last week showed Fed's committed action to maintain a long period of low rates to stimulate the economy. Investors should take a note on the 20+ year treasury bonds that has had trouble recently: reflecting a belief that eventually, Fed's action will result in much higher inflation. International fixed income bonds are rising because of the US dollar weakness.
Description
Symbol
15-Nov Trend Score
Direction
8-Nov Trend Score
High Yield
JNK
5%
v
8%
Emerging Mkt Bonds
PCY
5%
v
9%
International Inflation Protected
WIP
4%
v
7%
Intermediate Treasury
IEF
3%
v
5%
International Treasury
BWX
3%
v
6%
Long Term Credit
LQD
3%
v
5%
Intermediate Term Credit
CIU
3%
v
4%
Inflation Protected
TIP
2%
v
4%
10-20Year Treasury
TLH
2%
v
4%
MBS Bond
MBB
1%
v
2%
US Total Bond
BND
1%
v
2%
Short Term Credit
CSJ
1%
v
1%
Short Term Treasury
SHY
0%
v
1%
Treasury Bills
SHV
0%
v
0%
New York Muni
NYF
0%
v
2%
20+ Year Treasury
TLT
-1%
v
1%
National Muni
MUB
-1%
v
2%
California Muni
CMF
-1%
v
1%
Top Five Indicators
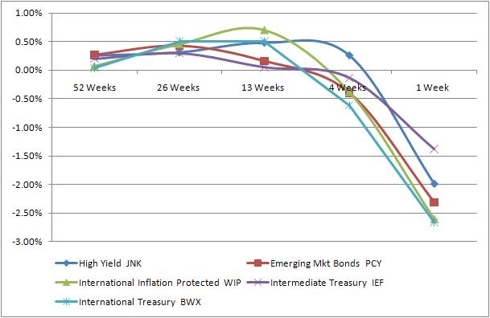
There is weakness across the board without any indication of what is
Bottom Five Indicators
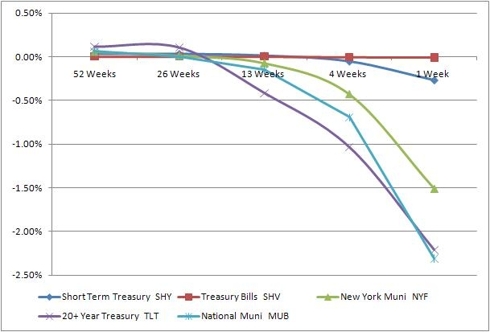
The worst performers are treasury bonds, especially in the 20+ year ones. Again, it is telling that investors definitely have a negative outlook in a long term for fixed income. Other bottom performers all have less risky nature, reflecting investors' chase for high yields and increasing risk appetite.
In conclusion, bonds in general continue to do well. Investors should keep an eye on such euphoria outlook and watch carefully on the possible turn that eventually will happen: exceptional low rates have to come with a price and can only sustain for so long.labels:investment,
Symbols:AGG,BND,SHV,SHY,IEF,TLH,TLT,TIP,WIP,HYG,JNK,PHB,CSJ,CIU,LQD,BWX,CMF,NYF,MUB,MBB,PCY,EMB,
- Retirement Income Portfolio Building Using ETFs and Asset Allocation Strategies
11/12/2010
Building a steady and safe income producing portfolio is paramount to retirees. High yield stocks, preferred stocks, convertibles and bonds are the basic building blocks for such portfolios. Research results indicate that blue chip stocks with high dividends, unlike highly volatile and low dividend or no dividend stocks (such as many high tech stocks and small company stocks), have produced comparable or even slightly higher returns with less risk in long term.
In this article, we present a high income investment plan (Retirement Income ETFs) that is based on asset allocation strategies. Both MyPlanIQ Strategic Asset Allocation (SAA) and Tactical Asset Allocation (TAA) strategies are used to construct model portfolios.
This plan is designed for income producing purpose: high dividend (yield) stock ETFs are chosen for both US stocks and international stocks asset classes. We have decided to use general emerging market stocks ETFs (EEM or VWO) instead of some thinly traded high dividend emerging market stock ETFs. This situation will be changed once the high yield emerging market stock ETFs become more liquid and tradable.
The plan uses 34 ETFs that represent the following five key asset classes:
U.S. stocks: VIG, DVY, SDY, FVD, VYM, PEY, PFF
International stocks: PID, IDV
Emerging market stocks: EEM, VWO
Real Estate Investment Trusts (REITs): IYR, ICF, VNQ, RWX
Fixed Income:- US Fixed Income: HYG, LQD, VCLT, CIU, CORP, CSJ, VCSH, IEI, IEF, SHY, TLT, TIP, MBB, MUB, SHM
- International Fixed Income: BWX, EMB, PCY, WIP
Notice that preferred stocks PFF is classified under U.S. stocks.
We compared the back tested performances of the SAA and TAA moderate model portfolios with the corresponding SIB (Simpler Is Better) five core asset ETF portfolios. As of 11/9/2010, the performance is:Performance table (as of Nov 10, 2010)
Portfolio Name 1Yr AR 1Yr Sharpe 3Yr AR 3Yr Sharpe 5Yr AR 5Yr Sharpe Retirement Income ETFs Tactical Asset Allocation Moderate 16% 105% 8% 57% 12% 84% Retirement Income ETFs Strategic Asset Allocation Moderate 14% 108% 1% 5% 6% 28% Five Core Asset Index ETF Funds Tactical Asset Allocation Moderate 15% 105% 8% 57% 16% 106% Five Core Asset Index ETF Funds Strategic Asset Allocation Moderate 19% 146% 4% 16% 10% 42% From the above chart, one can see that since the portfolio inception (12/31/2000),the Retirement Income ETFs Strategic Asset Allocation Moderate has outperformed its corresponding Five Core Asset Index ETF Funds Strategic Asset Allocation Moderate while in the meantime, the Retirement Income ETFs Tactical Asset Allocation Moderate has outperformed its corresponding Five Core Asset Index ETF Funds Tactical Asset Allocation Moderate. In fact, in the past ten years, the Retirement Income portfolios had lower standard deviation than the Five Core SIB. Please visit the corresponding portfolios for more detailed performance information.
Currently, the SAA Moderate Portfolio has the following holdings and yields:Asset ETFs Allocation Yield REAL ESTATE ICF (iShares Cohen & Steers Realty Majors) 11.96% 2.88% FIXED INCOME LQD (iShares iBoxx $ Invest Grade Corp Bond) 18.40% 4.80% Emerging Market VWO (Vanguard Emerging Markets Stock ETF) 13.31% 1.20% US EQUITY DVY (iShares Dow Jones Select Dividend Index) 5.92% 3.53% US EQUITY PEY (PowerShares HighYield Dividend Achievers) 4.87% 4.28% INTERNATIONAL EQUITY IDV (iShares Dow Jones Intl Select Div Idx) 16.50% 4.25% High Yield Bond HYG (iShares iBoxx $ High Yield Corporate Bd) 16.47% 8.40% INTERNATIONAL BONDS BWX (SPDR Lehman Intl Treasury Bond) 12.57% 0.70% Total Yield 4% Compared with current sub-zero interests in a cash account, the above portfolio's yield is very attractive.
In conclusions, using effective asset allocation strategies (especially the tactical asset allocation strategy), one can build an income producing portfolio that is less risky and achieve higher returns. Retirees or anyone who needs supplemental income can benefit from learning more on these investment plans.labels:investment,
Symbols:VIG,DVY,SDY,FVD,VYM,PEY,PFF,SPY,IWM,PID,IDV,EFA,VEU,EEM,VWO,IYR,ICF,VNQ,RWX,HYG,LQD,VCLT,CIU,CORP,CSJ,VCSH,IEI,IEF,SHY,TLT,TIP,MBB,MUB,SHM,AGG,BND,BWX,EMB,PCY,WIP,
- ETFs Provide Insight Into U.S. Sectors' Performance
11/12/2010
- International ETF's Give Insight on Global Economies
11/10/2010
- Dow Theory Revisited, Reviewed, Compared
10/08/2010
- Bernstein's No Brainer and Smart Money Portfolios Reviewed
10/08/2010
- Diversification, Style AND Asset Rotation Improve Portfolio Performance without Incurring Extra Risk
10/08/2010
- Three Asset Class Lazy Portfolios Reviewed
09/29/2010
- Investing with Styles Can Pay off
07/09/2010
- Understanding and Building Your ETF Portfolio
06/27/2010


- AMERICAN EXPRESS RETIREMENT SAVINGS PLAN Report On 12/03/2010
12/03/2010
This report reviews AMERICAN EXPRESS RETIREMENT SAVINGS PLAN plan. We will discuss the investment choices and present the plan rating by MyPlanIQ. Current economic and market conditions are discussed in the context of the investment portfolios in the plan. We will then show how participants in AMERICAN EXPRESS RETIREMENT SAVINGS PLAN can achieve reasonable investment results using asset allocation strategies.
Plan Review and Rating
--
AMERICAN EXPRESS RETIREMENT SAVINGS PLAN's 401K plan consists of 24 funds. These funds enable participants to gain exposure to 4 major assets: US Equity, Foreign Equity, Emerging Market Equity, Fixed Income. The list of minor asset classes covered:
Diversified Emerging Mkts: EEM, GMM, PXH, DEM, SCHE
Foreign Large Blend: EFA, VEU, GWL, PFA
Foreign Large Value: EFV, PID, DWM
Foreign Small/mid Value: SCZ
Intermediate-term Bond: AGG, CIU, BIV, BND
Large Blend: IVV, IYY, IWV, VTI, VV, SPY, DLN, RSP, SCHX
Long-term Bond: CLY, LQD, BLV, VCLT
Mid-cap Blend: IJH, IWR, JKG, VO, MDY, EMM, PJG, DON, EZM, MVV
Small Blend: IJR, IWM, JKJ, VB, DSC, PJM, DES, SAA, UWM, SCHA
Us Equity: IVV, IYY, IWV, VTI, VV, SPY, DLN, RSP, SCHX
As of Dec 2, 2010, this plan investment choice is rated as based on MyPlanIQ Plan Rating methodology that measures the effectiveness of a plan's available investment funds. It has the following detailed ratings:
Diversification -- Rated as (61%)
Fund Quality -- Rated as (60%)
Portfolio Building -- Rated as (96%)
Overall Rating: (75%)Current Economic and Market Conditions
We have experienced an uncertain 2010: plenty of worries on whether the US economy will climb out of the great recession and recover.
- The Federal Reserve embarked on Quantitative Easing II (QE2) to stimulate the economy.
- The housing market is still at its low but largely stabilized.
- The unemployment rate is stuck at 9%.
Americans continue to face an uncertain future, given (among others) the high unemployment rate, large federal and local government debts and global trade imbalance. With such an economic backdrop, the stock and debt markets are going to be volatile. Despite this, markets have been resilient and appear positioned to rebound.
In this market it is even more critical to properly diversify and respond market changes. MyPlanIQ offers two asset allocation strategies: strategic and tactical asset allocation strategies ( SAA and TAA for participants in AMERICAN EXPRESS RETIREMENT SAVINGS PLAN).
Strategic Asset Allocation is based on well known modern portfolio theory and its key features include: diversification, proper fund selection and periodically re-balancing.
Tactical Asset Allocation works on a diversified array of assets provided by funds in a plan and adjusts asset mixes based on market conditions such as asset price momentum utilized by TAA.
Portfolio Discussions
The chart and table below show the historical performance of moderate model portfolios employing strategic and tactical asset allocation strategies. For comparison purpose, we also include the moderate model portfolios of a typical 4 asset SIB (Simpler Is Better) plan . This SIB plan has the following candidate index funds and their ETFs equivalent:
US Equity: (SPY or VTI)
Foreign Equity: (EFA or VEU)
Emerging Market Equity: (EEM or VWO)
Fixed Income: (AGG or BND)
Performance chart (as of Dec 2, 2010)Performance table (as of Dec 2, 2010)
Portfolio Name 1Yr AR 1Yr Sharpe 3Yr AR 3Yr Sharpe 5Yr AR 5Yr Sharpe AMERICAN EXPRESS RETIREMENT SAVINGS PLAN Tactical Asset Allocation Moderate 5% 50% 10% 100% 14% 124% AMERICAN EXPRESS RETIREMENT SAVINGS PLAN Strategic Asset Allocation Moderate 13% 108% 3% 16% 9% 49% Four Core Asset ETF Index Funds Emerging Markets Tactical Asset Allocation Moderate 1% 6% 6% 49% 12% 78% Four Core Asset ETF Index Funds Emerging Markets Strategic Asset Allocation Moderate 10% 75% 2% 6% 7% 31% Currently, asset classes in US Equity (SPY,VTI), Foreign Equity (EFA,VEU), Emerging Market Equity (EEM,VWO) and Fixed Income (AGG,BND) are doing relatively well. These asset classes are available to AMERICAN EXPRESS RETIREMENT SAVINGS PLAN participants.
To summarize, AMERICAN EXPRESS RETIREMENT SAVINGS PLAN plan participants can achieve reasonable investment returns by adopting asset allocation strategies that are tailored to their risk profiles.
Symbols: AXP , SPY , VTI , EFA , VEU , EEM , VWO , AGG , BND , IVV , IYY , IWV , VV , DLN , RSP , SCHX , CIU , BIV , GWL , PFA , SCZ , EFV , PID , DWM , IJH , IWR , JKG , VO , MDY , EMM , PJG , DON , EZM , MVV , IJR , IWM , JKJ , VB , DSC , PJM , DES , SAA , UWM , SCHA , GMM , PXH , DEM , SCHE , CLY , LQD , BLV , VCLT
- Peabody Investments Corp.Employee Retirement Account Report On 12/03/2010
12/03/2010
- TD Ameritrade Commission Free ETFs Report On 12/07/2010
12/07/2010