|
News and Articles
-
Relax: Doing Less With Your Investments
03/30/2011
In his latest Behavior Gap Newsletter, Carl Richards nails that feeling of confusion that comes when we learn first hand that “past performance is not a guarantee of future results.”

Investing isn’t like hiring a basketball coach, Richards argues, but rather like planting an oak tree:“You never plant a tree and then pull it out every time the wind blows just to check the roots.”
He also quotes this gem from Warren Buffett: “Benign neglect, bordering on sloth, remains the hallmark of our investment process.”
Why We Should Do Less With our Investments
In his book Wise Investing Made Simpler Larry Swedroe makes a similar point using a study conducted by a trio of academics. Edwin J. Elton and Martin J. Gruber of New York University, and Christopher R. Blake of Fordham University, examined 43 401(k) plans from 1994 through 1999.
Over those five years, the 401(k) plans added 215 new fund options for participants and dropped 45 funds from their plans. The funds added had a strong track record. Those that were dropped had poor recent performance.
The professors soon discovered that the new funds promptly underperformed those that had been given the heave-ho.
That brought the overall quality of the offerings down. Making matters worse, participants in the plans constantly chased performance by shifting money into last quarter’s top performers, the study notes.
Give Your Money A Chance To Grow
The argument Richards, Swedroe, and others make is simple. Having put thought and effort into setting up their investments, investors need to give them a chance to grow. That doesn’t mean you can’t appreciate their beauty and even check in on their performance now and again, but successful long-term investing requires patience.
If you have ideas for setting the right balance between enlightened remove and dangerous neglect, chime in.
Symbols: SPY, VTI, IYR, VNQ, ICF, AGG, BND, DBC, IVV, IYY, IWV, VV, DLN, RSP, SCHX, CLY, LQD, BLV, VCLT, DGL, IAU, DBG, AGOL
comments(0)

-
Recent Calamities Don’t Slow Down US Equities But What’s Coming Next is Anybody’s Guess
03/30/2011
Catastrophic events in Japan left the world in shock, and brought an economic powerhouse to a temporary standstill seems to have had little impact on US equities as the immediate drama dies down. North Africa and the Middle East still have the possibility of exploding.
Despite everything, US growth appears to be still on track. Labor markets and last quarter’s GDP 3.1% shows the economy is moving in the right direction despite consumer sentiment being on the low side which is to be expected with current events.
US ASSETS CLASS RETURNS
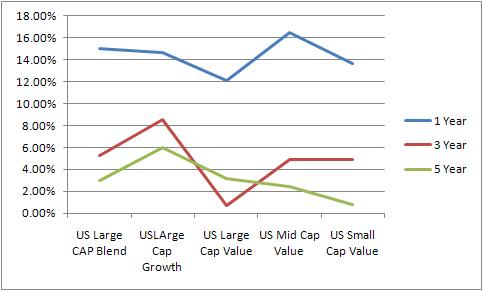
In US Equities, Large Cap Value is towards the bottom of the table as investors are looking for more risk with higher returns. However, in the light of current events and evidence of risk, large cap (safe) and value (higher return) may be an interesting compromise. Over the past five years US LARGE CAP GROWTH (ETF) has the highest 5 year returns and US MID CAP VALUE (ETF) the highest one year return.
|
Description
|
Symbol
|
1 Yr
|
3 Yr
|
5 Yr
|
1 Yr Sharpe
|
|
SPDR Dow Jones Industrial Aver
|
DIA
|
12.09%
|
0.73%
|
3.17%
|
72.34%
|
|
Vanguard Dividend Appreciation
|
VIG
|
11.54%
|
3.01%
|
NA
|
69.21%
|
|
Vanguard Value ETF
|
VTV
|
11.43%
|
-0.38%
|
1.43%
|
62.67%
|
|
iShares Dow Jones Select Divid
|
DVY
|
11.23%
|
-1.78%
|
-1.82%
|
73.78%
|
|
iShares Russell 1000 Value Ind
|
IWD
|
11.04%
|
-1.14%
|
0.29%
|
59.07%
|
|
iShares S&P 500 Value Index
|
IVE
|
10.73%
|
-1.73%
|
-0.29%
|
55.86%
|
|
SPDR S&P Dividend
|
SDY
|
8.88%
|
3.44%
|
2.12%
|
54.49%
|
This chart shows the top large cap value ETFs based on volume and return. Without sufficient volume, any ETF can suffer low liquidity or high trading friction.
The best performers in the US Large cap value stocks are:
1. SPDR Dow Jones Industrial Aver (DIA)
2. Vanguard Dividend Appreciation (VIG)
DIA is star performer in terms of return the 1 year returns are 12.09 % with an average volume of 7.8 million. The 5 year yields are also the highest at 3.17% giving us added confidence.
VIG is the second best perfomer with the return of 11.54% in year although the VIG is a new ETF being in market for less than 5 years the overall performance is very good the three year yields are 3%.
The large cap value ETF are those whose values are above that $10 billion, the size of these ETF’s give them the favourable advantage in the event of volatile period as these fund related investments are less riskier due to the change in terms of environmental factor.
Currently they are out of favour with those who are looking for return but in these days of increasing risk awareness, perhaps they will come back into fashion.
Disclosure:
MyPlanIQ does not have any business relationship with the company or companies mentioned in this article. It does not set up their retirement plans. The performance data of portfolios mentioned above are obtained through historical simulation and are hypothetical.
Symbols:DIA,DVY,IVE,IWD,SDY,VIG,VTV,SPY,VTI,
Symbols: (NYSE: DIA), (NYSE: DVY), (NYSE: IVE), (NYSE: IWD), (NYSE: SDY), (NYSE: VIG), (NYSE: VTV), (NYSE: SPY), (NYSE: VTI)
comments(0)
-
Currencies Snap Back -- Show Their True Colors
03/29/2011
One of the most glaring holes in our education system is retirement investing. Much is said about day trading and the high wire acts of Hedge Funds. Retirement investing is a long term proposition and is similar to looking after your health – do what is sensible and have occasional checkups that become more frequent as you age. We continue to look for areas of investment where we can find long term investment ideas that can give balance to a portfolio to increase risk adjusted returns.
We report on currencies movements by using representative ETF's to uncover whether there are possible longer term investments.
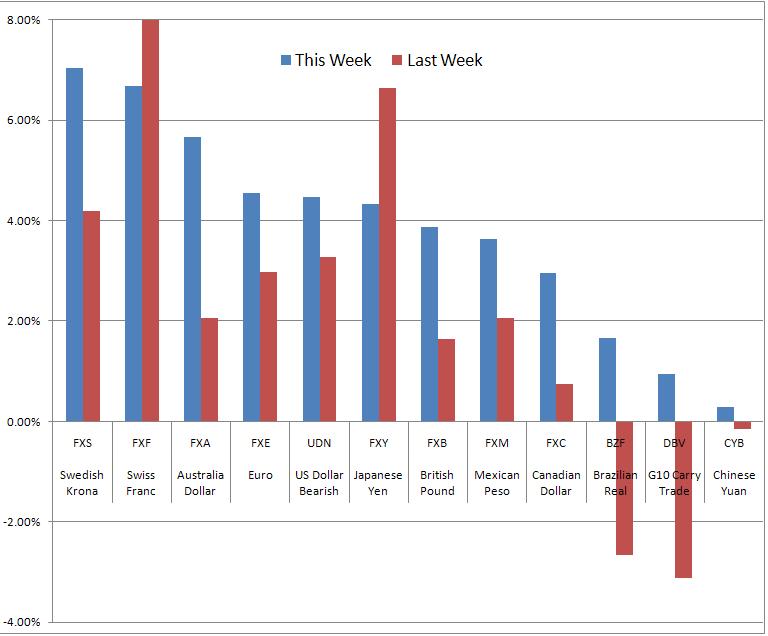
The trend score is defined as the average of 1,4,13,26 and 52 week total returns (including dividend reinvested).
We can see considerable volatility over the past two weeks.All currencies except the Japanese Yen is up this week. This is not a surprise as central banks are doing their best to keep the Yen down to help Japan in their current crisis. Currencies have been under pressure over the last couple of weeks and this is the start of a recovery.
Over the past few months, we have seen the Krona replace the Aussie Dollar at the top of the table -- but things were relatively stable. Over the last couple of weeks there was significant juggling of the order. The Swiss Franc jumped to the top of the list and the Yen, Dollar and Euro popped into the top half of the list, this week, we see the order return to its pre-crisis state.
Top and bottom notes:
- The Aussie Dollar and Swedish Krona have been impacted by the impact of the recent crisis -- oil prices and commodity prices are going to weigh on the Australian economy. The Swedish economy, while not closely tied to Europe will be impacted by oil prices and the worry of slower growth.
- The Swiss Franc is the currency that marches to the beat of its own drum in times of increased risk. It has clearly spiked as tension was heightened and is dropping as tension reduces.
- The Real and the Yuan are both good long term bets but continue to have a range of issues related to sovereign governance. Until they are sorted out, they are likely to remain at the bottom of the return table.
There is opportunity trading currencies for those with the intestinal fortitude. For those who have a longer term horizon, it is possible to consider adding the Swiss ETF in a portfolio to hedge against world crises.
Symbols: FXA, FXM, BZF, FXY, FXC, FXF, FXS, DBV, CYB, UDN, FXB, FXE
Symbols: (FXA),(FXM),(BZF),(FXY),(FXC),(FXF),(FXS),(DBV),(CYB),(UDN),(FXB),(FXE),
Disclosure:
MyPlanIQ does not have any business relationship with the company or companies mentioned in this article. It does not set up their retirement plans. The performance data of portfolios mentioned above are obtained through historical simulation and are hypothetical.
comments(0)
-
Will Harry Browne’s Permanent Portfolio Continue To Work?
03/29/2011
Portfolioist Article
March 25, 2011 by Geoff Considine
I just published an article over at Advisor Perspectives that is titled “What Investors Should Fear in The Permanent Portfolio” that looks at a very simple model portfolio proposed by Harry Browne. This portfolio contains equal allocations to four elements: stocks, gold, long-term government bonds and cash. Back in 1998 when Browne first proposed this portfolio in his book, Fail Safe Investing, it was decidedly harder to create your own version of this allocation model. Today, you can easily implement this portfolio at fairly low cost using four ETFs.
Harry Browne’s Permanent Portfolio has gotten a great deal of attention–and many new advocates–due to its solid performance in recent years when more traditional asset allocations suffered substantial losses. However, the question that investors need to ask is whether this will be a successful way to invest in the future.
I am not going to go through all of the analysis–but I will present three brief highlights here:
1) There is no question that the simple asset allocation in the Permanent Portfolio has done very well in the last decade and more.
2) The reliance on long-term bonds and gold has led to great performance but yields on long bonds are near historic lows and gold is near historic highs.
3) The Permanent Portfolio is not likely to fare well in a rising interest rate environment.
Ultimately, my conclusion is quite similar to that reached by William Bernstein, when he looked at this deceptively simple asset allocation. The statistics suggest that the Permanent Portfolio does indeed capture elements that will do well in a wide variety of market conditions. The danger for investors is piling into this strategy after a period that has been almost optimal for this approach vs. more conventional asset allocations. For many of the latecomers to the Permanent Portfolio, there is a substantial risk that they are chasing performance and are thus setting themselves up for much lower future returns.
Symbols: SPY,VTI,IYR,VNQ,ICF,AGG,BND,DBC,IVV,IYY,IWV,VV,DLN,RSP,SCHX,CLY,LQD,BLV,VCLT, DGL,IAU,DBG,AGOL,
Exchange Symbols:
comments(0)
-
Caterpillar's 401K Retirement Plan: Reasonable Investment Choices But Could Be More Systematic
03/28/2011
Caterpillar Inc. (CAT) manufactures and sells construction and mining equipment, diesel and natural gas engines, and industrial gas turbines worldwide. The company was formerly known as Caterpillar Tractor Co. and changed its name to Caterpillar Inc. in 1986. Caterpillar was founded in 1925 and is headquartered in Peoria, Illinois.
In this article, w report on Caterpillar Inc Investment Trust which is the master trust for Caterpillar's 401k plan.
The investment trust consists of 10 funds. These funds enable participants to gain exposure to 3 major assets: US Equity, Foreign Equity, Fixed Income.
The following table lists the asset classes those funds cover:
| Asset Class | Name |
| MID-CAP BLEND |
SPDR S&P MidCap 400 |
| LARGE BLEND |
iShares Russell 1000 Index |
| LARGE GROWTH |
iShares Russell 1000 Growth Index |
| LARGE VALUE |
iShares Russell 1000 Value Index |
| SMALL BLEND |
iShares Russell 2000 Index |
| LARGE BLEND |
iShares Russell 3000 Index |
| High Yield Bond |
JPMorgan High Yield Bond R5 |
| Emerging Markets Bond |
JPMorgan Emerging Mkts Debt R5 |
| Intermediate Bond |
JPMorgan Bond Instl |
| Foreign Large Blend |
Vanguard Total Intl Stock Index Inv |
| Asset Class | Number of funds |
| REITs |
0 |
| Balanced Fund |
0 |
| Fixed Income |
2 |
| Commodity |
0 |
| Sector Fund |
0 |
| Foreign Equity |
1 |
| Emerging Market Equity |
0 |
| US Equity |
6 |
| Other |
1 |
| Total |
10 |
As of Mar 25, 2011, this plan investment choice is rated as average based on MyPlanIQ Plan Rating methodology that was designed to measure how effective a plan's available investment funds are . It has the following detailed ratings:
Diversification -- Rated as below average (14%)
Fund Quality -- Rated as average (61%)
Portfolio Building -- Rated as average (60%)
Overall Rating: average (46%)
Discussions
The trust presents an interesting lineup of investment choices: in the U.S. equities, it covers large, mid-cap and small cap stocks. In large cap stocks, it further gives choices in growth and value styles. But it decides to give only mid-cap blend and small blend stock styles to the participants. For international equity, it has only one choice.
On the fixed income side, it is getting more interesting: in addition to a broad base bond index fund (JPMorgan Bond Instl), it gives a high yield (junk) bond fund and an emerging market bond fund, both are at the end of the highest risk spectrum among fixed income (bond) funds.
A natural question to ask is why only those two fixed income funds? How about fixed income funds in other categories such as investment grade corporate bond, long treasury bonds or international bonds. Maybe the reason behind this is that the bond index fund covers most of the short, intermediate term government and corporate bonds. Offering two highest risk bond funds would allow participants to increase their risk premiums.
Portfolio Discussions
The chart and table below show the historical performance of moderate model portfolios employing strategic and tactical asset allocation strategies. For comparison purpose, we also include the moderate model portfolios of a typical 3 asset SIB (Simpler Is Better) plan . This SIB plan has the following candidate index funds and their ETFs equivalent:
US Equity: SPY or VTI
Foreign Equity: EFA or VEU
Fixed Income: AGG or BND
Performance chart (as of Mar 25, 2011)
The following portfolios are constructed using two typical asset allocation strategies: Strategic Asset Allocation and Tactical Asset Allocation.
Strategic Asset Allocation is based on well known modern portfolio theory and its key features include: diversification, proper fund selection and periodically re-balancing.
Tactical Asset Allocation works on a diversified array of assets provided by funds in a plan and adjusts asset mixes based on market conditions such as asset price momentum utilized by TAA.

Performance table (as of Mar 25, 2011)
This plan's Strategic Asset Allocaton moderate portfolio matches the three asset benchmark's one in terms of returns. However, it does have higher Sharpe ratio, indicating the virtue of the US asset class choices and the extra fixed income funds.
The Tactical Asset Allocation moderate portfolio beats its three asset counterpart by a big margin. This again is due to more fund choices in US stocks and fixed income bonds.
Currently Commodities, US Equity and Real Estate are doing well. Only US Equity is available to Caterpillar Inc Investment Trust participants.
To summarize, Caterpillar Inc Investment Trust presents some reasonable investment choices. Some of major asset classes such as REITs and emerging market stocks are missing from the plan. Adding funds to allow exposure to these major assets would allow more diversification and more opportunities to enhance return while reducing risk.
Symbols:CAT,SPY,VTI,EFA,VEU,AGG,BND,HYG,JNK,PHB,CIU,BIV,GWL,PFA,IVE,IWW,JKF,VTV,ELV,PWV,RPV,SCHV,IVV,IYY,IWV,VV,DLN,RSP,SCHX,IVW,IWZ,JKE,VUG,ELG,QQQQ,RPG,SCHG,IJH,IWR,JKG,VO,MDY,EMM,PJG,DON,EZM,MVV,IJR,IWM,JKJ,VB,DSC,PJM,DES,SAA,UWM,SCHA,PCY,
Exchange Tickers: (CAT),(SPY),(VTI),(EFA),(VEU),(AGG),(BND),(HYG),(JNK),(PHB),(MDY),(IWM),(IWV),(IWW)
Disclosure:
MyPlanIQ does not have any business relationship with the company or companies mentioned in this article. It does not set up their retirement plans. The performance data of portfolios mentioned above are obtained through historical simulation and are hypothetical.
comments(0)
-
Glassman’s redemption: Find an investment safety net
03/26/2011
-
Accenture 401K Retirement Plan: High Quality and Low Cost Funds with Proper Diversification
03/25/2011
-
Tactically Manage An Income Producing Portfolio With Commodity Exposure
03/25/2011
-
Disney Offers Solid Stock Funds in Its 401K plan, But Can Expand Its Plan More Broadly
03/23/2011
-
Online Pioneer Amazon.com Can Expand Its 401K Plan for More Diversification
03/22/2011
-
Fund Advice Gives Sound Advice
03/22/2011
-
Japan’s Disasters Slams the Market – What Happens to REIT Now?
03/22/2011
-
Commodities Withstood the Recent Market Selloff
03/21/2011
-
Earthquakes and Wars Call for Diversification and Tactical Asset Allocation in Investing
03/20/2011
-
RWO, RWR Replace VNQ in the Six Asset Portfolio
03/20/2011
-
Swensen Six Asset Lazy Portfolio Review Exhibits Different Q1 Behavior
03/19/2011
-
Dividend Stock ETFs Somewhat Defensive But Not Enough to Withstand Market Stress
03/17/2011
-
What Do Japan and Libya Tell Us About Retirement Investing?
03/17/2011
-
Gold, US Equities, Long Term Treasuries and Cash Make For an Uncanny Portfolio
03/16/2011
-
Swensen Six Asset Lazy Portfolio Review
03/16/2011
First
1
2
3
4
5
6
7
8
9
10
11
12
13
14
15
16
Last
|
