|
News and Articles
-
Schwab ETF Select List Plan Offers Diversification and High Quality Fund Selection
03/16/2011
by Kevin Carr, A MyPlanIQ Expert User
On March 9, 2011, Charles Schwab announced the release of the ETF Select List. The quarterly Schwab ETF Select List was created by Charles Schwab Investment Advisory, Inc. and is a filtered list of all of the ETFs in the marketplace, highlighting pre-screened, low-cost ETFs. Schwab used quantitative and qualitative screens to filter each ETF and build the list, covering 6 major asset categories and 45 minor asset categories. All ETFs, including Schwab ETFs, are evaluated using the same criteria and broken into sectors for US Equity, Foreign Equity, Emerging Market Equity, Fixed Income, Commodity and REITs.
The ETF Select List gives investors a choice of low-cost, pre-screened ETFs. Schwab highlights just one ETF in each category, chosen based on specific criteria including expense ratio, risk, structure and how well it fits into its category. To make the list, an ETF has to meet minimum criteria that include assets under management, including narrowness of index, trading volume, bid/ask volatility, risk, annualized cost of ownership, fund structure and fit within a given category. The list excludes exchange-traded notes (ETNs), inverse or leveraged ETFs, actively managed ETFs, and unmanaged baskets of securities.
While the ETF Select List has only been out a few days, I constructed a plan on MyPlanIQ platform. The Schwab ETF Select List has no redemption periods, is commission efficient and offers low expenses.
As of March 13, the Schwab ETF Select List Plan has a four star investment menu rating with a 99% diversification score and an overall above average investment choice based on MyPlanIQ Plan Rating methodology . The Plan Rating methodology is designed to measure how effective a plan’s available funds are using key factors such as diversification, fund quality and portfolio building.
| Attribute | | Schwab ETF Select List | | Six Core Asset ETF Benchmark |
| Diversification |
|
great (99%) |
|
average (63%) |
| Fund Quality |
|
above average (70%) |
|
below average (23%) |
| Portfolio Building |
|
average (53%) |
|
above average (70%) |
| Overall Rating |
|
above average (72%) |
|
average (54%) |
The chart and table below show the historical performance of moderate model portfolios employing strategic and tactical asset allocation strategies (SAA and TAA , both provided by MyPlanIQ). For comparison purpose, we also include the moderate model portfolios of a typical 6 asset SIB (Simpler Is Better) plan . This SIB plan has the following candidate index funds and their ETFs equivalent:
US Equity: SPY or VTI
Commodity: DBC
Foreign Equity: EFA or VEU
REITs: IYR or VNQ or ICF
Emerging Market Equity: EEM or VWO
Fixed Income: AGG or BND
Performance chart (as of Mar 15, 2011)

Performance table (as of Mar 15, 2011)
Currently Commodities, Real Estate and US Equity are doing well. These asset classes are available to Schwab ETF Select List participants.
To Summarize, Schwab ETF Select List Plan offers wide diversification, high quality funds with low expenses. compared with other brokerage supported ETF plans, it is very favorable. From time to time, we will review the plan.
Symbols:DBC,DBA,IAU,DBB,USL,PFF,VNQ,XLY,XLP,XLE,XLF,XLV,XLI,XLB,XLK,IYZ,XLU,BND,SCHO,SCHR,TLH,SCHP,CIU,JNK,BWX,MUB,SCHF,EFG,EFV,SCHC,SCHE,VEU,VT,VGK,VPL,EWJ,GXC,SCHX,SCHG,SCHV,VO,VOT,VOE,SCHA,VBK,VBR,SCHB,VYM,
Symbols (exchange): (DBC),(DBA),(IAU),(DBB),(USL),(PFF),(VNQ),(XLY),(XLP),(XLE),(XLF),(XLV),(XLI),(XLB),(XLK),(IYZ),(XLU),(BND),(SCHO),(SCHR),(TLH),(SCHP),(CIU),(JNK),(BWX),(MUB),(SCHF),(EFG),(EFV),(SCHC),(
SCHE),(VEU),(VT),(VGK),(VPL),(EWJ),(GXC),(SCHX),(SCHG),(SCHV),(VO),(VOT),(VOE),(SCHA),(VBK),(VBR),(SCHB),(VYM)
comments(0)

-
'Safe' Assets' Trends Back to Positive: Risk Aversion Began?
03/14/2011
Risk assets' correction in last week was across the board: virtually all risk assets, other than US REITs (VNQ), turned up negative. Among them, both international stocks (EFA) and commodities (DBC) had the largest drops: both lost 3.09%. On the other hand, most 'safe' assets had a positive week. For more detailed performance for last week, please refer to here.
From the following table, one can see that other than municipal bonds (MUB), all of 'safe' fixed income assets now have positive trend scores, meaning their return behaviors are better than cash or short term treasury bill (SHV).
| Assets Class | Symbols | 03/11
Trend
Score | 03/04
Trend
Score | Direction |
| Commodities |
DBC |
12.94% |
16.8% |
v |
| Gold |
GLD |
9.46% |
9.66% |
v |
| US Stocks |
VTI |
8.03% |
10.61% |
v |
| US Equity REITs |
VNQ |
8.03% |
8.47% |
v |
| International REITs |
RWX |
6.89% |
9.33% |
v |
| Emerging Market Stks |
VWO |
4.64% |
7.17% |
v |
| US High Yield Bonds |
JNK |
4.13% |
4.99% |
v |
| International Treasury Bonds |
BWX |
4.04% |
3.49% |
^ |
| International Developed Stks |
EFA |
3.28% |
7.15% |
v |
| US Credit Bonds |
CFT |
1.71% |
1.09% |
^ |
| Emerging Mkt Bonds |
PCY |
1.18% |
0.29% |
^ |
| Intermediate Treasuries |
IEF |
1.16% |
-0.27% |
^ |
| Frontier Market Stks |
FRN |
1.01% |
2.22% |
v |
| Total US Bonds |
BND |
0.97% |
0.05% |
^ |
| Mortgage Back Bonds |
MBB |
0.12% |
-0.55% |
^ |
| Treasury Bills |
SHV |
0.05% |
0.01% |
^ |
| Municipal Bonds |
MUB |
-1.22% |
-1.24% |
^ |
The trend score is defined as the average of 1,4,13,26 and 52 week total returns (including dividend reinvested).
It is especially telling that the trend score of intermediate term treasury bonds (IEF) are now positive, ahead of frontier market stocks (FRN). Is this the beginning of a turn?
Fundamentally, stocks across the globe are not cheap. Based on Valueline, Capital IQ and Bloomberg data collected by Prof. Damodaran at NYU, as of January 2011, the world market valuation is as follows:
| |
Aggregate Market Cap/Aggregate Net Income |
| US |
27 |
| Europe |
20 |
| Emerging Market |
21.9 |
| Global |
23.1 |
By no means, the equity markets are cheap. In fact, Shiller's CAPE 10 for US stocks is currently at 24.4, compared with its long term average 16.4 (see more detailed info here). This is about 49% over valued!
Coupled with the recent relentless ascent in all risk asset prices, the markets are very prone to sharp gyration.
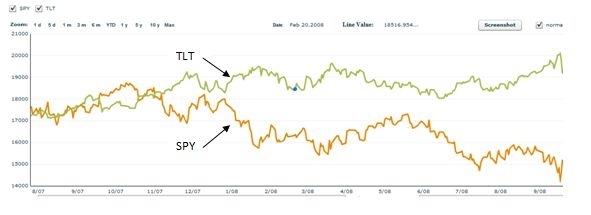
Fortunately, major stock market downturns were usually preceded by relative strong movements of other assets, especially 'safe' assets. For example, at the end of 2007, fixed income investors started to sense the danger in general economies, long term treasury bonds (TLT) started to show its strength in 8/2007. In fact, by the end of 2007, TLT has shown enough strength to be ahead of SPY. The following chart shows the total returns of both SPY and TLT between 2007 to 2008.

Nobody can predict the future and we don't know what will lie ahead this time. However, as long as one maintains a risk level that is suitable to his/her situations and adheres to a systematic way to properly allocate assets, one can withstand possible market shocks. Moreover, adopting a more active monitoring on major asset movements can be helpful to make tactical decision in risk asset exposures. For example, a tactical asset allocation strategy that uses major asset trends was effective in the last two major stock bear markets, based on historical simulation.
Though current situation does not warrant a dramatic change of asset allocations, investors with over allocated risk asset exposure should start to lighten up and get back to their normal risk level. It is a prudent way to avoid big loss in one's portfolios.
Symbols: EEM,VNQ,FRN,VWO,IYR,ICF,GLD,RWX,VTI,SPY,IWM,PCY,EMB,JNK,HYG,PHB,EFA,VEU,IEF,TLT,GSG,DBC,DBA,CFT,BWX,MBB,BND,MUB,SHV,AGG ,Symbols,(exchange), (NYSE,EEM),(NYSE,VNQ),(NYSE,FRN),(NYSE,VWO),(NYSE,IYR),(NYSE,ICF),(NYSE,GLD),(NYSE,RWX),(NYSE,VTI),(NYSE,SPY),(NYSE,IWM),(NYSE,PCY),(NYSE,EMB),(NYSE,JNK),(NYSE,HYG),(NYSE,PHB),(NYSE,EFA),(NYSE,VEU),(NYSE,IEF),(NYSE,TLT),(NYSE,GSG),(NYSE,DBC),(NYSE,DBA),(NYSE,CFT),(NYSE,BWX),(NYSE,MBB),(NYSE,BND),(NYSE,MUB),(NYSE,SHV),(NYSE,AGG),
Disclosure:
MyPlanIQ does not have any business relationship with the company or companies mentioned in this article. It does not set up their retirement plans. The performance data of portfolios mentioned above are obtained through historical simulation and are hypothetical.
comments(0)
-
Commodity Investing: Long Short (S&P Commodity Trend Indicators) vs. Long Only
03/13/2011
Last week's market volatility is a good reminder on how precarious it is in commodity investing. For the week, broadbase commodity index ETF (DBC) dropped 3.09% while Gold (GLD) fared better, dropping only 0.81%. Agriculture commodity (DBA) dropped even more: 3.71%. For more detailed information, please refer to here.
It is now generally recognized that adding commodity exposure in a long term portfolio that adopts a strategic asset allocation strategy can increase diversification effect and thus possibly improving risk adjusted returns. However, given the high volatitily (and risk) of commodities, it is important for an investor to understand the difference between a long only approach and long short approach in this asset investment.
A long only approach is simply just buying a commodity index such as Powershares DB Commodity Index ETF (DBC) or GSCI commodity index (GSG) (or sub index such as agriculture (DBA), precious metal (DBP)). A long short approach, on the other hand, can take long and/or short positions on mutliple commodity components simultaneously. It is mostly based on technical indicators such as moving averages, momentums and reversals. This approach has been adopted by professional CTAs (Commodity Trading Advisors). A simple and popular strategy is the S&P Diversified Commodity Trend Indicators. The following is a short description of the strategy:
The strategy is a simplified variation of S&P commodity trends indicator (CTI). It is a subset of the S&P DTI by simply eliminating half of the financial assets.
1.The original asset allocation
|
Energy 37.5%
|
Powershares DB Energy (DBE)
|
|
Industrial metal 10%
|
Powershares DB Base Metal (DBB)
|
|
Precious metal 10.5%
|
Powershares DB Precious Metal (DBP)
|
|
Agriculture 42%
|
Powershares DB Agriculture (DBA)
|
2. Position determination
The monthly percentage change of a sector’s price is compared to past monthly price changes exponentially weighted to give greatest weight to the most recent return and least weight to the return seven months prior.
The weights are as follows:
|
NUMBER OF MONTHS
|
WEIGHT
|
|
7
|
2.32%
|
|
6
|
3.71%
|
|
5
|
5.94%
|
|
4
|
9.51%
|
|
3
|
15.22%
|
|
2
|
24.34%
|
|
1
|
38.95%
|
3. Monthly rebalancing
The portfolio is rebalanced monthly by setting every sector to their original percentage and do the position determination again.
For more information, please refer to "Standard and Poor's Commodity Trend Indicator" document.
The following table compares the performance between such S&P Commodity Trend Indicators Portfolio (S&PCTI) and a general broadbase commodity ETF (DBC):
|
|
Portfolio
|
Last 3 Years
|
Last 1 Years
|
2007
|
2008
|
2009
|
2010
|
2011
|
| |
|
|
|
|
|
|
|
|
|
AR(%)
|
S&PCTI
|
5.049
|
14.884
|
15.939
|
23.768
|
2.282
|
3.186
|
5.148
|
|
AR(%)
|
DBC
|
-8.826
|
25.383
|
31.579
|
-31.799
|
16.187
|
10.154
|
7.695
|
|
Sharpe Ratio(%)
|
S&PCTI
|
29.127
|
113.142
|
91.832
|
107.569
|
14.048
|
23.723
|
39.12
|
|
Sharpe Ratio(%)
|
DBC
|
-20.516
|
150.174
|
160.984
|
-97.51
|
58.736
|
52.501
|
415.108
|
|
Standard Deviation(%)
|
S&PCTI
|
16.389
|
13.074
|
16.719
|
21.232
|
15.572
|
13.045
|
13.119
|
|
Standard Deviation(%)
|
DBC
|
27.914
|
18.435
|
17.728
|
34.962
|
27.397
|
19.578
|
15.275
|
Though S&PCTI under performed in 2009, 2010 and 2011, it out performed DBC in the last 3 years. This is because it had 23.8% return in 2008, compared with DBC's 31.6% loss in the same year. Furthermore, S&PCTI has a standard deviation 16%, compared with DBC's 28%. In fact, S&PCTI's standard deviation is consistent with that of an overall stock market index such as S&P 500 (SPY).
It is perhaps even more important to pay attention to maximum drawdowns for S&PCTI: since its inception 10/1/2007 (this is due to the short histories of commodity ETFs used in this portfolio), the maximum drawdown is about 19% vs. DBC's whopping 60% (during the 2008-2009 detacle).
The takeaway from this article is that for active investors, one might want to consider adopting a more conservative approach in commodity exposures. Investors can find Element's ETN (LSC) or Direxion's Commodity Trend Strategy Inv (DXCTX) that implement the S&P Commodity Trend Indicators strategy. Before you invest, however, you are encouraged to compare the portfolio S&PCTI, LSC and DXCTX.
In the follow up articles, we wil further compare how the long only and long short strategies can be used in strategic and tactical asset allocation portfolios.
Symbols:SLV,DBP,GLD,DBB,DBA,DBC,DBE,USO,UNG,SPY,
Symbols (exchange): (NYSE:SLV), (NYSE:DBP), (NYSE:GLD), (NYSE:DBB), (NYSE:DBA), (NYSE:DBC), (NYSE:DBE), (NYSE:USO), (NYSE:UNG), (NYSE:SPY)
Disclosure:
MyPlanIQ does not have any business relationship with the company or companies mentioned in this article. It does not set up their retirement plans. The performance data of portfolios mentioned above are obtained through historical simulation and are hypothetical
comments(0)
-
Finally Currencies React As Expected
03/11/2011
It has taken a few weeks but finally the currency ETFs are reacting as expected as the impact of increasing oil prices drive down currencies across the board.
The general consensus may be that this is a temporary effect and the cost of oil is an artifact of speculators as much as real supply and demand but one can only hold on to that for so long before bowing to the inevitable pressure.
| Assets Class | Symbols | 03/09
Trend
Score | 03/02
Trend
Score | Direction |
| Swedish Krona |
FXS |
7.57% |
8.52% |
v |
| Swiss Franc |
FXF |
6.32% |
7.26% |
v |
| Australia Dollar |
FXA |
5.56% |
7.23% |
v |
| Mexican Peso |
FXM |
4.83% |
3.72% |
^ |
| Canadian Dollar |
FXC |
4.07% |
4.42% |
v |
| US Dollar Bearish |
UDN |
3.53% |
3.67% |
v |
| Euro |
FXE |
3.46% |
3.22% |
^ |
| British Pound |
FXB |
3.0% |
3.87% |
v |
| Japanese Yen |
FXY |
2.05% |
2.65% |
v |
| G10 Carry Trade |
DBV |
1.73% |
2.41% |
v |
| Chinese Yuan |
CYB |
0.52% |
0.54% |
v |
| Brazilian Real |
BZF |
-1.61% |
-0.5% |
v |
The trend score is defined as the average of 1,4,13,26 and 52 week total returns (including dividend reinvested).
All of the top funds dropped significantly for the week although this isn't necessarily reflected in the economic conditions or the exchange rates.
There was not much news on the Krona. The Swedish economy continues to motor on and so the drop is purely based on world tensions.
The Swiss Franc rose against most currencies as it is continued to be a safe haven in these times of stress
The Aussie Dollar was not hit so much by the tension but by rising oil prices and China's trade deficit.

We note that the bottom currencies all had a better week than the top currencies as they march to the beat of a different drum.
We noted last week that the Chinese Government is in the midst of its annual people's congress and so not much will happen.
The Brazilian Real is still benefiting from increased interest rates and is less impacted by Libyan unrest
The G10 currencies current short positions in CHF, JPY, USD largely cancels out the long positions in AUD, NOK and NZD.
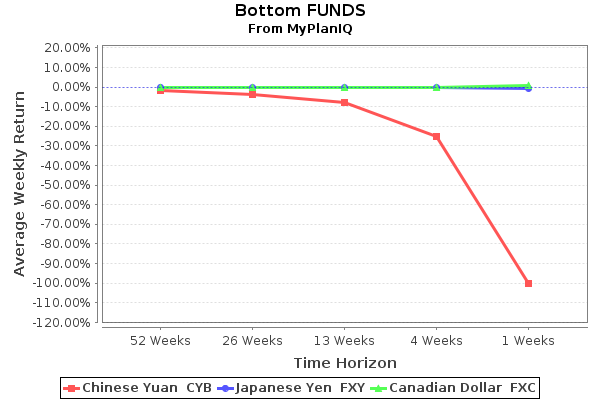
The turbulence was late in coming and it likely to only be a limited time effect. The Krona looks strong, the other top two are going to see some volatility. At the bottom, as we have said before, there is upside for the Yuan and the Real when government policies are seen as being in line with world expectations.
Symbols: (NYSE,FXA),(NYSE,FXM),(NYSE,BZF),(NYSE,FXY),(NYSE,FXC),(NYSE,FXF),(NYSE, ,FXS),(NYSE,DBV),(NYSE,CYB),(NYSE,UDN),(NYSE,FXB),(NYSE,FXE),
Disclosure:
MyPlanIQ does not have any business relationship with the company or companies mentioned in this article. It does not set up their retirement plans. The performance data of portfolios mentioned above are obtained through historical simulation and are hypothetical.
comments(0)
-
Starbucks Should Expand Its 401K Retirement Plan, Just As What It Did in Their Business
03/11/2011
Starbucks (NASDAQ:SBUX) recently celebrated its 40th year anniversary by giving out free petites. The company, established 40 years ago in Seattle, has expanded dramatically nation wide and the world wide. It has more than 15,000 stores in 50 countries, making it one of the premier roaster and retailer of specialty coffee in the world.
For its employees, Starbucks served Starbucks 401K Plan that consists of 9 funds. These funds enable participants to gain exposure to 3 major assets: US Equity, Foreign Equity, Fixed Income. The list of minor asset classes covered:
Foreign Large Blend: EFA, VEU, GWL, PFA
Intermediate-term Bond: AGG, CIU, BIV, BND
Large Blend: IVV, IYY, IWV, VTI, VV, SPY, DLN, RSP, SCHX
Large Growth: IVW, IWZ, JKE, VUG, ELG, QQQQ, RPG, SCHG
Small Blend: IJR, IWM, JKJ, VB, DSC, PJM, DES, SAA, UWM, SCHA
Small Growth: IJT, IWO, JKK, VBK, DSG, PWT, RZG, UKK
As of Mar 9, 2011, this plan investment choice is rated as below average based on MyPlanIQ Plan Rating methodology that was designed to measure how effective a plan's available investment funds are . It has the following detailed ratings:
Diversification -- Rated as below average (14%)
Fund Quality -- Rated as above average (75%)
Portfolio Building -- Rated as poor (5%)
Overall Rating: below average (29%)
The chart and table below show the historical performance of moderate model portfolios employing strategic and tactical asset allocation strategies (SAA and TAA , both provided by MyPlanIQ). For comparison purpose, we also include the moderate model portfolios of a typical 3 asset SIB (Simpler Is Better) plan . This SIB plan has the following candidate index funds and their ETFs equivalent:
US Equity: SPY or VTI
Foreign Equity: EFA or VEU
Fixed Income: AGG or BND
Performance chart (as of Mar 9, 2011)

Performance table (as of Mar 9, 2011)
The plan does consist of some good funds such as tAmerican Funds Fundamental Investor R4 (RFNEX). Its fund quality is actually ranked above average. In terms of its fund varieties, however, we would say Starbucks' 401K plan is lean and simple, maybe too simple even compared with its decaf coffee! There are only 9 funds in the plan, missing other major assets including emerging market stocks and real estate (REITs). In the fixed income side, a Dodge & Cox Income fund (DODIX) is the only choice, giving employees not much room to take advantage of various economic cycles.
For example, currently Commodities, US Equity and Real Estate are doing well. Only US Equity is available to Starbucks 401K Plan participants.
To summarize, Starbucks should expand its 401K plan to broaden its offerings, just like in its business expansion. Keeping its high quality funds and adding a few more covering some missing assets, as well as giving more choices in fixed income funds would certainly help to improve its participants' retirement accounts.
Disclosure:
MyPlanIQ does not have any business relationship with the company or companies mentioned in this article. It does not set up their retirement plans. The performance data of portfolios mentioned above are obtained through historical simulation and are hypothetical.
Symbols:SBUX,SPY,VTI,EFA,VEU,AGG,BND,CIU,BIV,GWL,PFA,IVV,IYY,IWV,VV,DLN,RSP,SCHX,IVW,IWZ,JKE,VUG,ELG,QQQQ,RPG,SCHG,IJR,IWM,JKJ,VB,DSC,PJM,DES,SAA,UWM,SCHA,IJT,IWO,JKK,VBK,DSG,PWT,RZG,UKK,
comments(0)
-
Which Fixed-income Sectors Are Good Inflation Hedges?
03/10/2011
-
NetApp's 401K: More Diversification and Better Quality Can Help
03/10/2011
-
Does Adding Three US Funds To A Simple Six Asset Portfolio Make a Difference?
03/10/2011
-
Small Caps Continue to Lead the Way Even as Libya Presses Down
03/10/2011
-
Riding High with Global Economy, International REITs Offer Currency and Inflation Hedge
03/10/2011
-
Schwab and Vanguard Small Cap ETFs Outperformed More Liquid iShares ETFs
03/09/2011
-
How Good Is The Six Asset ETF Benchmark Really?
03/09/2011
-
Managed Bond Funds Noticebly Strengthen Simple Six Asset Class Portfolios
03/09/2011
-
Commodities Brings Needed Inflation Protection for Vulnerable Retirement Portfolios
03/07/2011
-
Major Assets: Risk Assets Strong While Safe Assets Have Negative Trends
03/07/2011
-
Commodity ETFs: Does Everyone Need Energy Investment?
03/07/2011
-
Diversification to Five Classes Brings Further Benefits to Strained Retirement Portfolios
03/05/2011
-
Currencies All Jump Caution Advised
03/04/2011
-
US Equities ignore World Tension -- Go Marching On
03/04/2011
-
Dividend ETFs: Public REITs Offer Good Value While Economy Recovers
03/04/2011
First
1
2
3
4
5
6
7
8
9
10
11
12
13
14
15
16
Last
|