|
News and Articles
-
Credit Market ETFs: Improving Data Buoy Bonds; Municipal Bonds Remain Troubling
12/28/2010
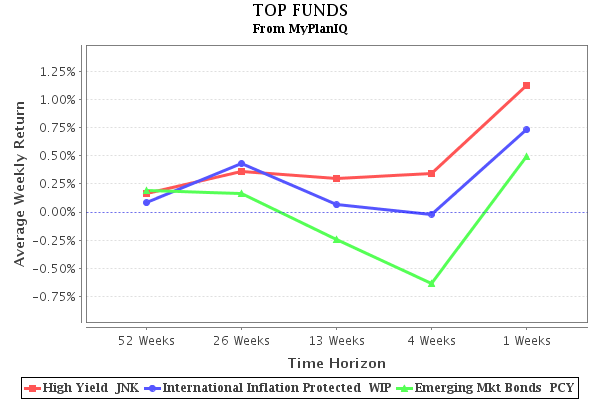
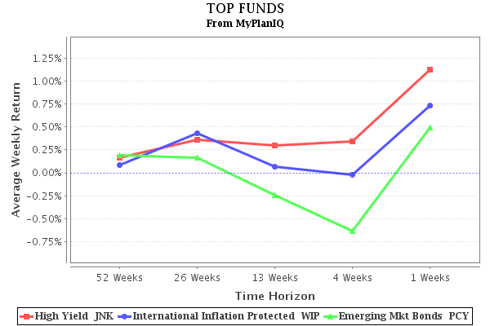
Sentiment in the credit market was lifted by encouraging economic data last week, but volume was low ahead of the holidays. Fixed-income driven portfolios (such as MyPlanIQ’s Momentum Bond Fund) started to stabilize in the second half of this year due to improving trends.
We make the following observations about last week's development:
- High-yield bonds (JNK) remained at the top spot thanks to shrinking risk premiums over government debt.
- International Inflation-Protected Bonds (WPI) continued to do well as inflation remains as a major concern in many developing countries.
- Investment-grade bonds (LQD) had a very thin trading volume last week, but investment-grade market has had a good run in 2010 on improving yields and corporate credit conditions. The trend is likely continue into 2011 given corporate earnings are expected to start stay strong.
- Emerging Market Debt (PCY) strengthened as growth is expected stay strong in emerging economies. Anchoring inflation expectation remains as a challenge as capital flow may put further inflationary pressures in these economies. Monetary policy and interest rate changes will be in focus in the near term in China and Brazil. This may cast a cloud over the equity markets.
- All medium to long-term U.S. government securities’ yields (TLH) (TLT) rose. This is expected as improving consumer spending data bolstered speculation that the economic recovery is gaining traction.
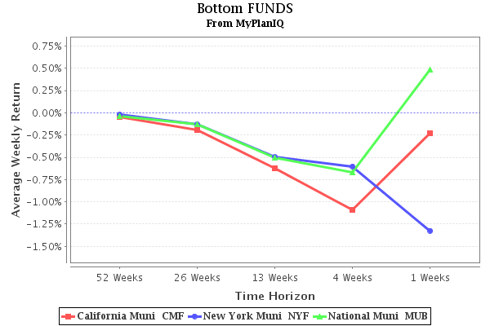
- Following the recent trend we have seen in the municipal bond market, the outlook for munis (MUB) (CMF) (NYF) remains tepid – states' fiscal problems may worsen in 2011 and put pressure on the Federal government to bail out struggling states to avoid defaults.
|
Assets Class
|
Symbols
|
12/24
Trend
Score
|
12/17
Trend
Score
|
Direction
|
|
High Yield
|
(JNK)
|
4.85%
|
3.86%
|
^
|
|
International Inflation Protected
|
(WIP)
|
3.37%
|
2.47%
|
^
|
|
Emerging Mkt Bonds
|
(PCY)
|
1.81%
|
1.04%
|
^
|
|
Long Term Credit
|
(LQD)
|
1.46%
|
1.33%
|
^
|
|
International Treasury
|
(BWX)
|
0.99%
|
0.77%
|
^
|
|
Intermediate Term Credit
|
(CIU)
|
0.72%
|
0.79%
|
v
|
|
Inflation Protected
|
(TIP)
|
0.65%
|
1.09%
|
v
|
|
Short Term Credit
|
(CSJ)
|
0.36%
|
0.57%
|
v
|
|
US Total Bond
|
(BND)
|
0.18%
|
0.06%
|
^
|
|
Short Term Treasury
|
(SHY)
|
0.17%
|
0.29%
|
v
|
|
Treasury Bills
|
(SHV)
|
0.01%
|
0.02%
|
v
|
|
Intermediate Treasury
|
(IEF)
|
-0.21%
|
0.09%
|
v
|
|
10-20Year Treasury
|
(TLH)
|
-1.0%
|
-0.73%
|
v
|
|
MBS Bond
|
(MBB)
|
-1.29%
|
-1.96%
|
^
|
|
20+ Year Treasury
|
(TLT)
|
-1.93%
|
-2.07%
|
^
|
|
National Muni
|
(MUB)
|
-2.78%
|
-2.01%
|
v
|
|
New York Muni
|
(NYF)
|
-2.97%
|
-1.43%
|
v
|
|
California Muni
|
(CMF)
|
-4.03%
|
-3.39%
|
v
|
labels:investment,
Symbols:AGG,BND,SHV,SHY,IEF,TLH,TLT,TIP,WIP,HYG,JNK,PHB,CSJ,CIU,LQD,BWX,CMF,NYF,MUB,MBB,PCY,EMB,
comments(0)

-
Major Asset Movements Muted, Bonds Continue to Stabilize
12/27/2010
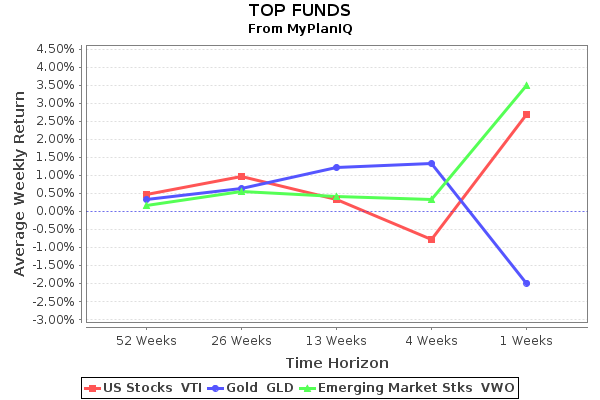
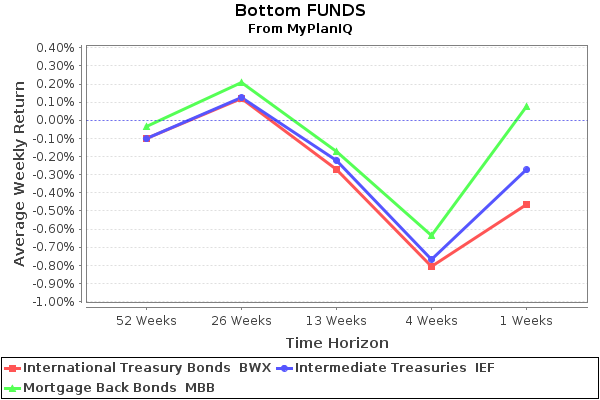
Last week, investors took a vacation: major asset movements were subdued while bonds continued to show signs of life: other than emerging market bonds (PCY or EMB), all bond sub-assets registered positive gains.
It is noteworthy to point out that U.S. stocks (VTI or SPY) and commodities (GSG or DBC) have been very strong; they were the only two risk assets that had positive returns last week. In addition, U.S. high yield (junk) bonds continued to recoup their losses and were consistent with the risk chasing attitude investors have shown recently. Municipal and mortgage back bonds were still at negative trend territory, showing a downtrend that was worse than cash (SHV or short term treasury bills).
All in all, it was a quiet week and investors enjoyed their long awaited holidays.
| Assets Class | Symbols | 12/23
Trend
Score | 12/10
Trend
Score | Direction |
| Frontier Market Stks |
(FRN) |
12.32% |
13.93% |
v |
| International REITs |
(RWX) |
9.7% |
10.35% |
v |
| US Stocks |
(VTI) |
9.41% |
10.21% |
v |
| Commodities |
(GSG) |
9.08% |
8.74% |
^ |
| Emerging Market Stks |
(VWO) |
8.86% |
9.64% |
v |
| Gold |
(GLD) |
8.16% |
9.46% |
v |
| US Equity REITs |
(VNQ) |
6.24% |
7.67% |
v |
| International Developed Stks |
(EFA) |
5.32% |
6.51% |
v |
| US High Yield Bonds |
(JNK) |
3.86% |
4.33% |
v |
| US Credit Bonds |
(CFT) |
1.1% |
0.72% |
^ |
| Emerging Mkt Bonds |
(PCY) |
1.04% |
2.82% |
v |
| International Treasury Bonds |
(BWX) |
0.77% |
0.54% |
^ |
| Intermediate Treasuries |
(IEF) |
0.09% |
-0.73% |
^ |
| Total US Bonds |
(BND) |
0.06% |
-0.19% |
^ |
| Treasury Bills |
(SHV) |
0.02% |
0.03% |
v |
| Mortgage Back Bonds |
(MBB) |
-1.96% |
-1.71% |
v |
| Municipal Bonds |
(MUB) |
-2.01% |
-3.5% |
^ |
click to enlarge
labels:investment,
Symbols:AGG,BND,BWX,CFT,DBA,DBC,EEM,EFA,EMB,FRN,GLD,GSG,HYG,ICF,IEF,IWM,IYR,JNK,MBB,MUB,PCY,PHB,RWX,SHV,SPY,TLT,VEU,VNQ,VTI,VWO,
comments(0)
-
Top Currencies Up Again; Weaker Currencies Falter
12/25/2010
We track trends in multiple categories using ETFs.
This week currencies are a mixed bag. The top currencies continue to strengthen and the bottom currencies continue to weaken.
| Assets Class | Symbols | 12/22
Trend
Score | 12/15
Trend
Score | Direction |
| Australia Dollar |
(FXA) |
8.2% |
6.79% |
^ |
| Swiss Franc |
(FXF) |
6.92% |
6.27% |
^ |
| Swedish Krona |
(FXS) |
4.04% |
4.66% |
v |
| Japanese Yen |
(FXY) |
3.71% |
2.9% |
^ |
| Mexican Peso |
(FXM) |
2.91% |
1.35% |
^ |
| Canadian Dollar |
(FXC) |
1.17% |
2.46% |
v |
| G10 Carry Trade |
(DBV) |
0.5% |
0.36% |
^ |
| US Dollar Bearish |
(UDN) |
0.01% |
0.62% |
v |
| Chinese Yuan |
(CYB) |
-0.43% |
0.71% |
v |
| British Pound |
(FXB) |
-1.3% |
-0.89% |
v |
| Euro |
(FXE) |
-1.45% |
-0.55% |
v |
| Brazilian Real |
(BZF) |
-6.62% |
4.4% |
v |
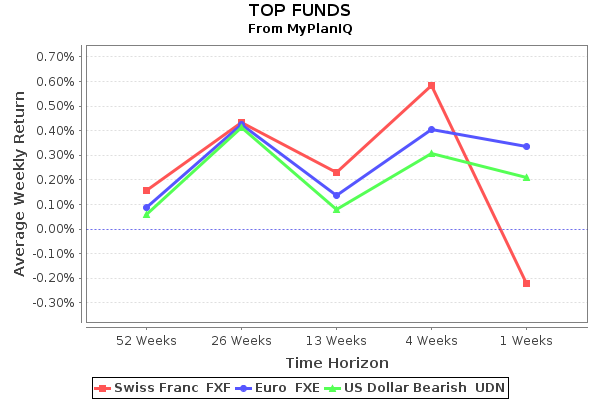
The Australian Dollar continues to benefit from China's economy and continued strength in the economy.
The Swiss Franc continues to be a European currency of refuge against the Euro.
Although the Swedish Krona dropped this week, it is still a preferred currency and remains in the top three.
click on charts to enlarge
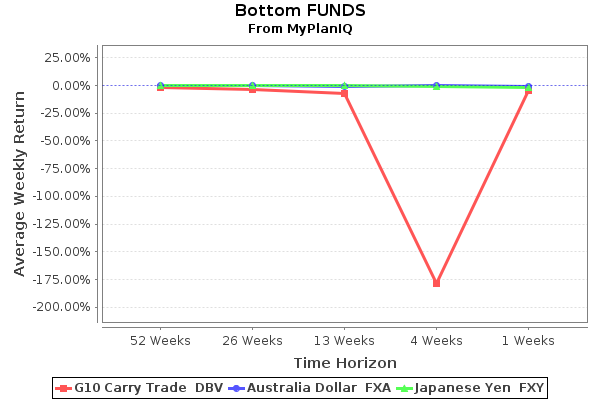
The Brazilian Real has dropped precipitously and moved from the top half to the bottom of the table. The Real has been volatile and this is a reality with the emerging market currencies.
The Euro and British pound continue to be weighed down by their sovereign debt along with low interest rates.
The strong currencies continue to do well and the weaker ones continue to languish.
labels:investment,
Symbols:BZF,CYB,DBV,FXA,FXB,FXC,FXE,FXF,FXM,FXS,FXY,UDN,
comments(0)
-
International REITs Outshine Among Dividend ETFs
12/25/2010
In this holiday season, dividend ETFs continue their strong performance, especially U.S. dividend ETFs such as PEY, VIG, DVY. In our previous articles, we pointed out this trend. More detailed asset class performance trend can be found on this Market View page.
Though foreign dividend ETFs (including emerging market stocks) have lagged behind their U.S. counterparts, the international REI (RWX) has inched up in the past month to become the best performer. The U.S. REIT (IYR) have been consolidating after strong performance earlier this year. Both ETFs have about similar annual dividend yield (3.46% and 3.48% respectively).
Preferred stocks (PFF) have been mistreated as their fixed income (bond) cousin: it has been on the bottom for more than a month now. One, however, can make an observation that if U.S. stocks continue their strong performance, preferred stocks should perform well while in the meantime, their fat dividends should provide cushion to the eventual next shock to the markets.
| Assets Class | Symbols | 12/22
Trend
Score | 12/15
Trend
Score | Direction |
| SPDR DJ Wilshire Intl Real Estate |
RWX |
11.62% |
10.05% |
^ |
| PowerShares HighYield Dividend Achievers |
PEY |
10.95% |
9.37% |
^ |
| SPDR S&P 500 |
SPY |
9.81% |
8.19% |
^ |
| Vanguard Dividend Appreciation |
VIG |
9.3% |
8.14% |
^ |
| Vanguard High Dividend Yield Indx |
VYM |
9.06% |
7.89% |
^ |
| iShares Dow Jones Select Dividend Index |
DVY |
8.6% |
7.03% |
^ |
| iShares Dow Jones US Real Estate |
IYR |
8.43% |
4.36% |
^ |
| iShares MSCI Emerging Markets Index |
EEM |
8.33% |
7.16% |
^ |
| SPDR S&P Dividend |
SDY |
7.98% |
6.89% |
^ |
| PowerShares Intl Dividend Achievers |
PID |
7.45% |
6.73% |
^ |
| First Trust Value Line Dividend Index |
FVD |
7.43% |
6.98% |
^ |
| iShares Dow Jones Intl Select Div Idx |
IDV |
6.6% |
6.05% |
^ |
| iShares MSCI EAFE Index |
EFA |
6.01% |
5.29% |
^ |
| iShares S&P U.S. Preferred Stock Index |
PFF |
3.36% |
3.91% |
v |


labels:investment,
Symbols:IYR,PFF,RWX,
comments(0)
-
Smart Money Trend: Capital Preservation Driving Market Flows
12/23/2010
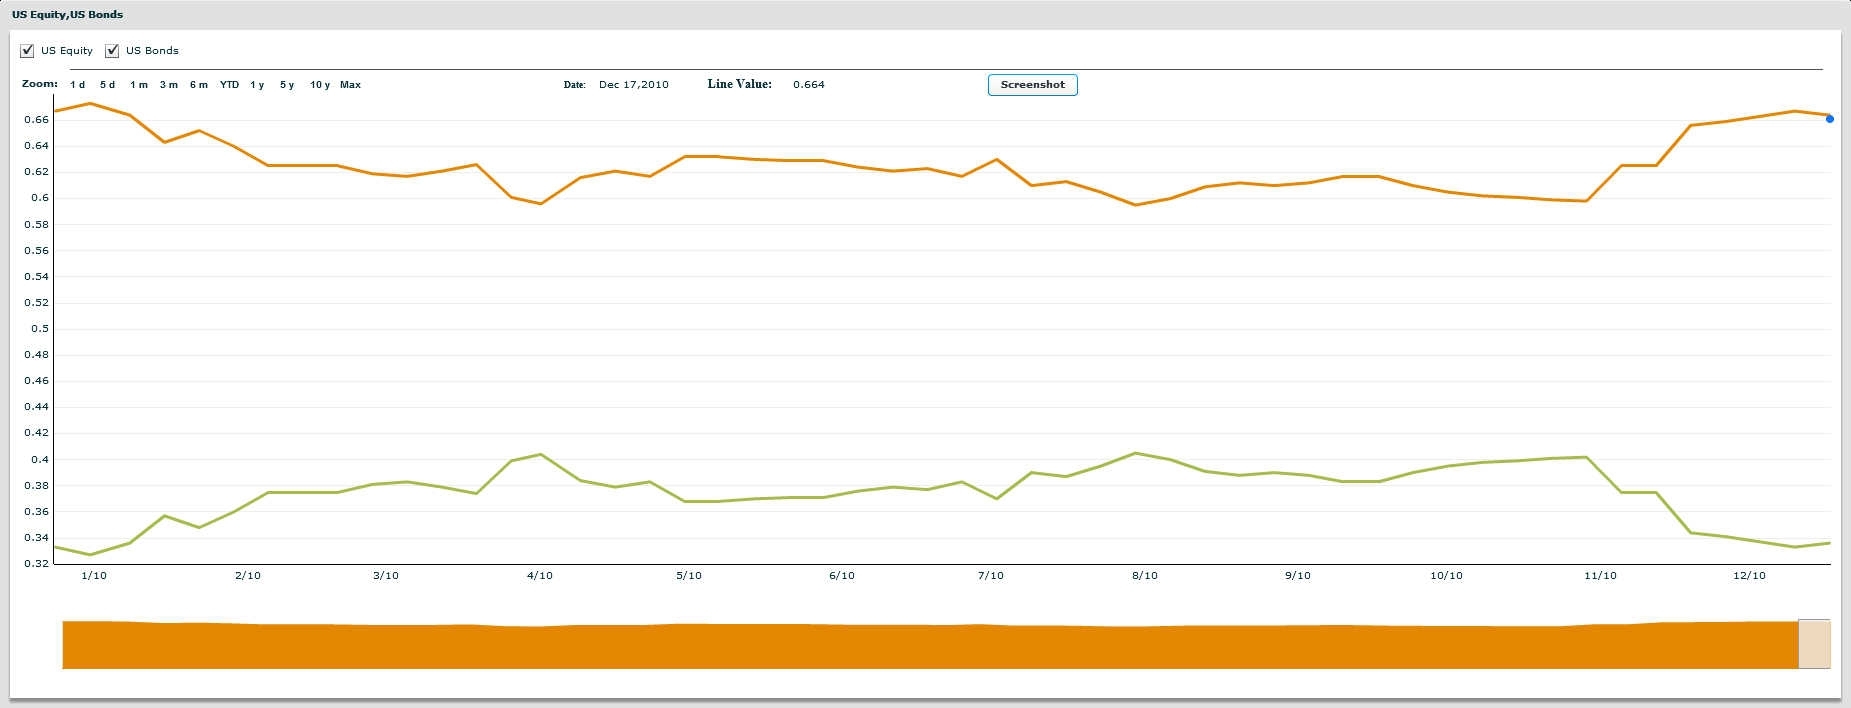
Monitoring where asset allocation funds are putting their money gives an indication of whether fund managers are being more conservative or aggressive this week. MyPlanIQ's smart money indicator is derived based on comprehensive analysis of top asset allocation Gurus' recent asset exposure. Currently, it tracks the aggregate asset exposure to U.S. equities and bonds.
We track two separate indicators:
- Top 3 Moderate Allocation Funds (Smart Money)
- 481 Moderate Asset Allocation Mutual Funds (Pro Money)
This is calculated weekly and covers the last one year. For the week ending 12/10/2010, our proprietary model reported the equity exposure of the Top 3 Funds was 50.4% and 66.4% for the 481 Moderate Asset Allocation Mutual Funds.
Trends for the Top 3 Moderate Allocation Funds (Smart Money)
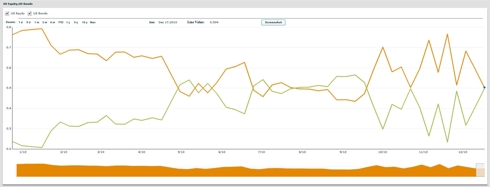
481 Moderate Asset Allocation Mutual Funds (Pro Money)

Two weeks ago, we saw that falling bond values have caused investors to build up an overweight in equities. This past week, money managers were again tweaking asset allocations to the benefit of the perceived safety of fixed income and lowered their equity exposure. We believe the underlying economic force shaping this decrease in the appetite for risky assets has been the desire for capital preservation near year end with no long-term implication.
That said, a more pessimistic but objective view offered by John Hussman paints an alarming picture on the current markets: he characterizes the current states of the markets as "overvalued, overbought, overbullish, rising-yields" and the usual large losses followed.
labels:investment,
Symbols:AGG,BBND,CIU,EEM,EFA,GSG,HYG,ICFI,IEF,IWM,IYR,JNK,MBB,MDY,MUB,PHB,QQQQ,SHV,SHY,SPY,TLT,VEU,VNQ,VWO,
comments(0)
-
Country ETFs Trend: Global Markets Remain Mixed, weighed by Korean Tensions and Europe Debt Concerns
12/22/2010
-
Shiller Index Close to Triggering a Move to Bonds
12/22/2010
-
ETF Outlook on Emerging Market Debt and Muni Bond Turbulence in 2011
12/21/2010
-
Major Asset Trends: Municipal and Other Bonds Recover Some, Commodities Strong
12/20/2010
-
American Electric
12/19/2010
-
U.S. Sectors Trend: Cautious Gains Amid Mixed Catalyst
12/19/2010
-
Silver and Gold Continued to Shine While Other Commodities Largely Stable
12/19/2010
-
Goldman Sachs Tactical Strategy Examined With Fewer ETFs in the Portfolio
12/17/2010
-
Yield Quest Turns from Bonds to High Yield Stocks
12/16/2010
-
Smart Money Trend: Stocks May be Winners of Bond Turbulence
12/16/2010
-
Currencies Up Again, With the Exception of the Yuan
12/16/2010
-
Goldman Sachs Momentum Portfolio Examined and Cloned
12/15/2010
-
Global Markets Largely Flat
12/14/2010
-
Samsung's Excellent 401K Plan, Pushes the ETF Benchmark Hard
12/14/2010
-
Credit Market Trends: Upbeat Data Adds to Pressure on Treasuries
12/14/2010
First
1
2
3
4
5
6
7
8
9
10
11
12
13
14
15
16
Last
|