|
News and Articles
-
The Buffett Ratio (Market Value to GNP) Increases
12/14/2010
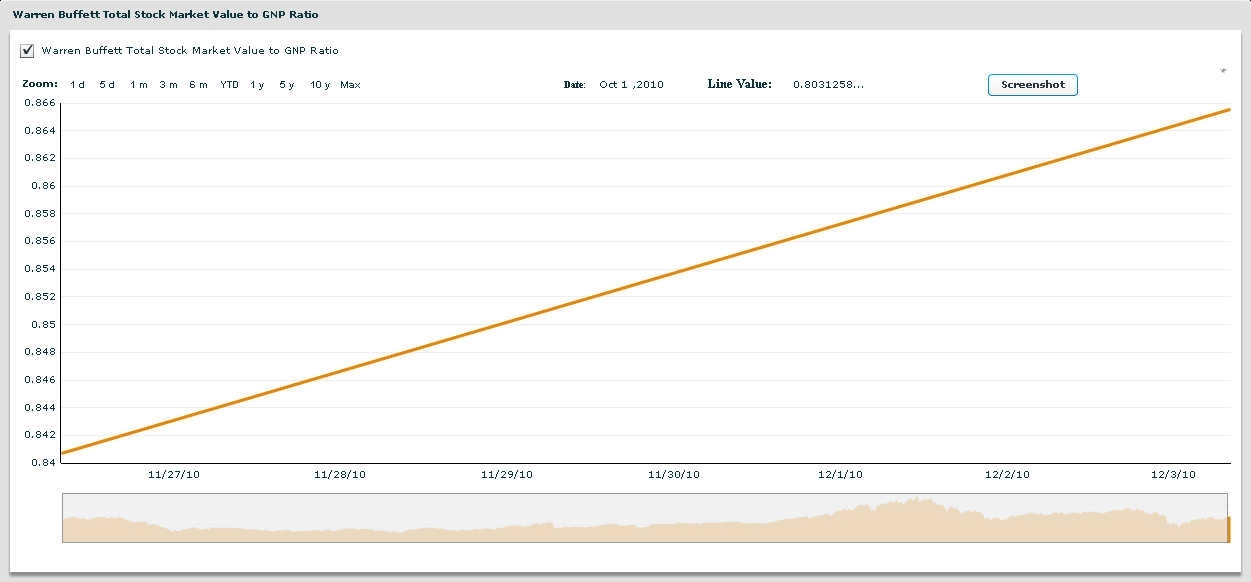
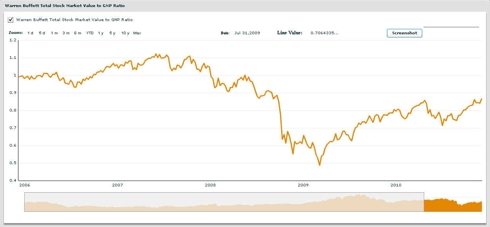
Warren Buffett created a ratio of the market value of all US publicly traded securities to Gross National Product (GNP) as a yardstick to measure stock market valuation
MyPlanIQ has been tracking this index and presents the current status. This will be reported every other week (bi-weekly)
On Dec 10, 2010, the ratio of the total stock market capitalization to GNP was 88%.
This compares to November 26, 2010, when the ratio was 84% which is in the fair market range.
click to enlarge images
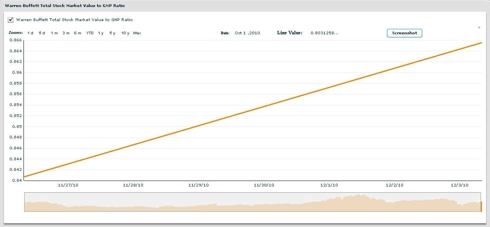
The trend is clearly increasing as the appetite for equities remain -- especially in light of fixed income assets having a poor outlook.
The valuations are still in the fair market region, which would point to a continuing increase in the value of equities in the short term.
labels:investment,
Symbols:AGG,BND,CIU,CSJ,DBA,DBC,EEM,EFA,GSG,HYG,ICF,IEF,IWM,IYR,JNK,LQD,MBB,MDY,MUB,PHB,QQQQ,SHV,SHY,SPY,TLT,USO,VEU,VNQ,VWO,
comments(0)

-
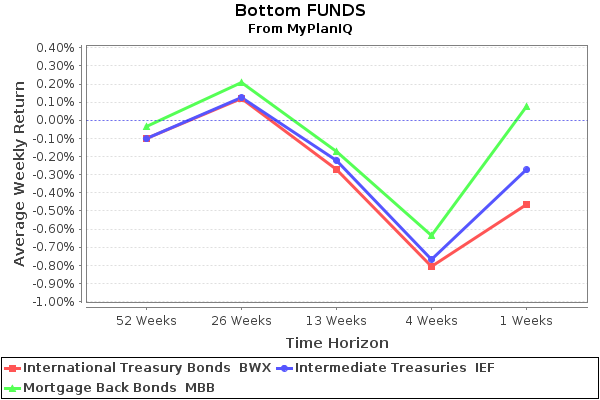
U.S. Stocks Strong; Other Bond Markets Continue to Slump
12/13/2010
Last week, we continued to observe major weakness in fixed income markets. From our Market View, one can see that most bond ETFs underwent 1-2% loss. Municipal bonds and intermediate term treasuries were the biggest losers. Municipal bonds were avoided due to the concerns on the dire financial situations of state and local governments, let alone the extreme low yields to begin with. Investors were also worried about longer term bonds, including treasuries and corporate bonds based on inflation outlook.
Based on the major asset price trends in the following table, other noticeable developments include:
- US Stocks were very strong, now placed in the third spot among all other major asset classes.
- US REITs continued their weakness, losing 1.3% last week and were out of top five spots.
- all fixed income asset classes were at the bottom of the ranking: the lower the perceived risks based on conventional wisdom, the lower their rankings were.
- Broad base commodities were relatively intact while gold continued its correction.
| Assets Class | Symbols | 12/10
Trend
Score | 12/03
Trend
Score | Direction |
| Frontier Market Stks |
(FRN) |
13.93% |
13.33% |
^ |
| International REITs |
(RWX) |
10.35% |
10.73% |
v |
| US Stocks |
(VTI) |
10.21% |
9.57% |
^ |
| Emerging Market Stks |
(VWO) |
9.64% |
11.67% |
v |
| Gold |
(GLD) |
9.46% |
11.1% |
v |
| Commodities |
(GSG) |
8.74% |
10.22% |
v |
| US Equity REITs |
(VNQ) |
7.67% |
9.21% |
v |
| International Developed Stks |
(EFA) |
6.51% |
6.94% |
v |
| US High Yield Bonds |
(JNK) |
4.33% |
4.81% |
v |
| Emerging Mkt Bonds |
(PCY) |
2.82% |
3.14% |
v |
| US Credit Bonds |
(CFT) |
0.72% |
0.94% |
v |
| International Treasury Bonds |
(BWX) |
0.54% |
0.98% |
v |
| Treasury Bills |
(SHV) |
0.03% |
0.03% |
v |
| Total US Bonds |
(BND) |
-0.19% |
0.59% |
v |
| Intermediate Treasuries |
(IEF) |
-0.73% |
1.03% |
v |
| Mortgage Back Bonds |
(MBB) |
-1.71% |
-1.8% |
^ |
| Municipal Bonds |
(MUB) |
-3.5% |
-1.81% |
v |
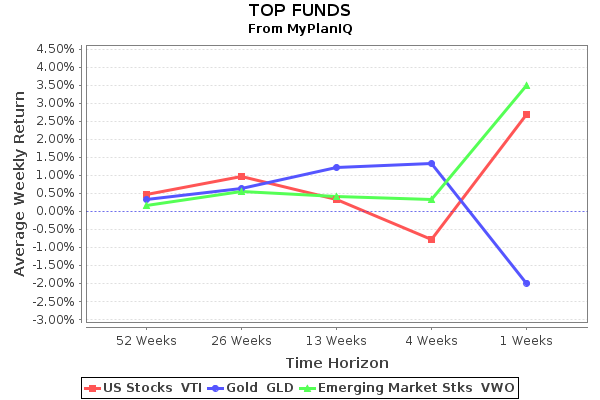
The takeaway is that investors continued their strong risk appetite. Among risk assets, US stocks stood out as worries in European debt markets and inflation pressure in emerging markets dampened demands on those assets.
labels:investment,
Symbols:AGG,BND,BWX,CFT,DBA,DBC,EEM,EFA,EMB,FRN,GLD,GSG,HYG,ICF,IEF,IWM,IYR,JNK,MBB,MDY,MUB,PCY,PHB,QQQQ,RWX,SHV,SLV,SPY,TLT,VEU,VNQ,VTI,VWO,
comments(0)
-
U.S. Sectors Up on Economic Hopes
12/11/2010
U.S. sectors provide insight into the parts of the US economy that are flourishing or floundering. It plays an important role in asset allocation strategy such as MyPlanIQ Tactical Asset Allocation. MyPlanIQ tracks detailed weekly U.S. sectors trend movements. We use ETFs that represent each sector and present the results here. More details can be found in MyPlanIQ 360 Degree Market View.
|
Asset Class
|
Symbols
|
12/08
Trend
Score
|
12/01
Trend
Score
|
Direction
|
|
Energy
|
(XLE)
|
15.39%
|
13.95%
|
^
|
|
Consumer Discretionary
|
(XLY)
|
14.38%
|
12.9%
|
^
|
|
Industrials
|
(XLI)
|
13.36%
|
11.29%
|
^
|
|
Materials
|
(XLB)
|
12.73%
|
10.52%
|
^
|
|
Technology
|
(XLK)
|
10.47%
|
7.77%
|
^
|
|
Telecom
|
(IYZ)
|
9.55%
|
7.74%
|
^
|
|
Financial
|
(XLF)
|
6.34%
|
1.32%
|
^
|
|
Consumer Staples
|
(XLP)
|
6.33%
|
5.05%
|
^
|
|
Healthcare
|
(XLV)
|
3.84%
|
2.96%
|
^
|
|
Utilities
|
(XLU)
|
2.05%
|
2.71%
|
v
|
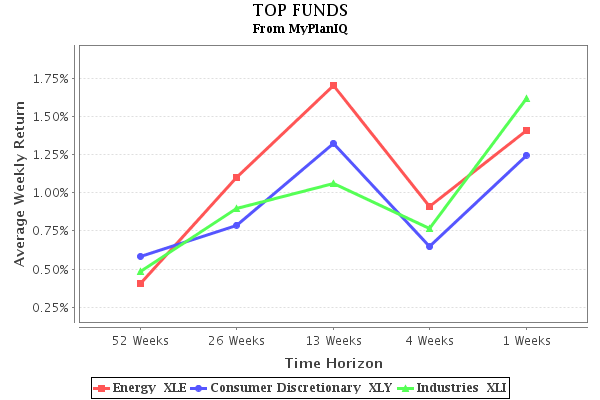
Top Three Indicators
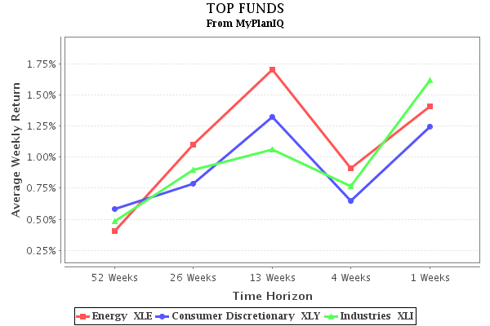
U.S. sectors rallied in the week ended on 12/8, helped by a stream of positive economic news.
The Consumer Select Sector SPDR Fund (XLY) should be a barometer of the strength of U.S. consumer throughout the holiday season. Thanks to encouraging reads on consumer spending in the holiday shopping season, sentiment on the retail sector has been bullish recently. The extension of the Bush-era tax cut is expected to add to the positive tone in the retail markets and companies with exposure to consumers stand to benefit. Against this favorable backdrop, (XLY) makes an attractive momentum play.
Energy Sector SPDR Fund (XLE) topped our table with the highest trend score of 15.39%. The ETF benefited from a sharp fall in U.S. energy inventories which pushed oil prices higher and a pick-up in demand for oil across the globe as economic activity increases. Outlook remains positive - oil prices to break the psychologically important level of 90 dollars per barrel is expected by the end of 2010. With huge buying in the oil sector, (XLE) appears ready to rise higher.
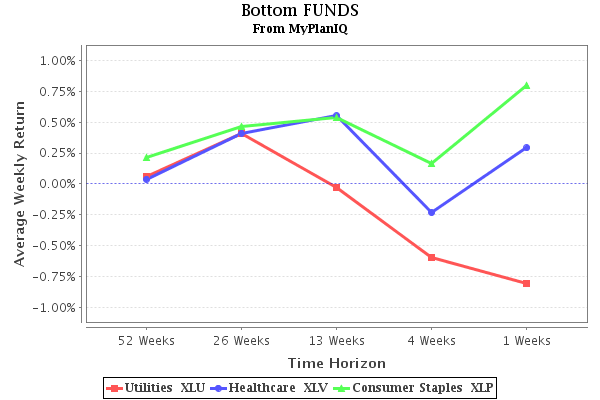
Bottom Three Indicators
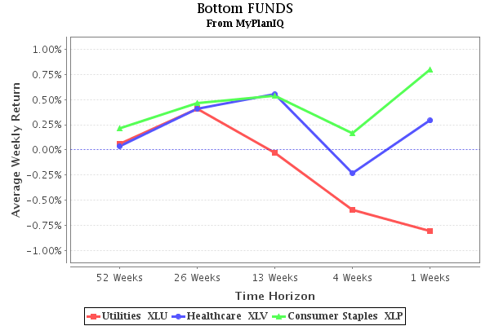
Government data show spending on health care continuing to rise and the healthcare sector also benefited from the better market environment. (XLV) rose in the week ended on 12/8 with a modest weekly gain of 0.29%. Upward momentum could continue in the healthcare sector as it becomes a focus for buyout activities with the increasing numbers of deals announced lately.
The utilities sector was the only sector to end in red. Utilities Select Sector SPDR Fund (XLU) registered a weekly loss of 0.75%, continuing its recent downward trend. As we get more news pointing to an uptick in economic data and economic recovery to gain steam in 2011, defensive stalwarts such as the utilities sector might underperform and lag behind sectors such as consumer discretionary (XLY) and materials (XLB) that have traditionally done well during the upswing of the economic cycle.
labels:investment,
Symbols:XLY,IYZ,XLI,XLB,XLK,XLE,XLF,XLP,XLU,XLV,SPY,QQQQ,IWM,MDY,EFA,VEU,EEM,VWO,IYR,ICF,VNQ,GSG,DBC,DBA,USO,LQD,CSJ,CIU,HYG,JNK,PHB,TLT,IEF,SHY,SHV,BND,AGG,MUB,MBB,
comments(0)
-
Broad Based Commodities Strong, Precious Metals Continue Correction
12/11/2010
Last week, precious metals (DBP) (SLV) (GLD) were under selling pressure. Given their strong performance in the past several months, this isn't unexpected. This coincided with the price loss of long term bonds (treasury and investment grade corporate) - an unusual correlation. In a bigger context, we view these as normal corrections. For more information, please visit MyPlanIQ 360 Degree Market View.
Agriculture commodities (DBA) have been going up steadily. Industrial base metals were also strong. Energy markets had a big recovery last week, especially for natural gas (UNG). All these boded well with general rising stock markets (especially the U.S. stocks).
As a result, broad based commodities (DBC, GSG) are doing well, continuing their up trend.
| Assets Class | Symbols | 12/08
Trend
Score | 12/01
Trend
Score | Direction |
| Silver |
SLV |
32.56% |
33.3% |
v |
| Agriculture |
DBA |
12.54% |
10.55% |
^ |
| Precious Metals |
DBP |
12.32% |
12.65% |
v |
| Base Metals |
DBB |
10.09% |
5.97% |
^ |
| Commodity |
DBC |
9.76% |
8.02% |
^ |
| Gold |
GLD |
8.21% |
8.33% |
v |
| US Oil |
USO |
6.8% |
4.62% |
^ |
| Energy |
DBE |
6.62% |
4.17% |
^ |
| Natural Gas |
UNG |
-7.66% |
-11.41% |
^ |
Click to enlarge graphics
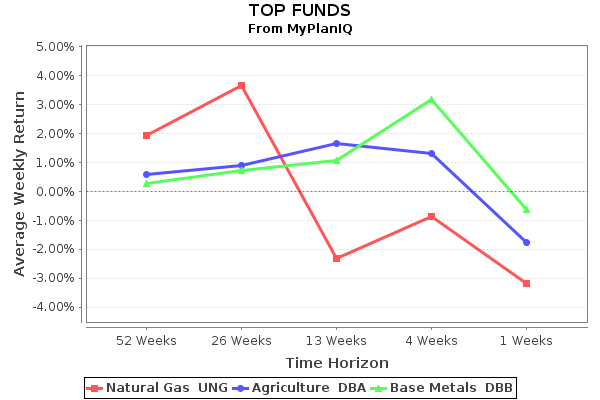
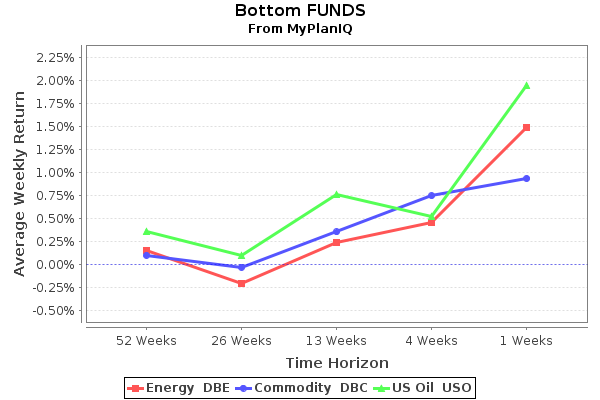
In conclusion, with the looming inflation and U.S. dollar weakness, commodities can be used as a hedge in a portfolio. Precious metals and agriculture commodities are favorable.
labels:investment,
Symbols:DBA,DBB,DBC,DBE,DBP,GLD,GSG,SLV,UNG,USO,
comments(0)
-
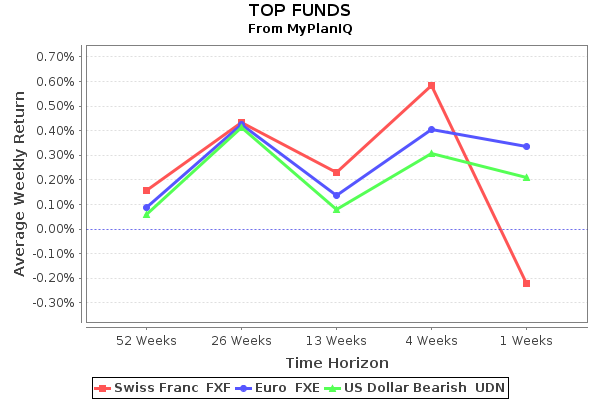
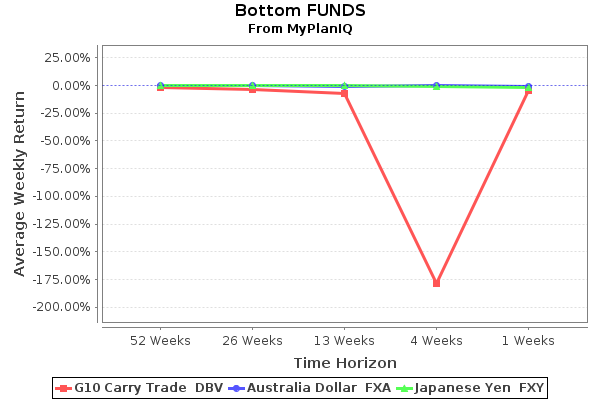
World Currencies All Bounce Back
12/10/2010
MyPlanIQ tracks trends in multiple categories using ETFs.
After a week of currencies all being down, they have all bounced back, indicating greater confidence in the individual economies and a brighter outlook overall.
| Assets Class | Symbols | 12/03
Trend
Score | 11/26
Trend
Score | Direction |
| Australia Dollar |
FXA |
8.42% |
5.58% |
^ |
| Brazilian Real |
BZF |
6.23% |
3.52% |
^ |
| Swiss Franc |
FXF |
5.65% |
2.99% |
^ |
| Swedish Krona |
FXS |
5.17% |
1.78% |
^ |
| Japanese Yen |
FXY |
4.29% |
1.47% |
^ |
| Canadian Dollar |
FXC |
3.15% |
1.98% |
^ |
| Mexican Peso |
FXM |
3.01% |
2.36% |
^ |
| US Dollar Bearish |
UDN |
1.74% |
-0.34% |
^ |
| G10 Carry Trade |
DBV |
1.32% |
0.95% |
^ |
| British Pound |
FXB |
0.96% |
-0.45% |
^ |
| Chinese Yuan |
CYB |
0.93% |
-0.14% |
^ |
| Euro |
FXE |
0.58% |
-1.6% |
^ |
The Australian dollar has jumped based on better-than-expected employment data as well as an increase in international travel -- both indicators of a strengthening economy.
The Brazilian real continues to march with the recovering economies as it looks to established nations for investment and business growth.
The Swiss franc continues to do well as a foil to the euro and the dollar. While there is little progress in solving the eurozone's problems, the CHF is likely to remain strong.
The euro is still mired in concerns about the Irish bailout and other weaker members that will drag the currency down. Any uptick in economic data will be a boost, but major hurdles remain.
The yuan continues to appreciate as its economy and trade surplus grows. There is continuing concern about how the imbalance will be addressed and the valuation of the currency.
The pound is an alternative currency to the euro, but with significant weakness in the economy and austerity measures set to bite soon, the pound will remain under pressure. However, strong retail and manufacturing data gave the pound a boost this week.
In conclusion, it is clear that there is a lot of volatility in currency markets, while the relative positions of the currencies remain more stable.
labels:investment,
Symbols:BZF,CYB,DBV,FXA,FXB,FXC,FXE,FXF,FXM,FXS,FXY,UDN,
comments(0)
-
Walmart Retirement Plan is Not as Stellar as the Company's Performance
12/09/2010
-
The Smart Money’s Appetite for Risk, Rekindled
12/09/2010
-
Combining Buffett Trigger and Morningstar's Best Bond Managers
12/09/2010
-
Global Market Sentiment Improves
12/08/2010
-
Vanguard VA Has Some Rules and Can Be Cloned with an ETF Portfolio
12/08/2010
-
Credit Market ETF Trends: Optimism as European Debt Concerns Fade
12/07/2010
-
Major Assets Movement Bodes Well With The Favorable Season
12/06/2010
-
CVS CareMark Retirement Plan: Good Funds But Can Improve Fund Qualities
12/06/2010
-
Peabody Energy 401K Plan Provides Reasonable Investment Choices
12/06/2010
-
Bristol-Myers Can Broaden Its 401K Plan Investment Choices By Offering Emerging Market or REIT Funds
12/06/2010
-
Baker Hughes 401K Plan Provides Adequate Investment Choices
12/06/2010
-
Allegheny Energy Can Improve Diversification By Offering More Choices in Its 401K Plan
12/06/2010
-
American Express Provides Above Average Investment Choices in Its 401K Plan
12/06/2010
-
Allegheny Ludlum Corporation 401K Plan Is Rated As Above Average
12/06/2010
-
Apache Design Solutions 401K Is Good For Diversification Purpose
12/06/2010
First
1
2
3
4
5
6
7
8
9
10
11
12
13
14
15
16
Last
|