|
News and Articles
-
Luminary Portfolios -- Browne Tops The List
01/09/2011
Earlier in the year, we presented a series of reports on lazy portfolios from investing luminaries. We went on to pit them together to come out with an overall winner. That was then, this is now. It's time to review their progress and look at how they have performed in 2010.
We have come down to the top six based on their one year performance -- using the original strategy and also with a buy and hold where all of the risk assets are weighted evenly. On that basis the Lowell portfolio comes out on top followed by the Bernstein no brainer portfolio. With one year returns ranging from 9-15%, we can say that the returns are all good. However, this has been a strong year, especially for US equities and so this is not truly representative of what an investor could expect over the long term. If we broaden the time horizon and look at the Sharpe ratio for each of the portfolios, we have a slightly different story. The five year returns drop to a 3-8% range. We further note that the Browne portfolio that was at the bottom of the 1 year returns, pops to the top in the longer time horizon.
We created SIB (Simpler is Better) portfolios one index fund for each asset class (ETF's are ideal for this) as a basic benchmark for each asset class portfolio. When we look at the six asset benchmark over the five year span, we see that a buy and hold of six asset classes matches the best of the results of the luminaries and the tactical asset allocation strategy beats them. Takeaways
- As in the reviews earlier in the year, the Browne permanent portfolio caught the perfect storm with US equities and gold both delivering over the past five years
- It is critical to maintain a long term view and not get caught up in the exuberance of a strong year for US equities. The year's before that were ugly
- A six asset class portfolio built up of the most popular ETF's matches the best results with buy and hold -- leading to the conclusion that diversification is always a good bet
- Tactical asset allocation trumps them all in the long term because, while it doesn't respond as well in bull markets, it limits your downside in bear markets
labels:investmentSymbols,ACWI,ACWX,ADRE,AGG,BIV,BLV,BND,BSV,BWX,CFT,CIU,CSJ,DBC,DBV,DIA,DVY,EDV,EEM,EFA,EFG,EFV,EMB,ETF,GLD,GOOG,GSG,GXC,HPQ,HYG,ICF,IEF,IEI,IFGL,IGOV,IGR,IJH,IJJ,IJK,IJR,IJS,IJT,IVE,IVV,IVW,IWB,IWC,IWD,IWF,IWM,IWN,
comments(0)

-
Risk Aversion Abates in Dividend ETFs
01/07/2011
International REITs (RWX) and U.S. REITs (IYR, ICF) continued to retain their top spots in performance
trend ranking. They are followed by several U.S. stock dividend ETFs. For more detail, please refer to the table below and performance page here.
International REITs (RWX) and U.S. REITs (IYR, ICF) continued to retain their top spots in performance
trend ranking. They are followed by several U.S. stock dividend ETFs. For more detail, please refer to the table below and performance page here.
| Assets Class | Symbols | 01/05
Trend
Score | 12/29
Trend
Score | Direction |
| SPDR DJ Wilshire Intl Real Estate |
RWX |
10.69% |
13.5% |
v |
| iShares Dow Jones US Real Estate |
IYR |
10.4% |
10.75% |
v |
| SPDR S&P 500 |
SPY |
10.32% |
10.45% |
v |
| PowerShares HighYield Dividend Achievers |
PEY |
9.46% |
10.44% |
v |
| Vanguard High Dividend Yield Indx |
VYM |
9.04% |
9.83% |
v |
| iShares MSCI Emerging Markets Index |
EEM |
9.0% |
9.75% |
v |
| Vanguard Dividend Appreciation |
VIG |
8.2% |
9.46% |
v |
| iShares Dow Jones Select Dividend Index |
DVY |
8.17% |
9.16% |
v |
| PowerShares Intl Dividend Achievers |
PID |
7.18% |
9.84% |
v |
| SPDR S&P Dividend |
SDY |
7.07% |
7.94% |
v |
| First Trust Value Line Dividend Index |
FVD |
6.76% |
7.75% |
v |
| iShares Dow Jones Intl Select Div Idx |
IDV |
5.19% |
8.86% |
v |
| iShares MSCI EAFE Index |
EFA |
4.89% |
7.9% |
v |
| iShares S&P U.S. Preferred Stock Index |
PFF |
3.77% |
3.63% |
^ |
Though several U.S. stock dividend ETFs (PEY, VYM) are ranked close to the top, we also observe that some of them like SDY and FVD have lower trend
scores. Looking into this further, we make the following observation:
- The dividend ETFs that hold cyclical stocks such as financial are doing well right now, compared with those overweighting in more stable stocks such
as consumer staples. For example, based on PowerShares, HighYield Dividend Achievers (PEY) has 34.4% financial stock holding while SPDR S&P Dividend (SDY)'s top sector holdings are in consumer staples (19.84%).
- Taking a longer term view, we noticed that SDY's five year annualized return is around 2.78%, compared with PEY's -6% (as of 1/6/2011).
- Similarly, the bottom ranked First Trust Value Line Dividend Index (FVD) has five year annualized
return is 6.31%. Its top holdings include 21.3% utilities, 15.4% industrial materials and 15.3% consumer staples.


To summarize, as in major asset classes, dividend ETFs also exhibit increasing risk appetite. Furthermore, not all of the dividend ETFs are created
equal. It is thus important to have a systematic strategy to decide what ETFs should be invested, as in the Retirement
Income ETFs investment plan.
labels: investment, Symbols, RWX, EEM, PID, IDV, PEY, EFA, SPY, SDY, PFF, DVY, FVD, VYM, VIG, ICF, IWM, comments(0)
-
Currencies Tumble Across The Board -- Mexico's Peso Bucks the Trend
01/07/2011
MyPlanIQ tracks trends in multiple categories using ETFs. For more information, please visit MyPlanIQ 360 Degree Market View.
After a couple of positive weeks, currencies tumble. Only the Mexican Peso bucks the trend and on that basis pops into the top three.
The bottom of the table remains the same although the Real should break out of there before too long.
| Assets Class | Symbols | 01/05
Trend
Score | 12/29
Trend
Score | Direction |
| Australia Dollar |
FXA |
6.0% |
10.31% |
v |
| Mexican Peso |
FXM |
3.47% |
2.59% |
^ |
| Swedish Krona |
FXS |
3.42% |
4.25% |
v |
| Japanese Yen |
FXY |
2.82% |
5.73% |
v |
| Swiss Franc |
FXF |
2.81% |
6.42% |
v |
| Canadian Dollar |
FXC |
2.37% |
3.57% |
v |
| G10 Carry Trade |
DBV |
1.59% |
2.34% |
v |
| Chinese Yuan |
CYB |
0.4% |
0.5% |
v |
| US Dollar Bearish |
UDN |
-0.63% |
1.34% |
v |
| British Pound |
FXB |
-1.15% |
-0.45% |
v |
| Euro |
FXE |
-2.37% |
-0.26% |
v |
| Brazilian Real |
BZF |
-4.52% |
-3.79% |
v |
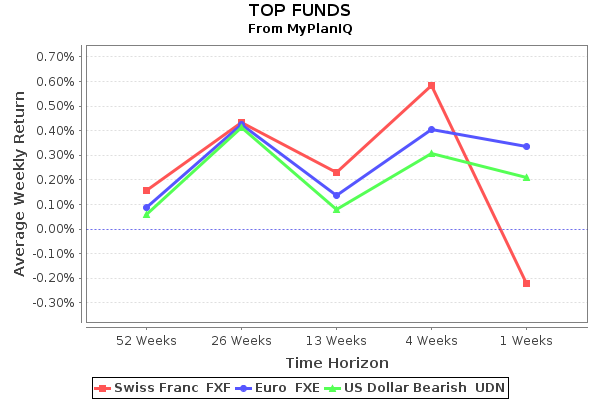
Despite strong fundamentals, the Australian Dollar has fallen to two week lows as confidence on growth waned in the wake of heavy flooding in Queensland. It still heads the table by some distance as it remains well poised as China drives demand.
The Mexican peso's entrance into the top three could be a New Year phenomenon, as investors look forward to decent economic growth. In addition, the Mexican peso has become aligned with copper and crude oil prices, both of which Mexico produces and both of which are considered hot commodity items.
The Swedish Krona hit its highest level against the Euro for six years as the Swedish economy warms against concern over the standing of the European single currency.
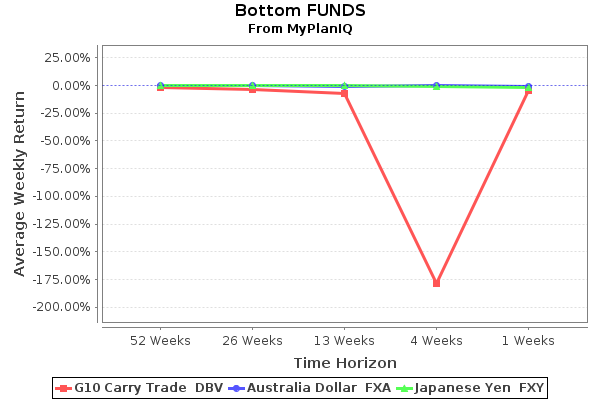
The Real was hit by concerns of Brazilian banks shorting the US Dollar as the currency has already appreciated 37% against the Greenback.
The Euro and the pound trade places at the bottom as they are mired with debt and austerity issues that will continue to drag on the currency even though the Euro has done better against some of the world currencies.
We will see who returns to positive territory next week.
labels:investment,
Symbols:FXA,FXM,BZF,FXY,FXC,FXF,FXS,DBV,CYB,UDN,FXB,FXE,
comments(0)
-
FEDEX Doesn't Deliver on It's Retirement Plan
01/07/2011
FedEx Corporation (FDX) provides transportation, e-commerce, and business services in the United States and internationally. It operates in four segments: FedEx Express, FedEx Ground, FedEx Freight, and FedEx Services. The company was founded in 1971 and is headquartered in Memphis, Tennessee.
We report on the FedEx 401K Plan for Pilots. We discuss investment choices and present plan rating. Their plan consists of 23 funds. These funds enable participants to gain exposure to 3 major assets: US Equity, Foreign Equity, Fixed Income.
The list of minor asset classes covered:
Conservative Allocation: AOK
Foreign Large Blend: EFA, VEU, GWL, PFA
Foreign Large Value: EFV, PID, DWM
Inflation-protected Bond: TIP
Intermediate-term Bond: AGG, CIU, BIV, BND
Large Blend: IVV, IYY, IWV, VTI, VV, SPY, DLN, RSP, SCHX
Large Value: IVE, IWW, JKF, VTV, ELV, PWV, RPV, SCHV
Mid-cap Blend: IJH, IWR, JKG, VO, MDY, EMM, PJG, DON, EZM, MVV
Moderate Allocation: AOM
Retirement Income:
Small Blend: IJR, IWM, JKJ, VB, DSC, PJM, DES, SAA, UWM, SCHA
Target Date 2000-2010: TZD
Target Date 2011-2015: TZE
Target Date 2016-2020: TZG
Target Date 2021-2025: TZI
Target Date 2026-2030: TZL
Target Date 2031-2035: TZO
Target Date 2036-2040: TZV
Target Date 2041-2045:
Target Date 2050+:
| Asset Class | Number of funds |
| REITs |
0 |
| Balanced Fund |
14 |
| Fixed Income |
2 |
| Commodity |
0 |
| Foreign Equity |
2 |
| Emerging Market Equity |
0 |
| US Equity |
5 |
| Total |
23 |
With a large number of balanced or target date funds, participants don't have a great deal of freedom to build a high performance portfolio using asset allocation. The number of funds in the US asset class is fine, foreign equity is OK but there should be more funds in fixed income and, ideally, at least one more asset class. The plan rating will reflect this.
As of Jan 5, 2011, this plan investment choice is rated as below average based on MyPlanIQ Plan Rating methodology that was designed to measure how effective a plan's available investment funds are . It has the following detailed ratings:
Diversification -- Rated as below average (15%)
Fund Quality -- Rated as average (43%)
Portfolio Building -- Rated as average (40%)
Overall Rating: below average (33%)
Current Economic and Market ConditionsAmericans continue to face an uncertain future, given (among others) the high unemployment rate, large federal and local government debts and global trade imbalance. With such an economic backdrop, the stock and debt markets are going to be volatile. Despite this, markets have been resilient and appear positioned to rebound.
2010 ended very strongly for US equities. Going forward, it is going to be increasingly important to have a wide range of asset classes including commodities and real estate as inflation is likely to creep in as US government intervention in the economy has to be funded.
In this market it is even more critical to properly diversify and respond market changes. MyPlanIQ offers two asset allocation strategies: strategic and tactical asset allocation strategies (SAA and TAA for participants in the FEDEX plan.
Strategic Asset Allocation is based on well known modern portfolio theory and its key features include: diversification, proper fund selection and periodically re-balancing.
Tactical Asset Allocation works on a diversified array of assets provided by funds in a plan and adjusts asset mixes based on market conditions such as asset price momentum utilized by TAA.
Portfolio Discussions
The chart and table below show the historical performance of moderate model portfolios employing strategic and tactical asset allocation strategies. For comparison purpose, we also include the moderate model portfolios of a typical 3 asset SIB (Simpler Is Better) plan . This SIB plan has the following candidate index funds and their ETF equivalents:
US Equity: SPY or VTI
Foreign Equity: EFA or VEU
Fixed Income: AGG or BND
Performance chart (as of Jan 5, 2011)

Performance table (as of Jan 5, 2011)
Currently Commodities, US Equity and Emerging Market are doing well. Only US Equity is available to Federal Express plan participants.
This plan beats the three asset benchmark by virtue of the US asset class choices. If would be a stronger plan with more fixed income choices and an additional asset class.
To summarize, FedEx 401K Plan participants can achieve the best investment returns by adopting asset allocation strategies that are tailored to their risk profiles.
Federal Express would do well by their employees to consider reviewing their existing funds and adding an additional asset class.
labels:investment,
Symbols:FDX,SPY,VTI,EFA,VEU,EEM,VWO,AGG,BND,HYG,JNK,PHB,AOM,CIU,BIV,MTK,PTF,RYT,ROM,GWL,PFA,IVE,IWW,JKF,VTV,PWV,RPV,SCHV,EFV,PID,DWM,IVV,IYY,IWV,VV,DLN,RSP,SCHX,IVW,IWZ,JKE,VUG,QQQQ,RPG,SCHG,IJJ,IWS,JKI,VOE,PWP,RFV,UVU,IJH,IWR,JKG,VO,MDY,EMM,PJG,DON,EZM,MVV,
comments(0)
-
Inflation Prospects to Pressure Bonds Soon?
01/07/2011
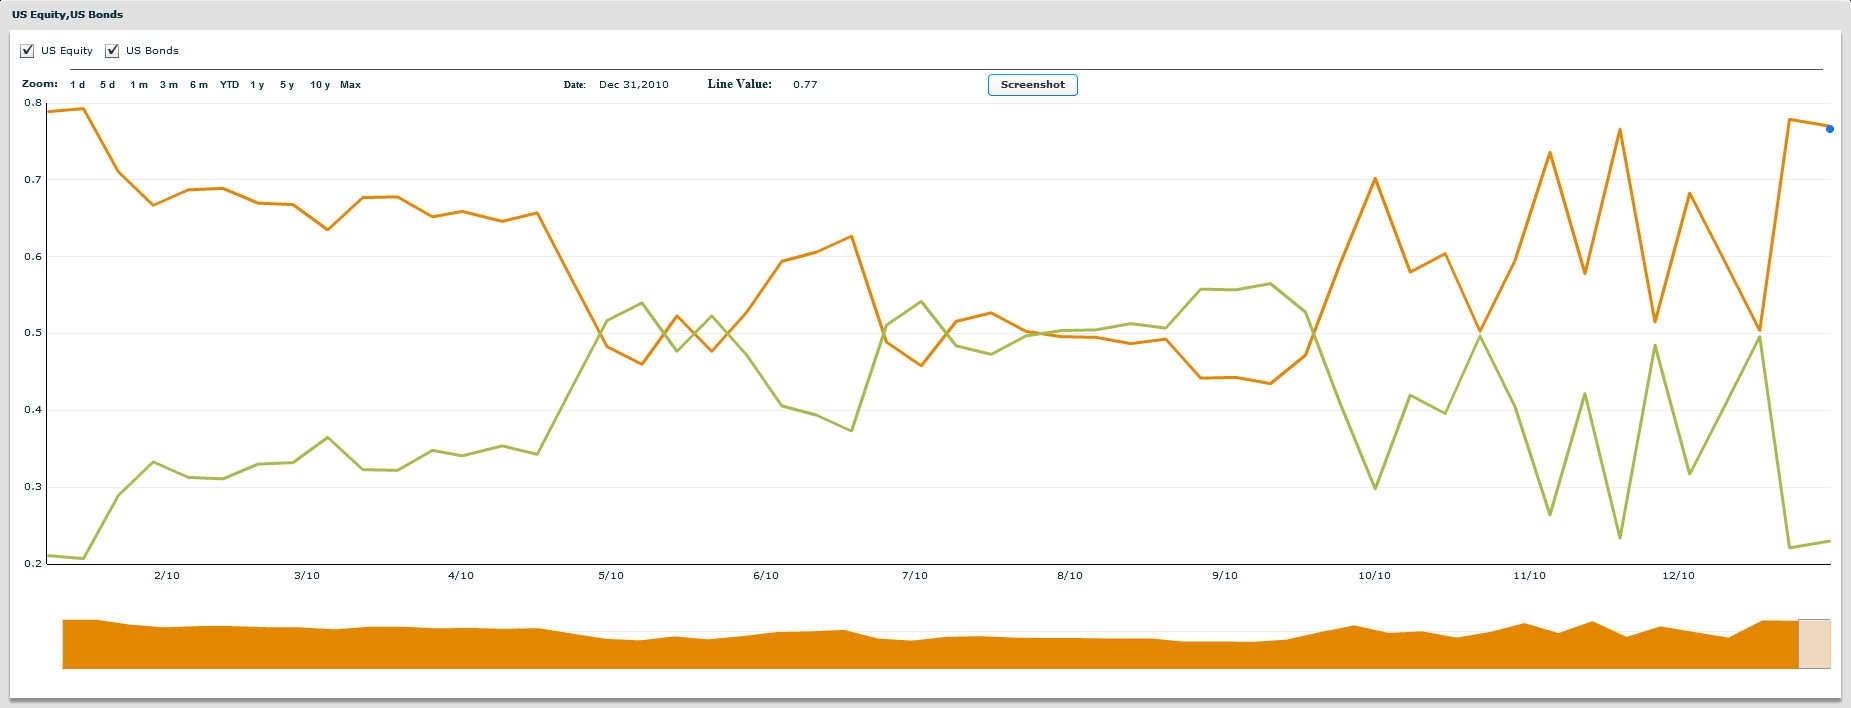
Our smart money indicator reports funds' aggregate asset exposure to U.S. equities and bonds. It is derived based on comprehensive analysis of the top asset allocation Gurus' recent asset exposure. We track two separate indicators:
- Top 3 Moderate Allocation Funds (Smart Money)
- 481 Moderate Asset Allocation Mutual Funds (Pro Money)
This is calculated weekly, and the chart covers the last one year. For the week ending 12/31/2010, our proprietary model reported equity exposure for the two set of funds was 77% and 66%, respectively.
Trends for the Top 3 Moderate Allocation Funds (Smart Money)
481 Moderate Asset Allocation Mutual Funds (Pro Money)
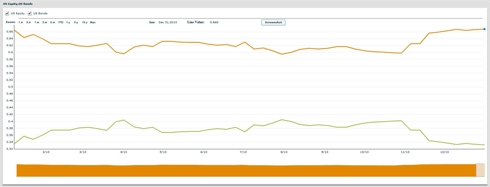
click to enlarge charts
Two weeks ago, we saw that the continued stabilization of investor appetite for equity was driving inflow into the stock market. This trend remained little changed last week as improved economic data continued to feed positive sentiment.
Rising interest rates will hurt fixed-income assets, and this trend of funds pulling out of bonds and being in favor of stocks is not surprising as many investors believe that the low-interest-rate environment will not last for too long. Some economists are predicting that the U.S. economy will grow at a rate close to 4% for the next two years. Inflation expectations are bound to rise and the Fed won’t be able to keep subsidizing borrowers at the expense of savers forever. Bond investor Bill Gross has recently suggested the end of the bull bond market may be at hand. Warren Buffett also echoed a similar viewpoint, indicating “short-term and long-term bonds are a very poor investment at the present time”.
That said, not all the doubts about the direction of the economy are completely removed yet, and the Fed’s own predictions are that the unemployment rate will stay in the 9%+ range for all of 2011. It’s hard to see the Fed would begin any credible discussion about raising rates until we see some meaningful downward movements in the unemployment figures.
labels:investment,
Symbols:AGG,BBND,CIU,EEM,EFA,GSG,HYG,ICFI,IEF,IWM,IYR,JNK,MBB,MDY,MUB,PHB,QQQQ,SHV,SHY,SPY,TLT,VEU,VNQ,VWO,
comments(0)
-
American Flies Above United in Plan Structure, Below United in Returns
01/06/2011
-
Country ETFs Flat While South Korea and South Africa Spike
01/06/2011
-
International Inflation Protected Bonds: Double Hedge in Uncertain Times
01/04/2011
-
Hussman Index Says Stocks are Overvalued
01/04/2011
-
Commodity Trends: 2010 Year End Review
01/03/2011
-
Risk Appetite in Major Assets Increases
01/03/2011
-
Simple ETF Portfolio Demonstrates the Limits of Momentum Strategies
01/01/2011
-
Most U.S. Sector End Sharply Higher For The Year
01/01/2011
-
End of the Year Review of Luminary Portfolios -- II
01/01/2011
-
ATT Dials Up A Mediocre Plan
12/30/2010
-
Year End Currencies -- WIP
12/30/2010
-
Year-End Rally: Both U.S. and International REITs Stand Out
12/30/2010
-
End of the Year Review of Luminary Portfolios
12/30/2010
-
Smart Money Trend: Bonds Retreat, Equities Edge Back
12/30/2010
-
Country ETF Trends Largely Unchanged: Russia Shines, Spain Tumbles
12/29/2010
First
1
2
3
4
5
6
7
8
9
10
11
12
13
14
15
16
Last
|