|
News and Articles
-
United Airlines Upgrades their 401K Plan
11/13/2010
We recently published a summary of the United Airlines 401K plan. Subsequent to this, United Airlines informed us that they have upgraded their plan in October 2010 and we now review the new plan.
The upgraded plan has 21 funds --little changed in number. These funds enable participants to gain exposure to 3 major assets: US Equity, Foreign Equity, Fixed Income -- again the same as the last plan.
We will compare the old and new funds as they both have similar composition.
| Asset Class |
New Plan |
Old Plan |
| U.S. Equity Excluding Company Stock |
6 |
6 |
| International Equity |
2 |
2 |
| Balanced Funds |
3 |
4 |
| Fixed Income |
4 |
3 |
| Target Date |
5 |
6 |
As of Nov 11, 2010, the new plan's investment choice is rated as above average based on MyPlanIQ Plan Rating methodology that was designed to measure how effective a plan's available investment funds are.
| Plan Rating Attribute |
New Plan |
Old Plan |
| Diversification |
77% |
43% |
| Fund Quality |
86% |
20% |
| Portfolio Building |
76% |
42% |
| Overall Rating |
79% |
35% |
This is a significant jump across the board without introducing a lot more funds. The key reasons for the improvement are:
- US and international equities have large, medium and small cap alternatives whereas previously it was just large cap stock
- The fixed income choices are higher quality
This should be a well performing three asset class plan.
Performance chart (as of Nov 10, 2010)

Performance table (as of Nov 10, 2010)
If we now compare this to the Kellogg plan as we did in the last article:
Performance chart (as of Nov 11, 2010)

Performance table (as of Nov 11, 2010)
We can see that the United Plan now nudges ahead of the Kellog plan in terms of risk adjusted returns over the last five years.
Kudos to United in recognizing that their 401K plan needed to be improved and providing a free upgrade for its employees.
labels:investment,
Symbols:AGG,AOK,AOM,BIV,BND,CIU,DLN,DRF,EFA,ELG,ELV,GWL,IEI,IPF,ITE,IVE,IVV,IVW,IWV,IWW,IWZ,IYF,IYY,JKE,JKF,K,PFA,PFI,PLK,PWV,QQQQ,RPG,RPV,RSP,RYF,SCHG,SCHV,SCHX,SHV,SHY,SPY,TZD,TZE,TZI,TZO,UAUA,USY,VEU,VFH,VGIT,VGSH,VTI,VTV,VUG,VV,
comments(0)

-
High Dividend Stock ETFs for Income Producing Portfolios
11/12/2010
We are initiating coverage on dividend producing ETF's in a number of different asset classes or styles. ETFs for high dividend stocks can be used to represent their corresponding equity classes in asset allocation. It is thus important to monitor their trends to gain insights into the funds to build a high performamce portfolio with the goal of providing income as well as growth. Fixed income (bond) trend is covered in a separate weekly report.
More details are available on the MyPlanIQ website.
Description
| |
Symbol
|
8-Nov Trend Score
|
Direction
|
|
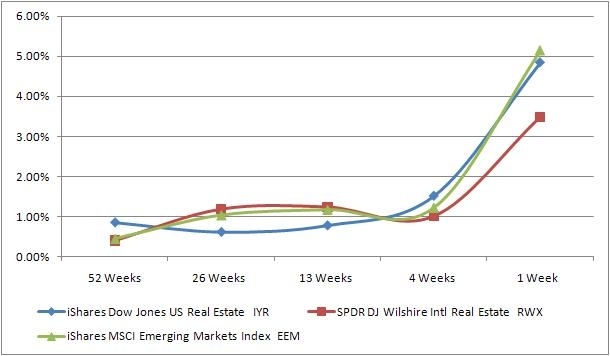
iShares Dow Jones US Real Estate
|
IYR
|
16%
|
First Week
|
|
SPDR DJ Wilshire Intl Real Estate
|
RWX
|
15%
|
First Week
|
|
iShares MSCI Emerging Markets Index
|
EEM
|
15%
|
First Week
|
|
PowerShares Intl Dividend Achievers
|
PID
|
11%
|
First Week
|
|
iShares Dow Jones Intl Select Div Idx
|
IDV
|
11%
|
First Week
|
|
PowerShares HighYield Dividend Achievers
|
PEY
|
10%
|
First Week
|
|
iShares MSCI EAFE Index
|
EFA
|
9%
|
First Week
|
|
SPDR S&P 500
|
SPY
|
9%
|
First Week
|
|
SPDR S&P Dividend
|
SDY
|
9%
|
First Week
|
|
iShares S&P U.S. Preferred Stock Index
|
PFF
|
9%
|
First Week
|
|
iShares Dow Jones Select Dividend Index
|
DVY
|
9%
|
First Week
|
|
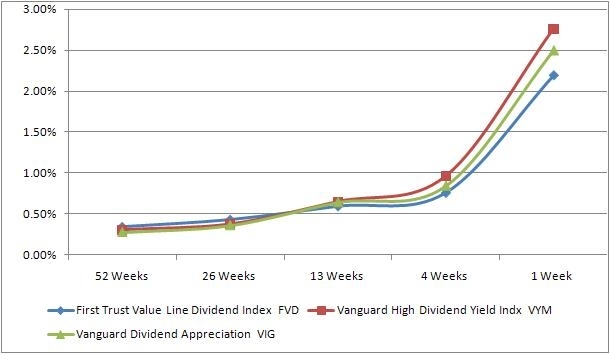
First Trust Value Line Dividend Index
|
FVD
|
8%
|
First Week
|
|
Vanguard High Dividend Yield Indx
|
VYM
|
8%
|
First Week
|
|
Vanguard Dividend Appreciation
|
VIG
|
8%
|
First Week
|

Despite the perception that real estate is a toxic asset, real estate trusts internationally and domestically continue to deliver strong results.
Emerging markets are also doing well as exports recover although the weakness of the dollar is a concern to many.

U.S. equity dividend stock ETFs have had similar performance. They under performed foreign dividend ETFs mostly due to dollar weakness. Their performance are all pointing to an up trend.
It is also noteworthy that U.S. dividend ETFs have similar returns as broad base indices such as s&P 500 while in the meantime, international dividend ETFs out perform their benchmark (MSCI EAFE Index).
labels:investment,
Symbols:IYR,RWX,EEM,PID,IDV,PEY,EFA,SPY,SDY,PFF,DVY,FVD,VYM,VIG,
comments(0)
-
Retirement Income Portfolio Building Using ETFs and Asset Allocation Strategies
11/12/2010
Building a steady and safe income producing portfolio is paramount to retirees. High yield stocks, preferred stocks, convertibles and bonds are the basic building blocks for such portfolios. Research results indicate that blue chip stocks with high dividends, unlike highly volatile and low dividend or no dividend stocks (such as many high tech stocks and small company stocks), have produced comparable or even slightly higher returns with less risk in long term.
In this article, we present a high income investment plan (Retirement Income ETFs) that is based on asset allocation strategies. Both MyPlanIQ Strategic Asset Allocation (SAA) and Tactical Asset Allocation (TAA) strategies are used to construct model portfolios.
This plan is designed for income producing purpose: high dividend (yield) stock ETFs are chosen for both US stocks and international stocks asset classes. We have decided to use general emerging market stocks ETFs (EEM or VWO) instead of some thinly traded high dividend emerging market stock ETFs. This situation will be changed once the high yield emerging market stock ETFs become more liquid and tradable.
The plan uses 34 ETFs that represent the following five key asset classes:
U.S. stocks: VIG, DVY, SDY, FVD, VYM, PEY, PFF
International stocks: PID, IDV
Emerging market stocks: EEM, VWO
Real Estate Investment Trusts (REITs): IYR, ICF, VNQ, RWX
Fixed Income:
- US Fixed Income: HYG, LQD, VCLT, CIU, CORP, CSJ, VCSH, IEI, IEF, SHY, TLT, TIP, MBB, MUB, SHM
- International Fixed Income: BWX, EMB, PCY, WIP
Notice that preferred stocks PFF is classified under U.S. stocks.
We compared the back tested performances of the SAA and TAA moderate model portfolios with the corresponding SIB (Simpler Is Better) five core asset ETF portfolios. As of 11/9/2010, the performance is:

Performance table (as of Nov 10, 2010)
From the above chart, one can see that since the portfolio inception (12/31/2000),the Retirement Income ETFs Strategic Asset Allocation Moderate has outperformed its corresponding Five Core Asset Index ETF Funds Strategic Asset Allocation Moderate while in the meantime, the Retirement Income ETFs Tactical Asset Allocation Moderate has outperformed its corresponding Five Core Asset Index ETF Funds Tactical Asset Allocation Moderate. In fact, in the past ten years, the Retirement Income portfolios had lower standard deviation than the Five Core SIB. Please visit the corresponding portfolios for more detailed performance information.
Currently, the SAA Moderate Portfolio has the following holdings and yields:
| Asset |
ETFs |
Allocation |
Yield |
| REAL ESTATE |
ICF (iShares Cohen & Steers Realty Majors) |
11.96% |
2.88% |
| FIXED INCOME |
LQD (iShares iBoxx $ Invest Grade Corp Bond) |
18.40% |
4.80% |
| Emerging Market |
VWO (Vanguard Emerging Markets Stock ETF) |
13.31% |
1.20% |
| US EQUITY |
DVY (iShares Dow Jones Select Dividend Index) |
5.92% |
3.53% |
| US EQUITY |
PEY (PowerShares HighYield Dividend Achievers) |
4.87% |
4.28% |
| INTERNATIONAL EQUITY |
IDV (iShares Dow Jones Intl Select Div Idx) |
16.50% |
4.25% |
| High Yield Bond |
HYG (iShares iBoxx $ High Yield Corporate Bd) |
16.47% |
8.40% |
| INTERNATIONAL BONDS |
BWX (SPDR Lehman Intl Treasury Bond) |
12.57% |
0.70% |
| Total Yield |
|
|
4% |
Compared with current sub-zero interests in a cash account, the above portfolio's yield is very attractive.
In conclusions, using effective asset allocation strategies (especially the tactical asset allocation strategy), one can build an income producing portfolio that is less risky and achieve higher returns. Retirees or anyone who needs supplemental income can benefit from learning more on these investment plans.
labels:investment,
Symbols:VIG,DVY,SDY,FVD,VYM,PEY,PFF,SPY,IWM,PID,IDV,EFA,VEU,EEM,VWO,IYR,ICF,VNQ,RWX,HYG,LQD,VCLT,CIU,CORP,CSJ,VCSH,IEI,IEF,SHY,TLT,TIP,MBB,MUB,SHM,AGG,BND,BWX,EMB,PCY,WIP,
comments(0)
-
Currency ETFs Give Insight to National Fiscal Issues and Policy
11/12/2010
Currencies provide insight into how a nation is dealing with the current crisis and the strength of the underlying economies. We are tracking the ETFs that represent eleven different currencies and one basket of currencies.
More details are available on the MyPlanIQ website.
|
Description
|
Symbol
|
8-Nov Trend Score
|
Direction
|
|
Australia Dollar
|
(FXA)
|
19%
|
Week 1
|
|
Mexican Peso
|
(FXM)
|
14%
|
Week 1
|
|
Brazilian Real
|
(BZF)
|
12%
|
Week 1
|
|
Japanese Yen
|
(FXY)
|
10%
|
Week 1
|
|
Canadian Dollar
|
(FXC)
|
10%
|
Week 1
|
|
Swiss Franc
|
(FXF))
|
9%
|
Week 1
|
|
Swedish Krona
|
(FXS)
|
8%
|
Week 1
|
|
G10 Carry Trade
|
(DBV)
|
7%
|
Week 1
|
|
Chinese Yuan
|
(CYB)
|
2%
|
Week 1
|
|
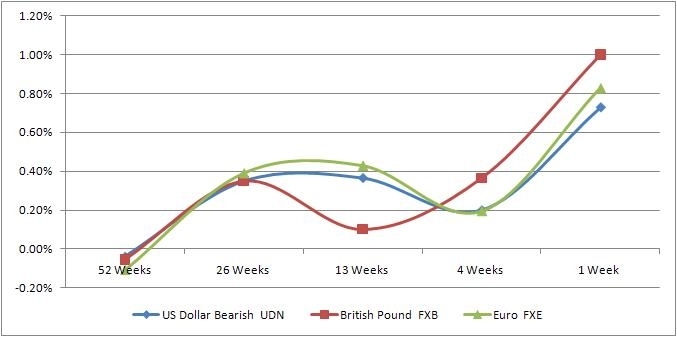
US Dollar Bearish
|
(UDN)
|
0%
|
Week 1
|
|
British Pound
|
(FXB)
|
-1%
|
Week 1
|
|
Euro
|
(FXE)
|
-4%
|
Week 1
|
click to enlarge
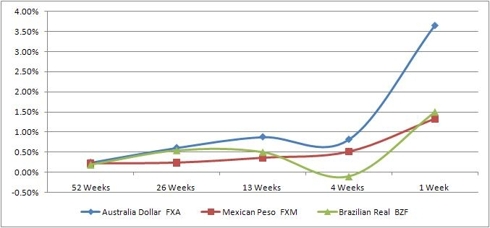
The Australian Dollar reflects the hope of a recovery in China to whom they export many raw materials.
The Mexican Peso is buoyed by strong exports even as domestic demand is sluggish.
The Brazilian real had an up week, but there are concerns about eurozone debt and slowing Chinese demand for Latin American exports. This is one to watch carefully.
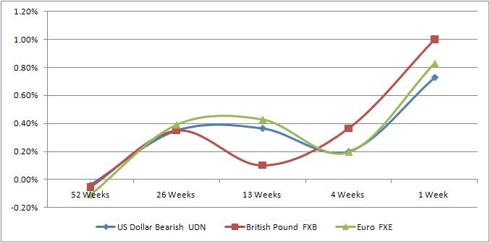
The US dollar is going to be under pressure from the QE2 injection of funds. It is already having a global impact on currencies.
The British pound is going to be tied to the dollar as both economies were significantly damaged by the "credit crunch." The UK is in the process of rolling out its austerity measures and then we will see what that does to the currency.
The euro recently rose from one-month lows to pull ahead of the dollar after being whipsawed by quantitative easing, sovereign debt fears and a weak 30-year Treasury auction.
Currencies will continue to fluctuate as the different economic zones deal with the fallout from the recent QE2 measure.
labels:investment,
Symbols:BZF,CYB,DBV,FXA,FXB,FXC,FXE,FXF,FXM,FXS,FXY,UDN,
comments(0)
-
ETFs Provide Insight Into U.S. Sectors' Performance
11/12/2010
US sectors provide insight into the parts of the US economy that are flourishing or floundering. We are tracking the ETFs that represent ten different financial sectors.
More details are available on the MyPlanIQ website.
|
Description
|
Symbol
|
8-Nov Trend Score
|
Direction
|
|
Consumer Discretionary
|
(XLY)
|
14%
|
Week 1
|
|
Materials
|
(XLB)
|
13%
|
Week 1
|
|
Telecom
|
(IYZ)
|
13%
|
Week 1
|
|
Technology
|
(XLK)
|
12%
|
Week 1
|
|
Industries
|
(XLI)
|
11%
|
Week 1
|
|
Energy
|
(XLE)
|
10%
|
Week 1
|
|
Consumer Staples
|
(XLP)
|
7%
|
Week 1
|
|
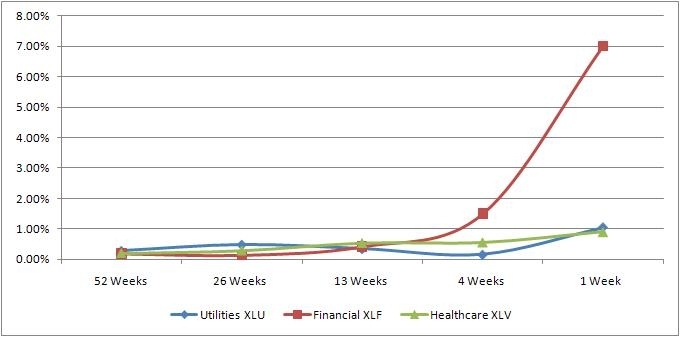
Utilities
|
(XLU)
|
7%
|
Week 1
|
|
Financial
|
(XLF)
|
6%
|
Week 1
|
|
Healthcare
|
(XLV)
|
6%
|
Week 1
|
click to enlarge
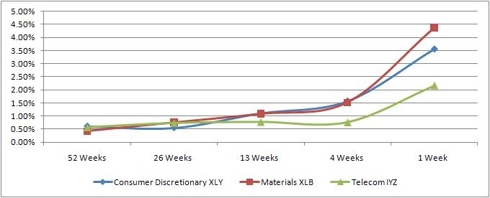
We are entering the holiday period with the QE2 wind at our backs. This is going to increase consumer confidence and consumer spending.
The materials and commodity sectors have jumped due to a weak dollar, which the QE2 program exacerbates. It is also likely to stimulate demand for materials further pushing up the price.
The telecom sector includes wireless phone providers and they will likely do well through the holiday period with the increasing success of smart phones.
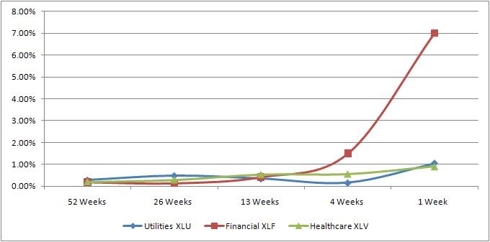
With the Republican victory in the House, some analysts are talking a lot these days about utilities stocks -- the reason being that the sector may benefit from the higher likelihood that the 15% tax rate on dividends will be extended.
The financial sector is still recovering from its meltdown and will continue to be under pressure with continuing concerns with mortgage stability and general fragility.
Healthcare's overall performance has been under pressure in this economic environment. Despite a substantial portion of their products being required for survival, sales remain sluggish. As a result, a wave of consolidation has gobbled up mid-cap companies with new products.
Some of these sectors will peak in the holiday season while others will settle over a longer time period as the political and economic climate evolves.
labels:investment,
Symbols:AGG,BND,CIU,CSJ,DBA,DBC,EEM,EFA,GSG,HYG,ICF,IEF,IWM,IYR,IYZ,JNK,LQD,MBB,MDY,MUB,PHB,QQQQ,SHV,SHY,SPY,TLT,USO,VEU,VNQ,VWO,XLB,XLE,XLF,XLI,XLK,XLP,XLU,XLV,XLY,
comments(0)
-
United Airlines 401K Flies Above the ETF Benchmark, But Below Kellogg
11/12/2010
-
Commodities Directions
11/10/2010
-
International ETF's Give Insight on Global Economies
11/10/2010
-
ETF Based Bond Trend Indicators For The Week of November 8
11/08/2010
-
ETF Based Major Asset Class Trend Indicators For The Week of November 8
11/08/2010
-
VA--PartII
11/06/2010
-
Variable Annuities
11/04/2010
-
How Plan Rating Stack up Against ETF Portfolios Returns -- Part 3
11/03/2010
-
How Plan Rating Stack up Against ETF Portfolios Returns -- Part 2
11/02/2010
-
New York Times -- How Plan Rating Stack up Against ETF Portfolios -- Part 1
11/02/2010
-
Is an ETF Portfolio a Better Vehicle than a 529 Plan for College?
11/02/2010
-
Kellogg 401K beats a 3 Asset Class ETF portfolio -- Can't beat the 4 asset class ETF portfolio
11/02/2010
-
Top Tier ETF Brokers: And the Winner Is...
11/01/2010
-
News Corporation -- Worldwide Presence -- Old Style Retirement
10/28/2010
-
Top Tier ETF Broker Finalists
10/28/2010
First
1
2
3
4
5
6
7
8
9
10
11
12
13
14
15
16
Last
|