Fund Advice Gives Sound Advice
03/22/2011 0 comments
One of the most glaring holes in our education system is retirement investing. Much is said about day trading and the high wire acts of Hedge Funds. Retirement investing is a long term proposition and is similar to looking after your health – do what is sensible and have occasional checkups that become more frequent as you age. Boomers are getting to retirement age without sufficient funds and the group behind them are faring no better. As social security and other retirement schemes are under increasing pressure with debt and inflcation, we are simply going to have to be more active in our own retirment plans. Nobody cares about your retirement investments as much as you do.
A simple portfolio (six ETFs – index funds – no fancy management – one fund for each of six different classes). over a five year period, buy and hold has returned 7% and a more active momentum strategy has returned 13%. This is a simple, easy to understand fund and investment approach that can be used as a benchmark for what others are telling you.
We are investigating and breaking down luminary portfolios for ideas and approaches to retirement investing to help gain understanding and experience.
The FundAdvice Ultimate Buy and Hold Portfolio is tracked by MarketWatch.com's lazy portfolios, maintained by Paul Farrel. The portfolio is very diversified in equity asset classes although corporate bonds are missing. The plan consists of 11 funds. These funds enable participants to gain exposure to 5 major assets: US Equity, Foreign Equity, REITs, Emerging Market Equity, Fixed Income.
| Asset Class | Ticker | Original Portfolio Holdings |
|---|---|---|
| DIVERSIFIED EMERGING MKTS | VEIEX | 6% |
| LARGE BLEND | VFINX | 6% |
| Intermediate Government | VFITX | 20% |
| SHORT GOVERNMENT | VFISX | 12% |
| Inflation-Protected Bond | VIPSX | 8% |
| Foreign Large Value | VTRIX | 12% |
| Foreign Large Blend | VDMIX | 12% |
| SMALL BLEND | NAESX | 6% |
| SMALL VALUE | VISVX | 6% |
| LARGE VALUE | VIVAX | 6% |
| REAL ESTATE | VGSIX | 6% |
| Asset Class | Number of funds | Lazy Portfolio Percentage |
|---|---|---|
| Balanced Fund | 0 | |
| REITs | 1 | 6 |
| Fixed Income | 3 | 40 |
| Commodity | 0 | |
| Foreign Equity | 2 | 24 |
| Emerging Market Equity | 1 | 6 |
| US Equity | 4 | 24 |
| Other | 6 | |
| Total | 11 |
The ETF Portfolio has:
(EEM) for emerging markets, (SPY) forlarge blend, (IEI) for the intermediate government bond, (SHY) for the short treasury, (TIP) for inflation protected bonds, (EFV) for foreign large blend, (IWM) for the small blend, (IWN) as small value, (IWW) for large value, (IYR) for real estate.
As of Mar 21, 2011, this plan investment choice is rated as average based on MyPlanIQ Plan Rating methodology that was designed to measure how effective a plan's available investment funds are . It has the following detailed ratings:
Diversification -- Rated as average (49%)
Fund Quality -- Rated as average (48%)
Portfolio Building -- Rated as above average (72%)
Overall Rating: average (58%)
Portfolio Discussions
This is a well balanced portfolio with access to five asset classes. In the original, Emerging markets and Real Estate is underweighted and Commodities are not represented at all. We are going to compare the original portfolio with an ETF portfolio with standard Strategic Asset allocation and Tactical Asset allocation weightings.
SAA will have 40% in Fixed income and 15% in each of the other asset classes
TAA will have 40% in Fixed income and 30% in the two top performing asset classes
The ETF portfolio uses a simpler structure -- one ETF for each asset class -- VTI or SPY, VEU or EFA, VWO or EEM, VMQ or IYR, BND or AGG.
With any of these ETFs, we would expect the performance would be similar to the Mutual Fund versions because they have high trading volume. They don't have the same history as the Mutual Funds if you want to go back ten years.
Performance table (as of Mar 21, 2011)
Portfolio Performance Comparison
| Portfolio Name | 1Yr AR | 1Yr Sharpe | 3Yr AR | 3Yr Sharpe | 5Yr AR | 5Yr Sharpe |
|---|---|---|---|---|---|---|
| FundAdvice Ultimate Buy and Hold Lazy Portfolio ETFs SAA |
12% | 87% | 4% | 18% | 5% | 20% |
| Fund Advice Ultimate Buy and Hold Lazy Portfolio | 10% | 72% | 4% | 15% | 5% | 21% |
| Five Core Asset ETF Benchmark Strategic Asset Allocation Moderate | 12% | 76% | 5% | 16% | 5% | 19% |
| Five Core Asset ETF Benchmark Tactical Asset Allocation Moderate | 7% | 42% | 8% | 60% | 10% | 63% |
| FundAdvice Ultimate Buy and Hold Lazy Portfolio ETFs TAA |
5% | 23% | 6% | 45% | 8% | 55% |
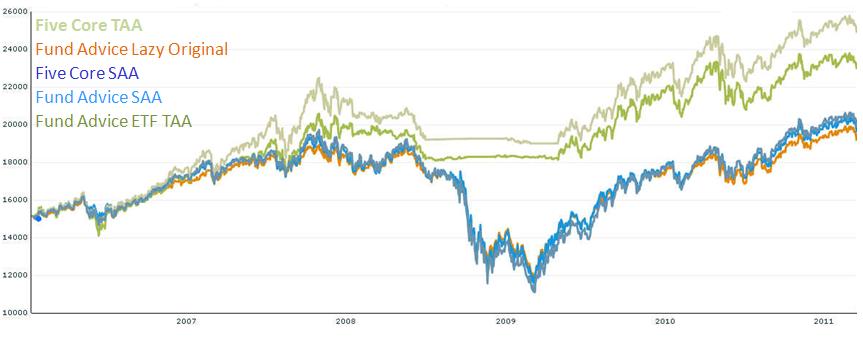
What we can see is that the buy and hold strategies -- the original portfolio and the two strategic asset allocation portfolios -- were running neck and neck with the tactical portfolios until we started to hit significant market turbulence around 2007. Until the spring of 2009 the tactical portfolios were clearly ahead but as we came out of the recession, it's possible to see that the buy and hold strategies have closed the gap somewhat. This is a great way of understanding what the two approaches bring over the long term.
We note that the buy and hold strategies are virtually indistinguishable. The original portfolio has been well chosen in the sense that it is only rebalanced once a year and there is no rotation of sub-classes (for example between the different fixed income or US equity classes) and it has barely suffered at all. In a future article we will drill into the last few months and see whether moving some or all of the fixed income into cash has helped the two SAA portfolios squeeze out a little more of late.
We also not the difference between the two TAA portfolios. The Five asset benchmark with only one fund per asset class has outperformed the plan with multiple choices. Research has shown that rotating assets in subclasses can bring benefits but, in recent days, that hasn't proven to be the case with the exception of moving fixed income to cash. The simple benchmark plans have done remarkably well over the past five years.
The key takeaways are:
- Over the longer term, when there have been downturns in the market, a tactical asset allocation strategy wins out
- When the markets are doing well, buy and hold wins out
- Be careful about asset class rotation -- it doesn't always give you the best returns
- You have to be involved and aware to get the most out of your investments
We can expect choppy markets over the next few months and care should be taken as to which strategy is selected.
Disclosure:
MyPlanIQ does not have any business relationship with the company or companies mentioned in this article. It does not set up their retirement plans. The performance data of portfolios mentioned above are obtained through historical simulation and are hypothetical.
Symbols:VTI,SPY,VEU,EFA,VWO,EEM,VMQ,IYR,BND,AGG,IEI,SHY,TIP,EFV,IWM,IWN,IWW,IYR,
comments 0
Or Start FREE 30-day trial now >>
