Credit Market Trends: Upbeat Data Adds to Pressure on Treasuries
12/14/2010 0 comments
Fixed income indices provide important insight into debt market conditions that are key to asset allocation strategies such as our Tactical Asset Allocation. MyPlanIQ uses representative ETFs and tracks detailed weekly bond trend movements. For detailed information, please visit MyPlanIQ 360 Degree Market View.
As the economic outlook continues to improve with better-than-expected U.S. trade and consumer-sentiment reports, Treasuries sank in the week ended on 12/10. The brighter economic outlook has prompted investors to seek higher returns in riskier assets.
The 10-year note's yield surged more than 0.30% last week, driving down prices of the 10-20 Year Treasury Bond Fund (TLH). The rising yields also pushed up long-term borrowing costs for consumers and businesses. As a result, national mortgage rates moved higher last week. The MBS Bond Fund (MBB) registered a weekly drop of 0.66%. With a struggling housing market, higher mortgage rates pose a threat to the recovery of the housing sector and the broader economy. If high interest rates persist in the weeks ahead, we expect to see a further drop in (MBB).
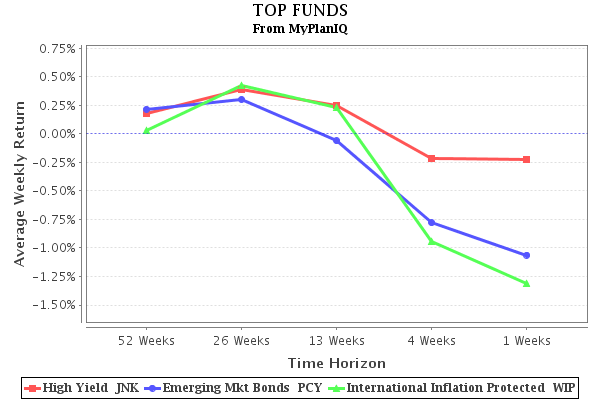
Lower Treasury bond prices and higher yields were also putting pressure on the high yield bonds (JNK). High yield investors need to remain cautious and pay particular attention on the rate at which the Treasury benchmark rises - the pace of increase in the junk bond yield spreads over Treasuries might eventually catch up with that of the rising benchmark, further putting pressure on the prices of junk bonds.
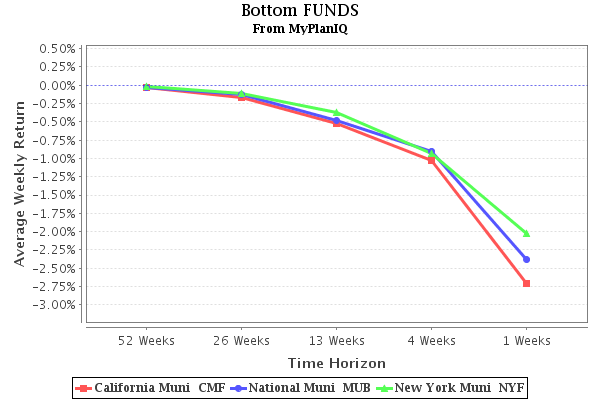
Yields on munis (MUB) also rose along with Treasuries as investors grappled with the ramifications of the likely end of the government-subsidized Build America Bond Program. As more states and cities rush to tap the tax-exempt debt market to raise funds before year-end, investors are concerned that, as a result of incremental supply, there will be a sell-off. Uncertainties around the extension of this popular program has triggered a great deal of volatility in the market and will remain to be the case until after the passage of the tax bill.
|
Assets Class |
Symbols |
12/10 Trend Score |
12/03 Trend Score |
Direction |
|
High Yield |
(JNK) |
4.33% |
4.81% |
v |
|
Emerging Mkt Bonds |
(PCY) |
2.82% |
3.14% |
v |
|
International Inflation Protected |
(WIP) |
2.12% |
2.65% |
v |
|
Long Term Credit |
(LQD) |
0.83% |
1.3% |
v |
|
International Treasury |
(BWX) |
0.54% |
0.98% |
v |
|
Short Term Credit |
(CSJ) |
0.53% |
0.85% |
v |
|
Intermediate Term Credit |
(CIU) |
0.43% |
1.37% |
v |
|
Short Term Treasury |
(SHY) |
0.21% |
0.46% |
v |
|
Treasury Bills |
(SHV) |
0.03% |
0.03% |
v |
|
US Total Bond |
(BND) |
-0.19% |
0.59% |
v |
|
Inflation Protected |
(TIP) |
-0.3% |
1.32% |
v |
|
Intermediate Treasury |
(IEF) |
-0.73% |
1.03% |
v |
|
10-20Year Treasury |
(TLH) |
-1.28% |
0.2% |
v |
|
MBS Bond |
(MBB) |
-1.71% |
-1.8% |
^ |
|
20+ Year Treasury |
(TLT) |
-2.28% |
-1.93% |
v |
|
New York Muni |
(NYF) |
2.91% |
-1.45% |
v |
|
National Muni |
(MUB) |
-3.5% |
-1.81% |
v |
|
California Muni |
(CMF) |
-3.93% |
-1.83% |
v |
click to enlarge images
Top Three indicators
Bottom Three Indicators
labels:investment,
Symbols:AGG,BND,BWX,CIU,CMF,CSJ,EMB,HYG,IEF,JNK,LQD,MBB,MUB,NYF,PCY,PHB,SHV,SHY,TIP,TLH,TLT,WIP,
comments
0
![]()
Or Start FREE 30-day trial now >>
