![]()
Super Businesses, Super Stocks
In this issue:
- Latest in Retirement Savings & Personal Finance
- Super Businesses, Super Stocks
- Tools & Tips: Return Comparison Calculator
- Market Overview
Latest in Retirement Savings & Personal Finance
78% Americans’ Primary Retirement Income is Social Security
Here are some breakdowns for the role of Social security benefit for retirement income:
- 78% of retirees rely on Social Security as their primary income source
- Only 19% of current workers have access to defined benefit pensions . This is down from 38% in 1980
- Nearly 25% of retirement savers have less than one year’s income saved
- Social Security replaces about 40% of pre-retirement earnings on average. For low- and middle-income households, it replaces up to 76% of prior earnings
- 73% of non-retirees fear Social Security benefits will be reduced or unavailable as Social Security Trustees project possible 21% benefit cut by 2033 without reform
In a word, Social security benefit is essential for majority Americans.
Top US Companies with the Best Parental Leave Policies
Here are the top 10 best companies that have generous parental leave policies for both primary and secondary caregivers):
- Netflix: Up to 52 weeks (1 year) of fully paid leave for new parents (primary caregivers), with most taking 4-8 months. Includes unlimited flexibility and covers all genders/paths to parenthood. Recognized as the “gold standard” in multiple 2025 reports for retention impact.
- Hewlett Packard Enterprise (HPE): 26+ weeks fully paid for primary caregivers (both genders); secondary caregivers get similar access. Women average 33 weeks, men 30 weeks—highest utilization rates in Fortune’s 2025 Best Companies list. Expanded in 2019 with backup childcare support.
- Snowflake: 26 weeks fully paid for all parents (primary/secondary), plus fertility benefits and wellness support. Leads JUST Capital’s 2025 rankings for equal access across caregivers
- Dropbox: 24 weeks fully paid, plus a “transition week” for return-to-work and up to $10,000 adoption reimbursement (per child, up to 2 adoptions). Tops 2025 Built In lists for family-building support.
- S&P Global: 24 weeks fully paid for primary and secondary caregivers. Highlighted in NPWF’s 2025 report for transparent, inclusive policies covering extended family care.
- Lululemon Athletica: Up to 26 weeks fully paid globally (all levels/roles), with mental health resources for returnees. Unique retail leader in JUST Capital’s 2025 analysis.
- Zoom Video Communications: 24 weeks fully paid for both primary and secondary caregivers. Excels in 2025 indexes for low barriers (day-one eligibility) and intermittent leave options.
- Microsoft: 20 weeks fully paid for birthing parents; 12 weeks for non-birthing/adoptive. Includes adoption assistance and back-up care; strong in Employee Benefit News’ 2025 rankings
- Amazon: 20 weeks fully paid (4 prepartum + 10 maternity + 6 parental), stackable with PTO. Covers all parents; noted in Reddit/Glassdoor crowdsourced 2025 data for high usage.
- Deloitte: 16 weeks fully paid parental leave, stackable with short-term disability/PTO for up to 24 weeks total. Leads consulting firms in InHerSight’s September 2025 women-rated list.
We applaud companies to give back what they make to their employees!
Big Short Investor Michael Burry Took Bearish Bet
Famous in his timely short against the US housing market that was featured in popular movie ‘Big Short’, Michael Burry has made another major bearish short, this time, against the bubbly AI tech companies:
His Q3 hedge fund holding filing reveals new put (betting a stock price to go down) option on 5 million Palantir (PLTR) shares, which has notional value $912 millions and 1 million Nvidia (NVDA) shares ($187 millions). Of course, shorting stocks is a tough feat: Burry has made various shorts in the past, many haven’t had positive results. Burry had high profile Tesla short which was way too early, for example.
On the other hand, Burry’s action does remind us that markets are at some speculative levels, especially those high flying AI stocks. Managing and reviewing your retirement portfolios accordingly to trim down excessive over exposure to risk assets such as stocks.
Super Businesses, Super Stocks
In general, the strength of a company’s business is eventually reflected in its stock returns. However, we all know stock prices are highly volatile and often subject to rampant speculation. Warren Buffett once said, “In the short run, the market is a voting machine, but in the long run, it is a weighing machine.” What this implies is that a stock’s price at any particular moment might be driven more by its popularity (contesting, anyone?). But in the long run, the price will eventually reflect the weight of its underlying business, thus making the stock market a weighing machine.
Here we might add that the “long run” should mean at least 20 years, or even longer.
In the following, we present the top 10 super businesses, or super stocks, over the really long run — 50 years.
| Symbol | Name | 1YrCAGR | 3YrCAGR | 5YrCAGR | 10YrCAGR | 15YrCAGR | 20YrCAGR | 25YrCAGR | 30YrCAGR | 35YrCAGR | 40YrCAGR | 45YrCAGR | 50YrCAGR |
| MDU | MDU Resources Group, Inc. | 25.21% | 25.04% | 19.99% | 13.68% | 9.75% | 7.39% | 8.98% | 10.76% | 11.60% | 17.47% | 24.83% | 23.09% |
| MCD | McDonald’s Corporation | 6.16% | 5.93% | 9.74% | 13.19% | 12.48% | 15.16% | 12.30% | 11.79% | 13.88% | 14.43% | 22.57% | 21.17% |
| WMT | Walmart Inc. | 26.85% | 30.85% | 18.84% | 20.47% | 14.61% | 12.05% | 10.04% | 13.53% | 13.19% | 15.43% | 19.19% | 20.28% |
| CSL | Carlisle Companies Incorporated | -22.07% | 12.13% | 22.66% | 15.51% | 17.59% | 13.65% | 13.40% | 13.91% | 15.88% | 15.02% | 13.45% | 17.71% |
| HUBB | Hubbell Incorporated | 10.28% | 27.37% | 28.62% | 19.59% | 18.04% | 14.78% | 15.76% | 12.65% | 22.49% | 22.50% | 20.01% | 17.48% |
| LMT | Lockheed Martin Corporation | -7.78% | 2.93% | 9.91% | 11.24% | 17.27% | 14.25% | 14.00% | 12.01% | 15.37% | 12.36% | 14.95% | 16.36% |
| ETN | Eaton Corporation plc | 13.20% | 38.79% | 32.17% | 24.27% | 18.66% | 16.83% | 17.83% | 16.10% | 17.06% | 15.66% | 15.81% | 15.83% |
| SPGI | S&P Global Inc. | 1.89% | 16.22% | 9.69% | 19.37% | 20.61% | 14.24% | 13.64% | 15.83% | 15.85% | 14.42% | 14.82% | 15.70% |
| SYY | Sysco Corporation | 3.36% | -2.18% | 8.96% | 8.94% | 9.44% | 7.39% | 7.02% | 10.58% | 11.10% | 13.74% | 15.20% | 15.66% |
| MSA | MSA Safety Incorporated | -4.85% | 6.69% | 4.83% | 15.32% | 14.42% | 9.20% | 15.94% | 14.42% | 12.75% | 13.56% | 12.59% | 15.41% |
Well, many of these companies are household names. These include McDonald’s, Walmart and Lockheed Martin. The stock returns of the top three companies, MDU Resources, McDonald’s and Walmart, are extremely impressive, as all have achieved more than 20% annualized returns. As a reference, Warren Buffett’s Berkshire Hathaway is estimated to have returned about 20% annually over the past 50 years. Unlike the three companies, Berkshire Hathaway relies on a combination of its own businesses and its shrewd investments in other stocks to achieve this superior return.
For returns in other time periods and detailed discussion, see this article.
Tools & Tips: Return Comparison Calculator
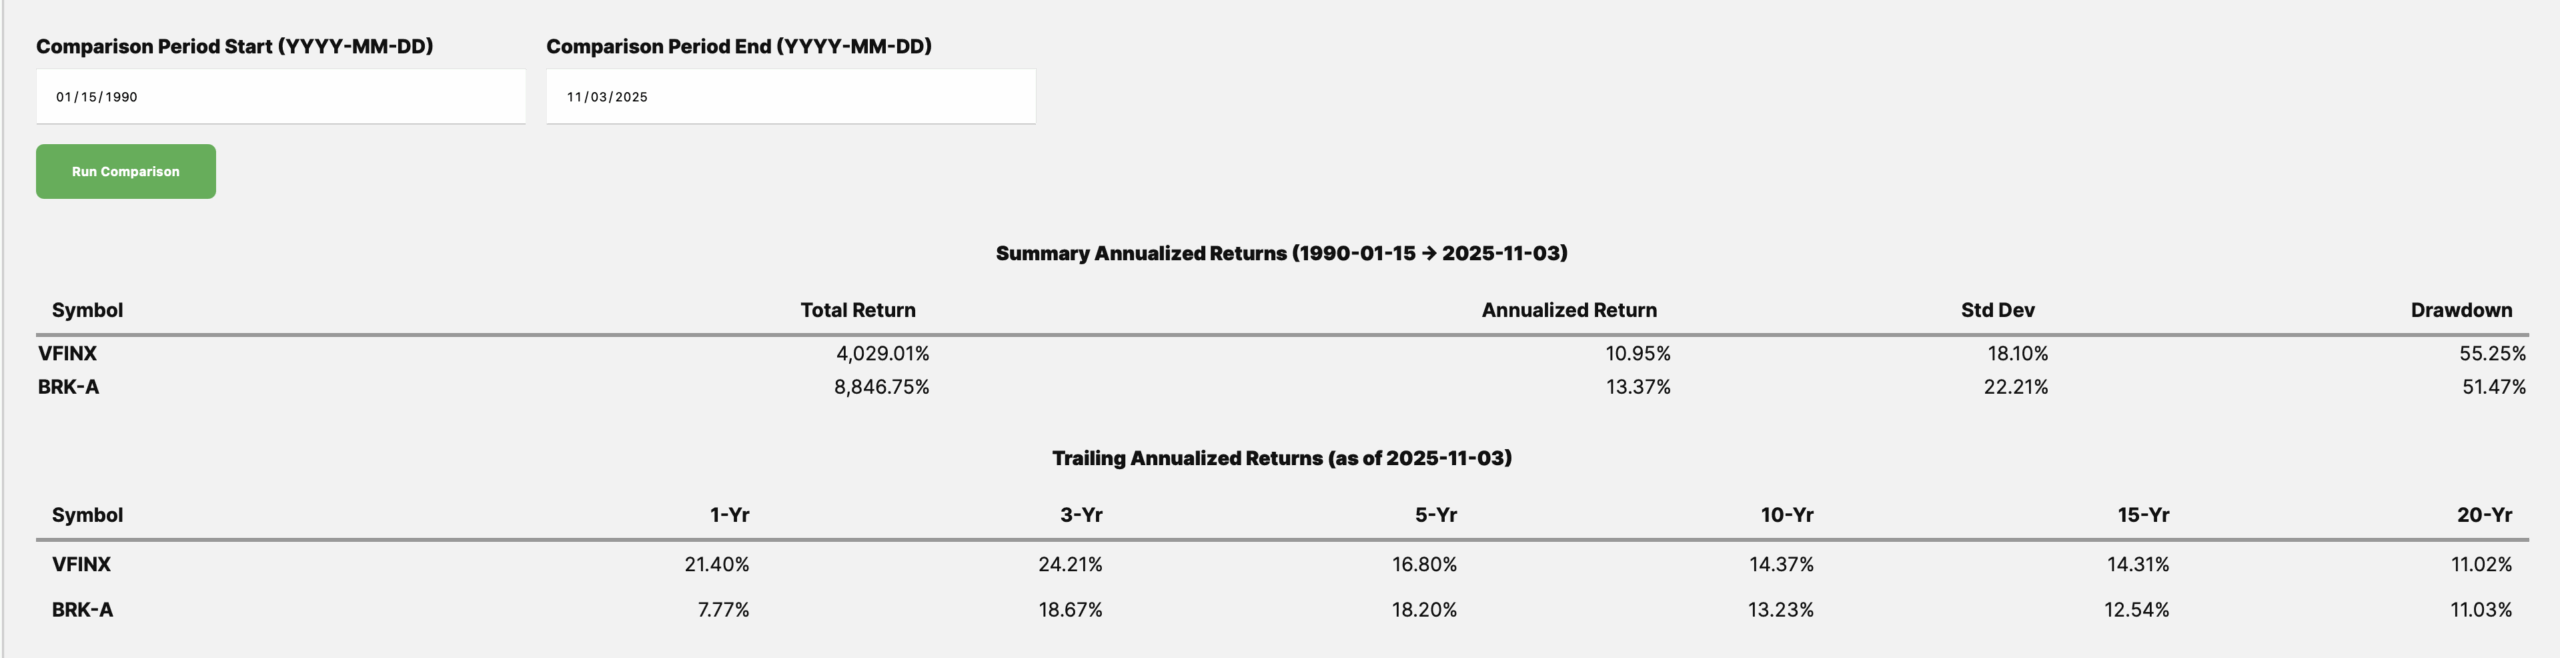
Many people have trouble to calculate or compare stock returns, this is especially true for a desired period. Our Return Comparison Calculator let you input a custom period and see not only the returns and other statistics in that period, it also allows you to look back from a particular date and evaluate how these stocks or funds or even portfolios have done in their trailing 1,3,5,10,15, and 20 year periods from that date. This allow you to understand how an investor would have felt at that particular historical moment.
Example:
Berkshire Hathaway BRK-A at this moment underperformed S&P 500 index (VFINX) for the past 1,5,10,15 years:
However, if we specify the period that ends 15 years ago on 11/3/2010, we would have the following:
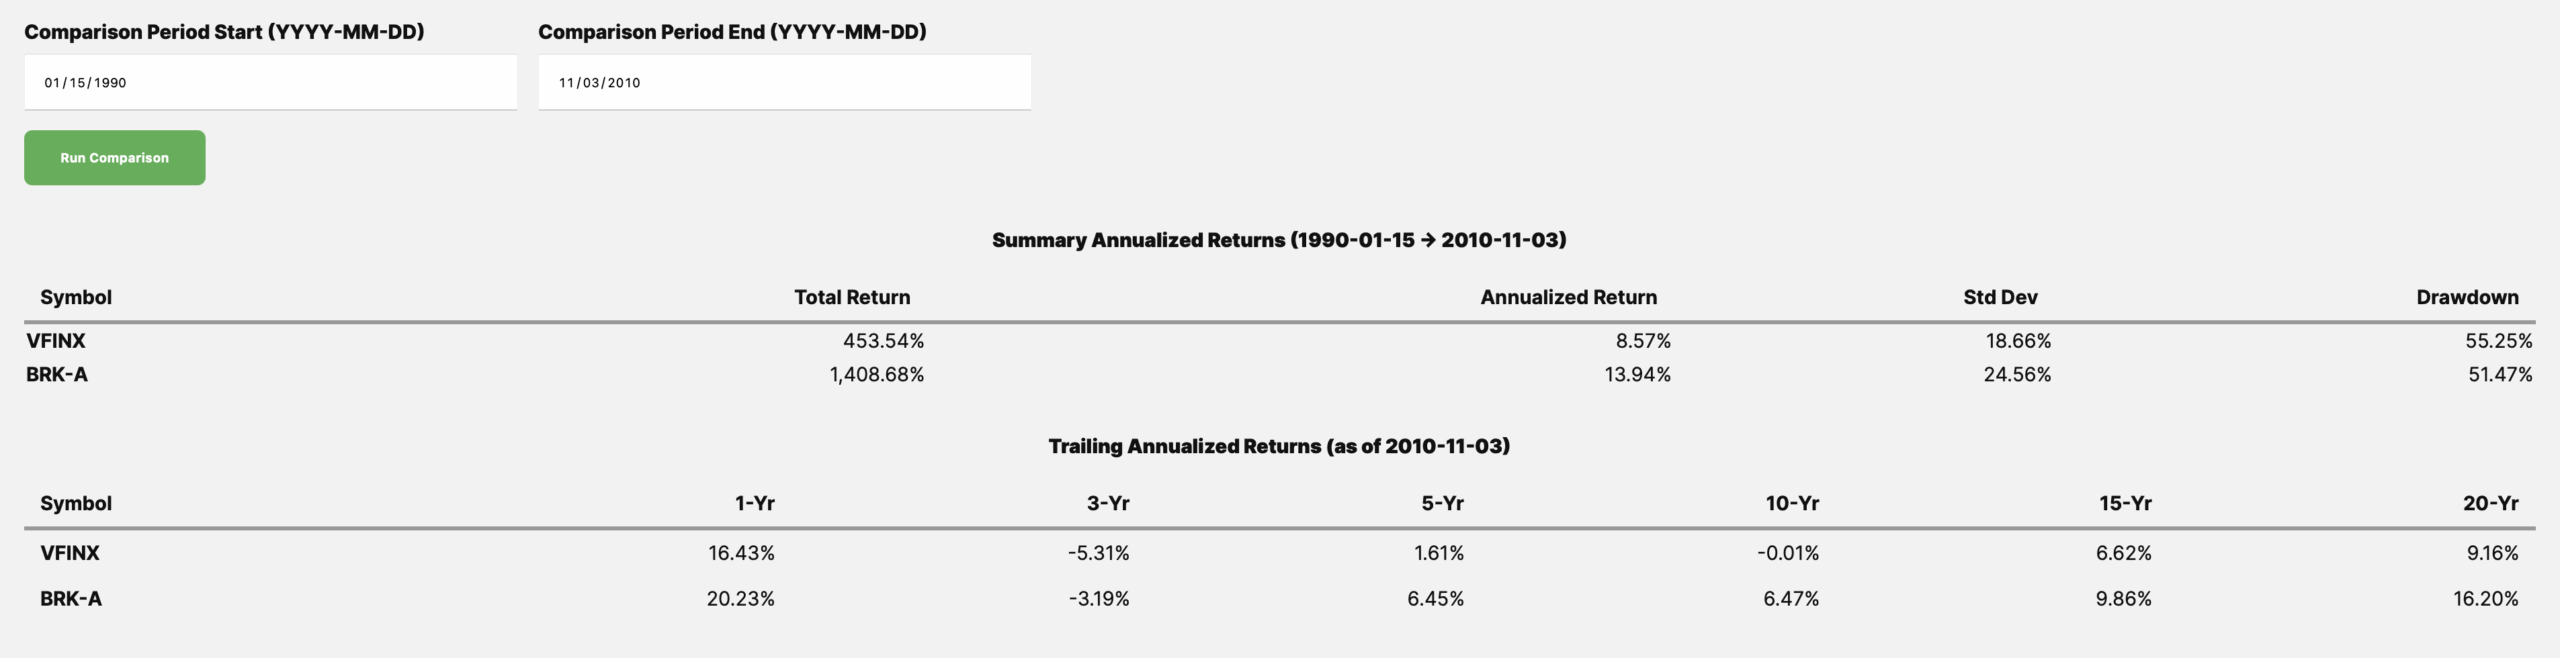
So BRK-A soundly beat S&P 500 for all periods if you were in 2010.
This tool can be useful for anyone who’s interested in not just returns from current dates but from some other times before. It gives a good perspective on how things have happened in the past.
|
Market Overview
Stocks rose last week, though rate sensitive sectors like REITs took a big hit as the Federal Reserve signalled that it’s not firm to have another interest rate cut in December.
The following table shows the major asset price returns and their trend scores, as of this Monday:
| Asset Class | 1 Weeks | 4 Weeks | 13 Weeks | 26 Weeks | 52 Weeks | Trend Score |
|---|---|---|---|---|---|---|
| US Stocks | 0.7% | 1.9% | 9.9% | 21.0% | 20.8% | 10.9% |
| Foreign Stocks | -0.3% | 0.1% | 10.0% | 16.3% | 24.3% | 10.1% |
| US REITs | -3.5% | -2.5% | 1.2% | 1.2% | -0.6% | -0.9% |
| Emerging Market Stocks | -0.5% | 0.1% | 11.3% | 19.2% | 21.0% | 10.2% |
| Bonds | -0.6% | 0.1% | 1.7% | 3.9% | 6.1% | 2.2% |
More detailed returns and trend scores can be found on MyPlanIQ.com Market Overview.