![]()
2025 Crystal Ball Market Prediction Scorecard
We Wish Everyone Happy Holidays!
We will return with our publications in the New Year.
In this issue:
- Latest in Retirement Savings & Personal Finance
- 2025 Crystal Ball Market Prediction Scorecard
- Tools & Tips: Roth Conversion Glidepath Calculator
- Market Overview
Latest in Retirement Savings & Personal Finance
Warren Buffett’s 70 Year Returns
Well, the Oracle of Omaha is drawing near the end of his investment career. However, Buffett’s almost 70 years of investment career is unmatched, in terms of both returns and the length of time. Here are the numbers:
Annualized Returns (CAGR, dividend reinvested) from 1957 to 2025:
- Warren Buffett: 20.1%
- S&P 500: 10.6%
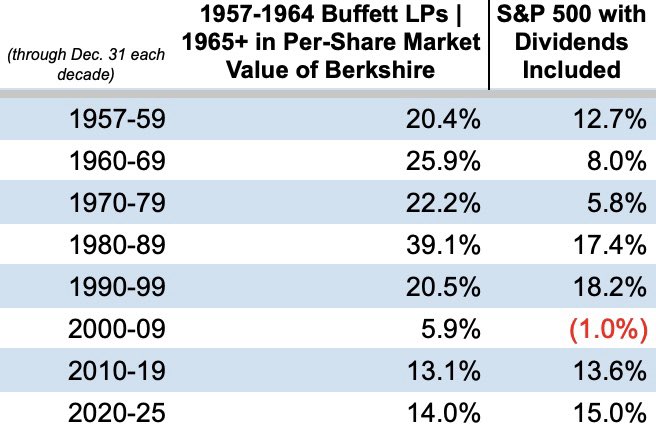
One rule of thumb: if you see anyone’s returns exceed 20% annually, odds are that those returns are not sustainable in the long term. A 20% annual return is the ceiling.
What to Do with Your Bonus
- Eliminate High-Interest Debt
Paying off credit cards or other high-interest debt delivers a guaranteed return that no investment can reliably match. Clearing these balances also reduces financial stress immediately. - Build an Emergency Fund
Set aside cash for unexpected expenses, starting with one month of living costs and working toward six months. Keep it in a high-yield savings account so it stays liquid but still earns interest. - Maximize 401(k) Contributions
Boosting your 401(k) contribution rate, especially to capture the full employer match. This is the free money everyone shouldn’t miss. Then maximize your before tax savings if it’s possible. - Maximize Roth IRA Contributions
Contributing to a Roth IRA allows your money to grow tax-free over the long term. Even a single contribution can compound significantly over decades. - Invest, Invest, and Invest!
Once core financial needs are covered, invest extra money in low-cost, diversified funds. Simplicity and low fees matter more than chasing complex strategies. - Understand Bonus and Gift Taxes
Bonuses are taxed as regular income and may feel heavily withheld at first. Cash gifts from family, however, are generally tax-free to the recipient. - Use Small Windfalls to Build Long-Term Wealth
While not life-changing on their own, bonuses and gifts can meaningfully impact your finances if used consistently and wisely. Over time, these decisions compound into real wealth.
Crypto Crashes at Year End
Crypto’s speculative nature shows up in price action more than fundamentals, and this year’s end is no different. Bitcoin peaked above roughly $126,000 in October but has since erased those gains, sliding toward the mid-$80,000s, leaving it down about 30 percent from its peak and wiping out most of its 2025 advance. Altcoins and related stocks have also fallen sharply, highlighting how quickly sentiment and liquidity can reverse in these markets.
Even with a supportive Administration and clearer regulatory signals, that’s not enough to steady an asset driven mostly by speculation and momentum. When risk appetite ebbs at the end of the year and leveraged positions unwind, policy backing alone does not stop rapid declines in price. Cryptocurrencies remain fundamentally volatile and sentiment dependent rather than anchored in stable cash flows or traditional valuation anchors. So tread carefully.
2025 Crystal Ball Market Prediction Scorecard
As we are now only two weeks to the end of 2025 and many Wall Street analysts have been busy putting out new year 2026 predictions, Let’s review how these popular financial professionals have performed up to now.
Where we stand (so far):
- S&P 500 level: 6,827.41 (as of Dec 12, 2025)
- S&P 500 close: 5,881.63 (Dec 31, 2024)
- 2025 gain so far: about +16.1% (price-only, through Dec 12)
The tallies: how accurate were they?
- Total targets scored: 23
- Directionally (most were too low): 19 of 23 targets were below where the market landed so far; 4 of 23 were above.
- Accuracy buckets (absolute % error):
- Within 2%: 4 strategists
- Within 3%: 9 strategists
- Within 5%: 19 strategists
- Worse than 10%: 2 strategists (and one was way off)
- Forecast spread: 4,450 to 7,100 (a 2,650-point gap)
The more important point: forecasts didn’t just miss—they moved
Even if a target ends up “close,” the path matters—because most investors don’t hold steady when headlines get loud.
Example: In April 2025, multiple firms cut targets sharply amid tariff/trade-war turmoil:
- Bank of America: 5,600 (from 6,666)
- Evercore: 5,600 (from 6,800)
- Oppenheimer: 5,950 (from 7,100)
- JPMorgan: 5,200 (from 6,500)
Later, some targets re-inflated. For example, Oppenheimer raised back to 7,100 by late July 2025 after previously cutting to 5,950.
See more detailed data in this article.
The lessons: forecasts are not investment strategies. They are not consistent and fickle. Furthermore, no one can score well. So stick to known stragegies like these and be disciplined. Treat forecasts as stress testing but do not act on them impulsively.
|
Tools & Tips: Roth Conversion Glidepath Calculator
The Roth Conversion Glidepath Planner (Calculator) maps annual Roth conversions against bracket thresholds, IRMAA cliffs, RMD start dates, and state taxes. Users enter current IRA/401(k) balances, projected returns, pension/SSI start years and estimated benefit amount, medical premiums, and desired cash-flow floor. Outputs: optimal yearly conversion amount, estimated lifetime tax paid vs. deferred, projected Medicare surcharges, and net after-tax retirement income.
Here is an example:
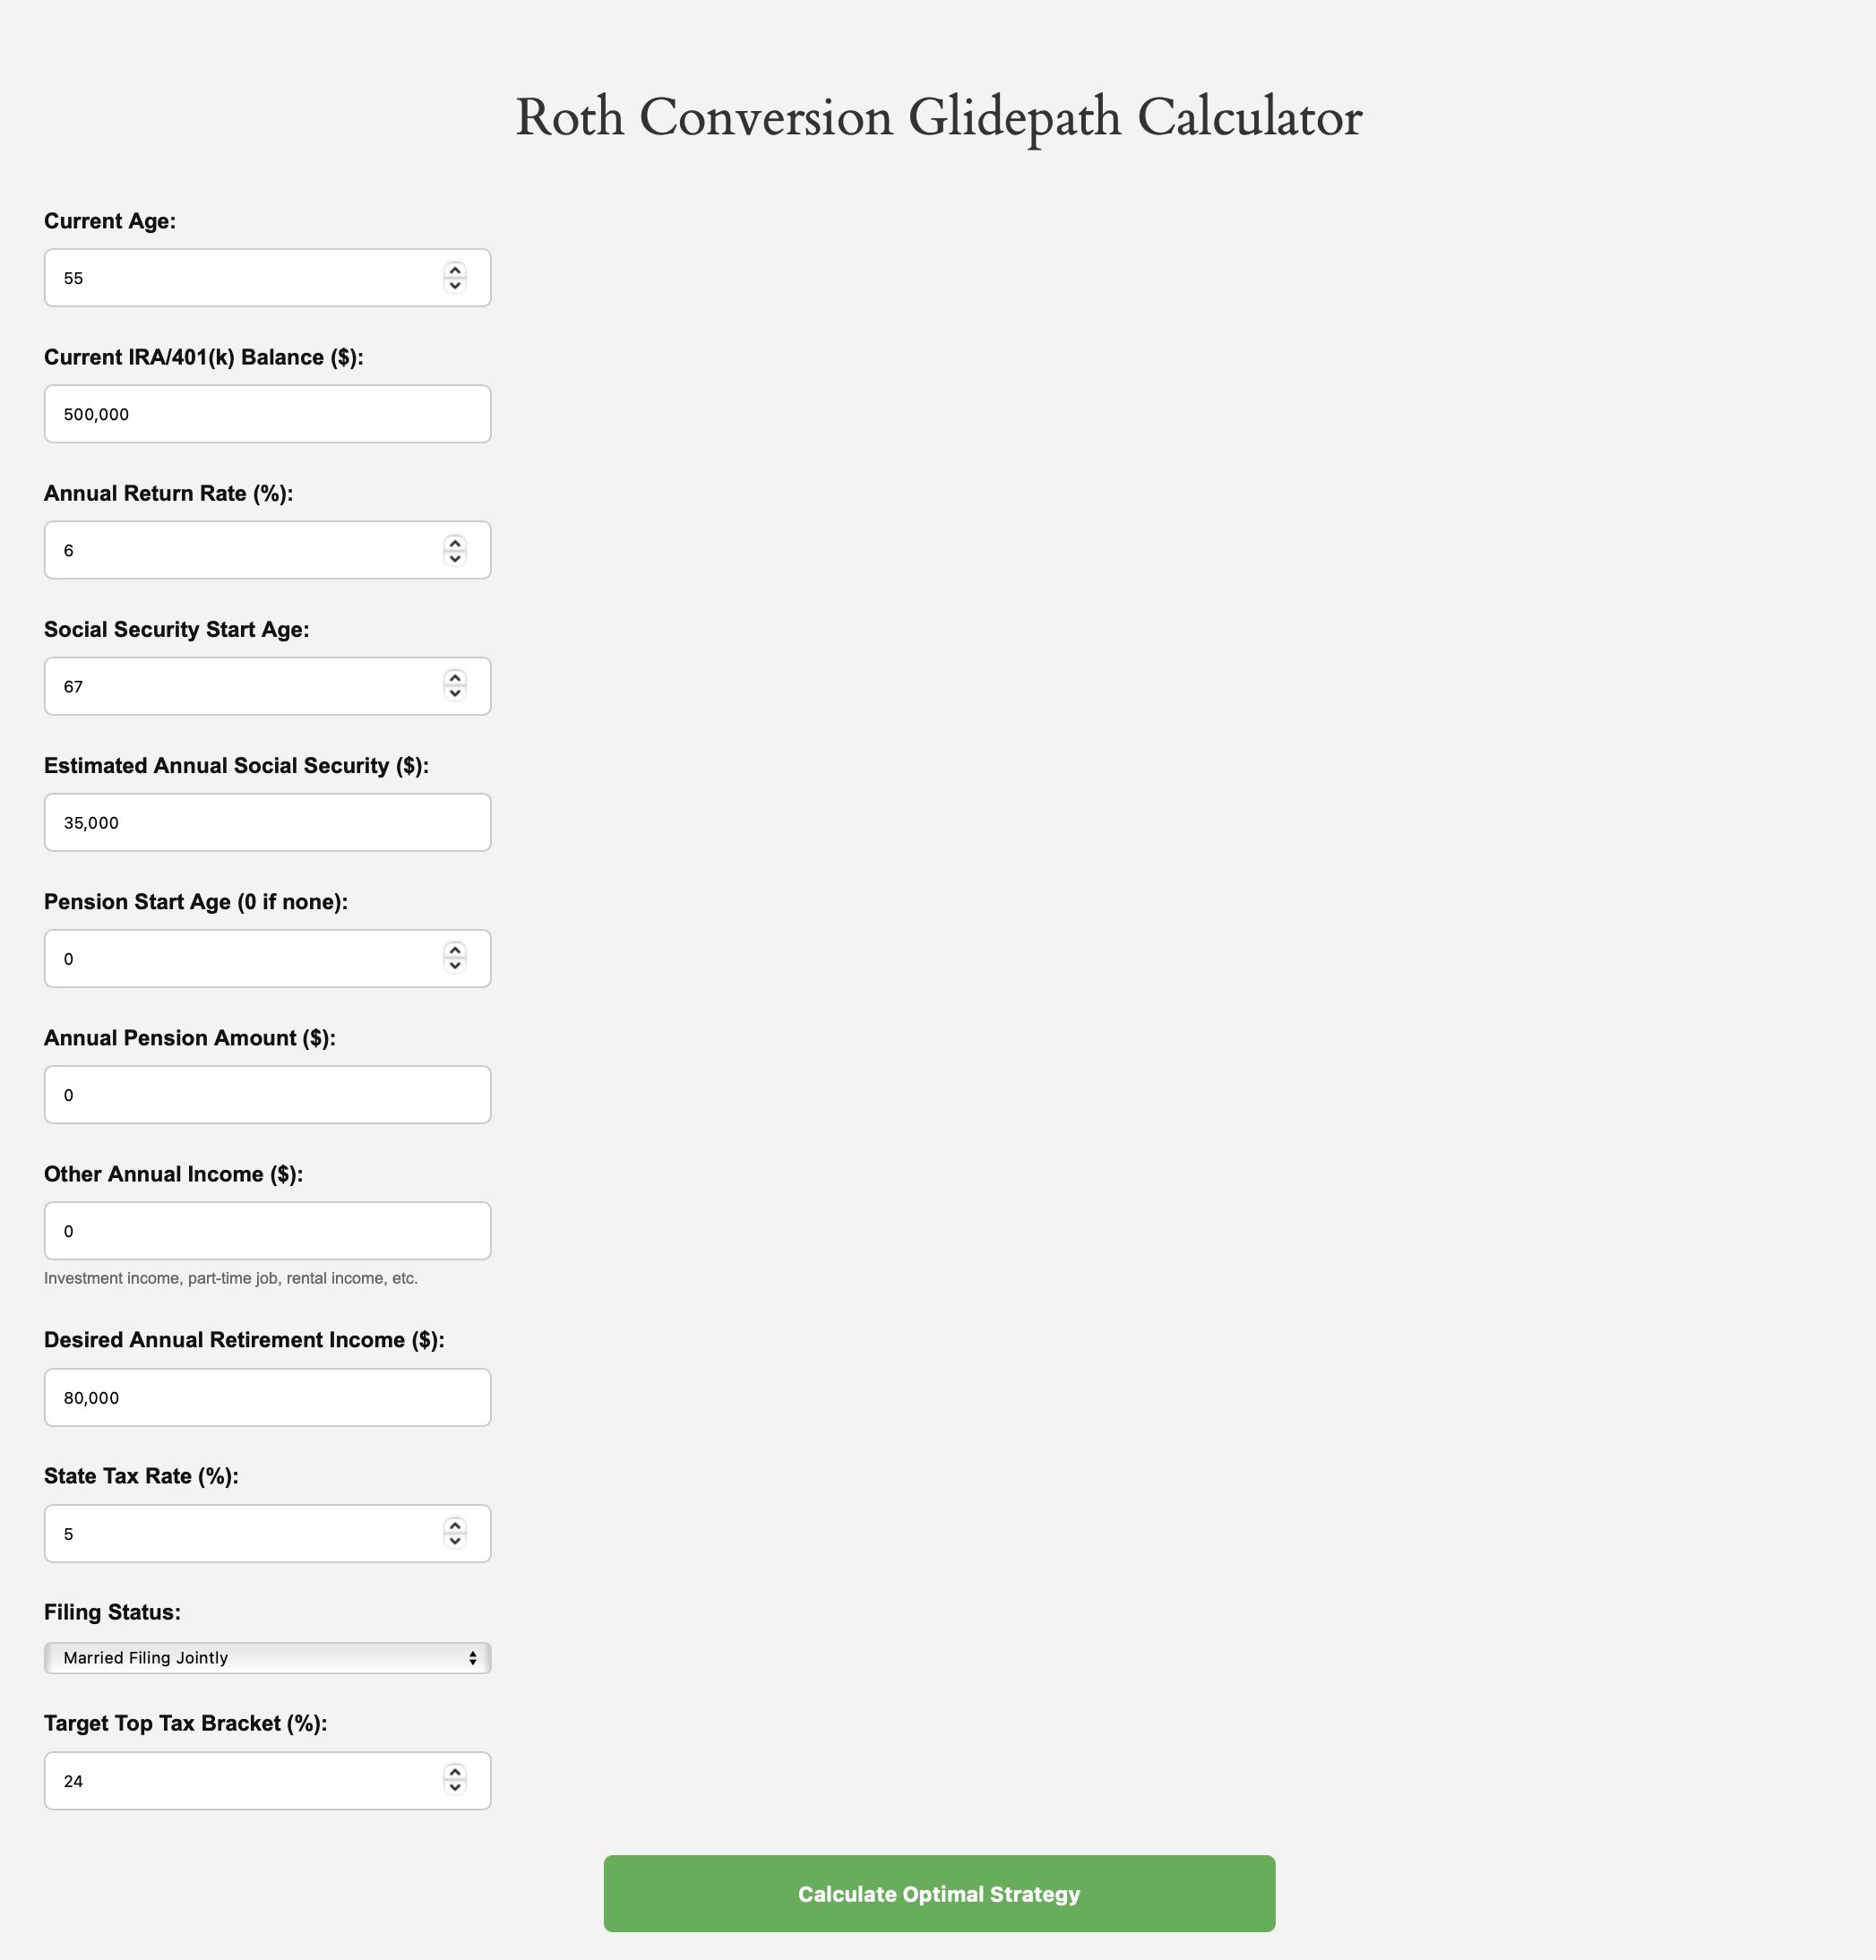
and the results for the above inputs ($500K IRA balance to convert, 55 year old):
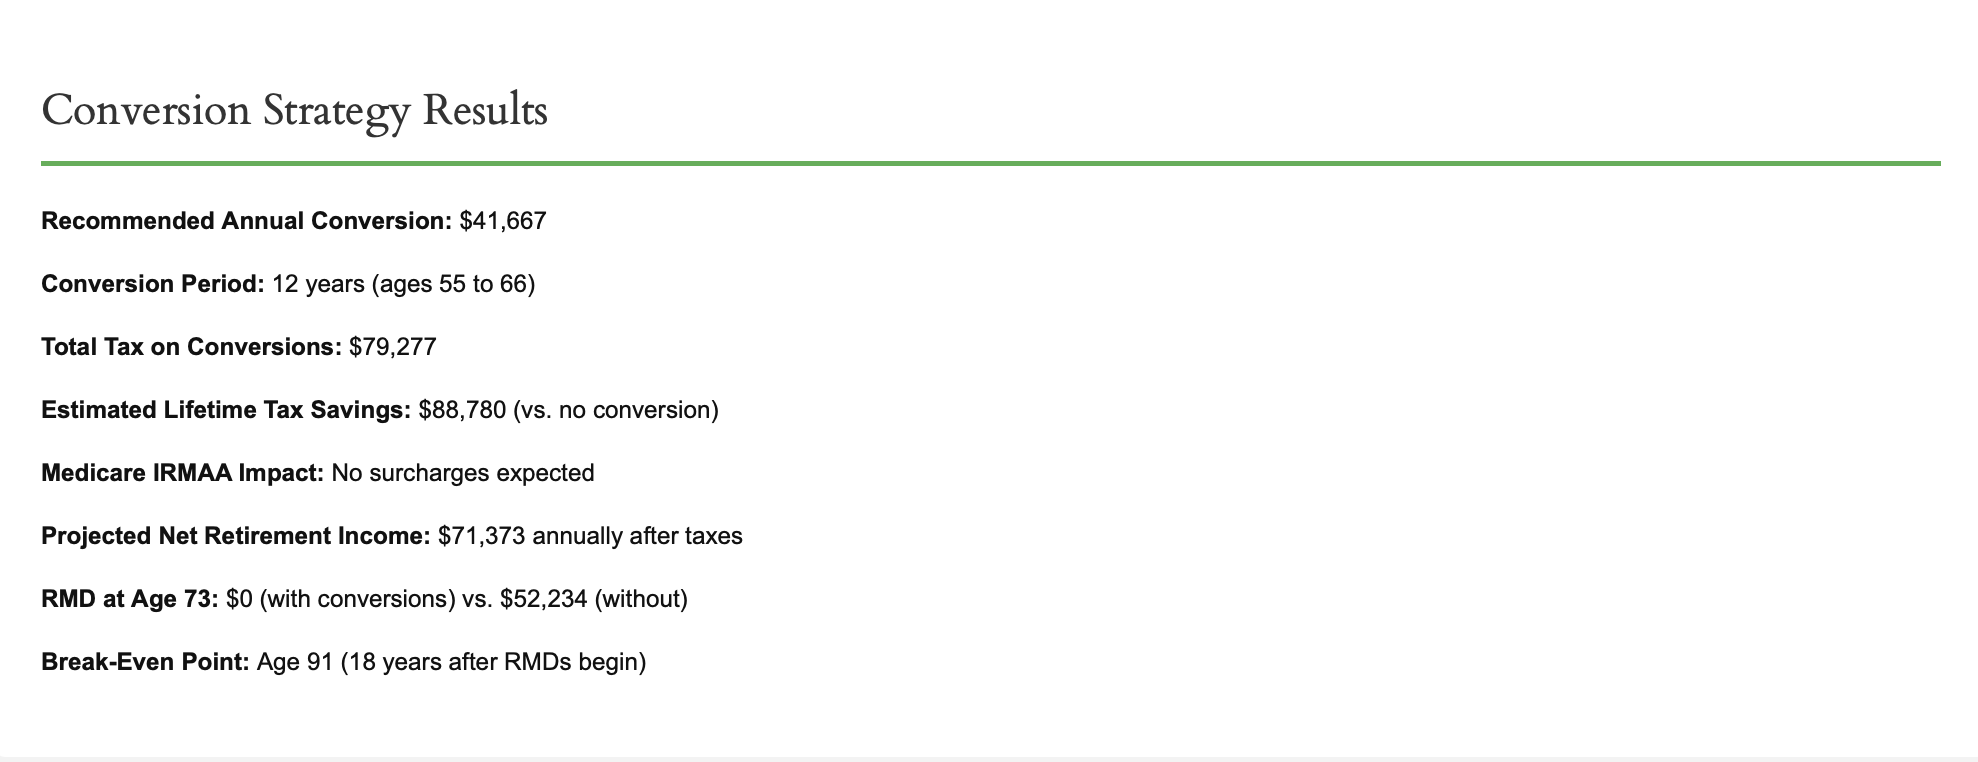
In this case, with 12 years planned conversion, this person manages to reduce RMD (Required Minimum Dirstribution) amount to be 0!
This tool can be very useful for anyone who wants to have a planned conversion path. It could be even useful for young or mid age professionals to perform calculated conversions to minimize taxes. See Roth Conversion Glidepath Planner (Calculator) for more detailed explanation for the above example.
|
Market Overview
Stocks and crypto currencies continued their retreat as investors are fretting over the possible Fed chairman choice and the elevated stock valuation, especially for AI related companies. However, investors are still pinning hope for a year end rally after the Fed cut interest rates by 0.25% last week.
The following table shows the major asset price returns and their trend scores, as of last Friday:
| Asset Class | 1 Weeks | 4 Weeks | 13 Weeks | 26 Weeks | 52 Weeks | Trend Score |
|---|---|---|---|---|---|---|
| US Stocks | -0.4% | 2.3% | 3.3% | 13.6% | 13.5% | 6.5% |
| Foreign Stocks | 0.8% | 2.4% | 3.6% | 12.2% | 27.1% | 9.2% |
| US REITs | 0.6% | 1.0% | -2.2% | 1.7% | -0.4% | 0.1% |
| Emerging Market Stocks | -0.7% | -0.8% | 0.7% | 11.3% | 19.6% | 6.0% |
| Bonds | 0.0% | 0.2% | 0.2% | 4.2% | 5.8% | 2.1% |
More detailed returns and trend scores can be found on MyPlanIQ.com Market Overview.