![]()
2024 Millionaire Retirement Plans
In this issue:
- Latest in Retirement Savings & Personal Finance
- 2024 Millionaire Retirement Plans
- Tools & Tips: Historical Stock Dividend Yield Chart
- Market Overview
Latest in Retirement Savings & Personal Finance
Gold’s Sudden Swoon
Well, that didn’t age well for our last week’s Glittering Gold report: last week the price of gold took a sharp downturn, falling more than 5 percent in just a day after reaching record highs. The decline appears triggered by a stronger U.S. dollar and hopes for a thaw in U.S.–China trade tensions, which dampened demand for the metal as a safe haven. Despite the pullback, the asset remains well up this year, so this might be more a correction than a collapse. But for investors who climbed on late, the timing may feel less confident now than it did a week ago.
This is also a big reminder to anyone who thinks gold and those AI darling stocks can only go up. Risk abound after a big parabolic rise. So don’t chase and just stick to your diversifited investment plan.
Social Security Benefit COLA Adjustment in 2026
Over the past decade, the COLA (Cost of Living Adjustment) increase averaged roughly 3.1 percent. In 2025, it was 2.5 percent, not too far off but still below the long-term average. Now, with the 2026 bump, Social Security benefits will go up by about $56 a month starting January. It’s not a big number when you first look at it, maybe not even enough to offset a few grocery runs. But for many retirees who depend solely on these checks, that extra bit means a small relief, a little more breathing room. Sometimes that’s all that matters, especially when prices quietly creep up everywhere else.
A Gentle Reminder on Estate Planning
During Estate Planning Awareness Week, Jill on Money reminded readers that only about one in four Americans actually has a will. When families stay silent, state laws simply decide who gets what, often in ways no one intended. Her short guide goes over the basic documents that can prevent confusion later on, like a simple will with named guardians, a health care proxy, a durable power of attorney, and a letter of instruction listing accounts, insurance, and automatic payments. It’s not complicated work, but it’s the kind most people keep putting off until it’s too late.
When Wages Fall Behind and the Middle Class Shrinks
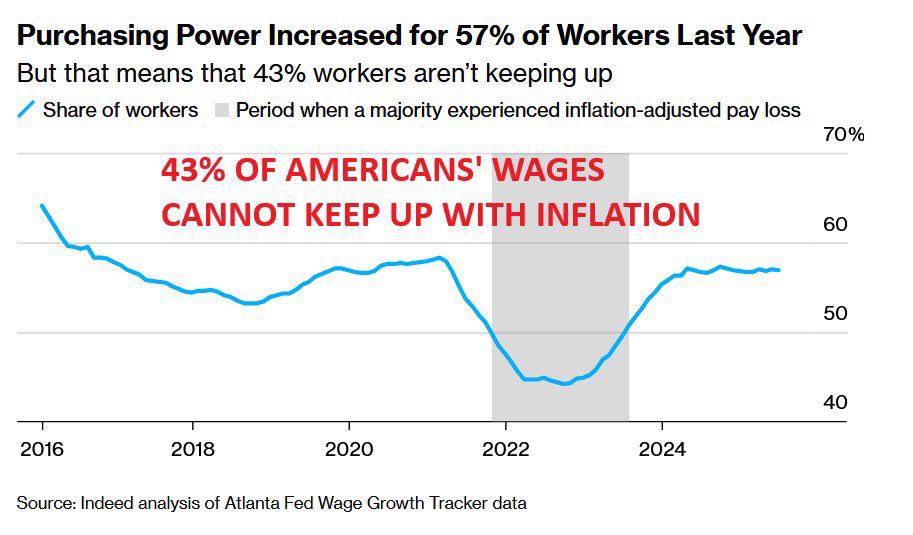
The latest numbers show that 57 percent of workers gained some purchasing power last year, but 43 percent still could not keep up with inflation. At the same time, the middle class has quietly thinned out. Back in 1971, about 61 percent of Americans were considered middle income. By 2023, that number had dropped to around 51 percent. It doesn’t sound dramatic until you realize what it means in everyday life. The middle ground that once felt stable is getting smaller, and more people are being pulled to the edges. For many, it feels harder to stay in place, even when they are doing everything right.
2024 Millionaire Retirement Plans
MyPlanIQ recently did a study on all year 2024 retirement plans. We identified the top retirement plans that have the highest average participant account value. We limited our study in plans that have at least 100 participants.
The following is the top 20 plans with the highest account value per participant:
| Rank | Retirement Plan | Sponsor | Average Account Value |
|---|---|---|---|
| 1 | Lone Pine Capital LLC 401(k) Profit Sharing Plan | Lone Pine Capital LLC | $1,612,021 |
| 2 | Anesthesia Service Medical Group, Inc. 401(k) Profit Sharing Plan Trust | Anesthesia Service Medical Group, Inc. | $1,240,779 |
| 3 | Medical Center Emergency Services Retirement Savings Thrift Plan | Medical Center Emergency Services | $1,217,978 |
| 4 | Crescent River Port Pilots’ Association 401(k) Retirement Plan | Crescent River Port Pilots’ Association | $1,172,843 |
| 5 | Irell & Manella Profit Sharing Plan | Irell & Manella LLP | $1,003,150 |
| 6 | Anesthesia Consultants of Indianapolis, LLC 401(k) Profit Sharing Plan | Anesthesia Consultants of Indianapolis, LLC | $975,046 |
| 7 | Fond du Lac Regional Clinic, S.C. 401(k) Profit Sharing Plan | Fond du Lac Regional Clinic, S.C. | $967,649 |
| 8 | Wasatch Advisors, LP Deferred Profit Sharing Plan and Trust | Wasatch Advisors, LP | $924,154 |
| 9 | Dodge & Cox Profit Sharing Plan | Dodge & Cox | $912,271 |
| 10 | National Exchange Carrier Association Retirement Savings Plan | National Exchange Carrier Association, Inc. | $893,253 |
| 11 | TI 401(k) Savings Plan | Texas Instruments Incorporated | $882,313 |
| 12 | Employee Savings and Stock Ownership Plan of General Re Corp and its Domestic Subsidiaries | General Re Corporation | $862,746 |
| 13 | Kleinberg, Kaplan, Wolff & Cohen, P.C. 401(k) Profit Sharing Plan | Kleinberg, Kaplan, Wolff & Cohen, P.C. | $860,649 |
| 14 | Zeta Associates Incorporated Savings Plan | Zeta Associates | $829,709 |
| 15 | Anesthesia Consultants of Indianapolis, LLC 401(k) Profit Sharing Plan | Anesthesia Consultants of Indianapolis, LLC | $804,322 |
| 16 | Jennison Associates Savings Plan | Jennison Associates LLC | $797,881 |
| 17 | Nutter, McClennen & Fish, LLP Lawyers Retirement Plan | Nutter, McClennen & Fish, LLP | $792,777 |
| 18 | Carter Ledyard & Milburn LLP 401(k) Retirement Plan | Carter Ledyard & Milburn LLP | $778,761 |
| 19 | Medical Anesthesia Group, P.A. Profit Sharing Plan | Medical Anesthesia Group, P.A. | $754,092 |
| 20 | Bayerische Landesbank NY Employees Retirement Plan | Bayerische Landesbank | $747,774 |
Ultra-high balances are concentrated in boutique asset managers, physician collectives, and specialized professional firms, indicating high earnings plus aggressive profit-sharing or employer match. This is not surprising at all. We all know that money managers, physicians, and lawyers are usually high-income groups.
See The Quiet Millionaires of 2024: What Sets These Retirement Plans Apart for more details.
Tools & Tips: Historical Stock Dividend Yield Chart
Dividend yield for a stock or an ETF is useful information. For one, it helps to know how much a company has distributed from its earnings to its shareholders. Furthermore, the yield percentage also somewhat indicates how over- or undervalued a stock might be. When a company’s stock price goes up, its yield percentage goes down, and vice versa. So the higher the yield is, the lower the valuation could be.
MyPlanIQ’s quote page has such a useful info. Below is the historical trailing 12m (12 month) yield history chart per share for S&P 500 index fund SPY:
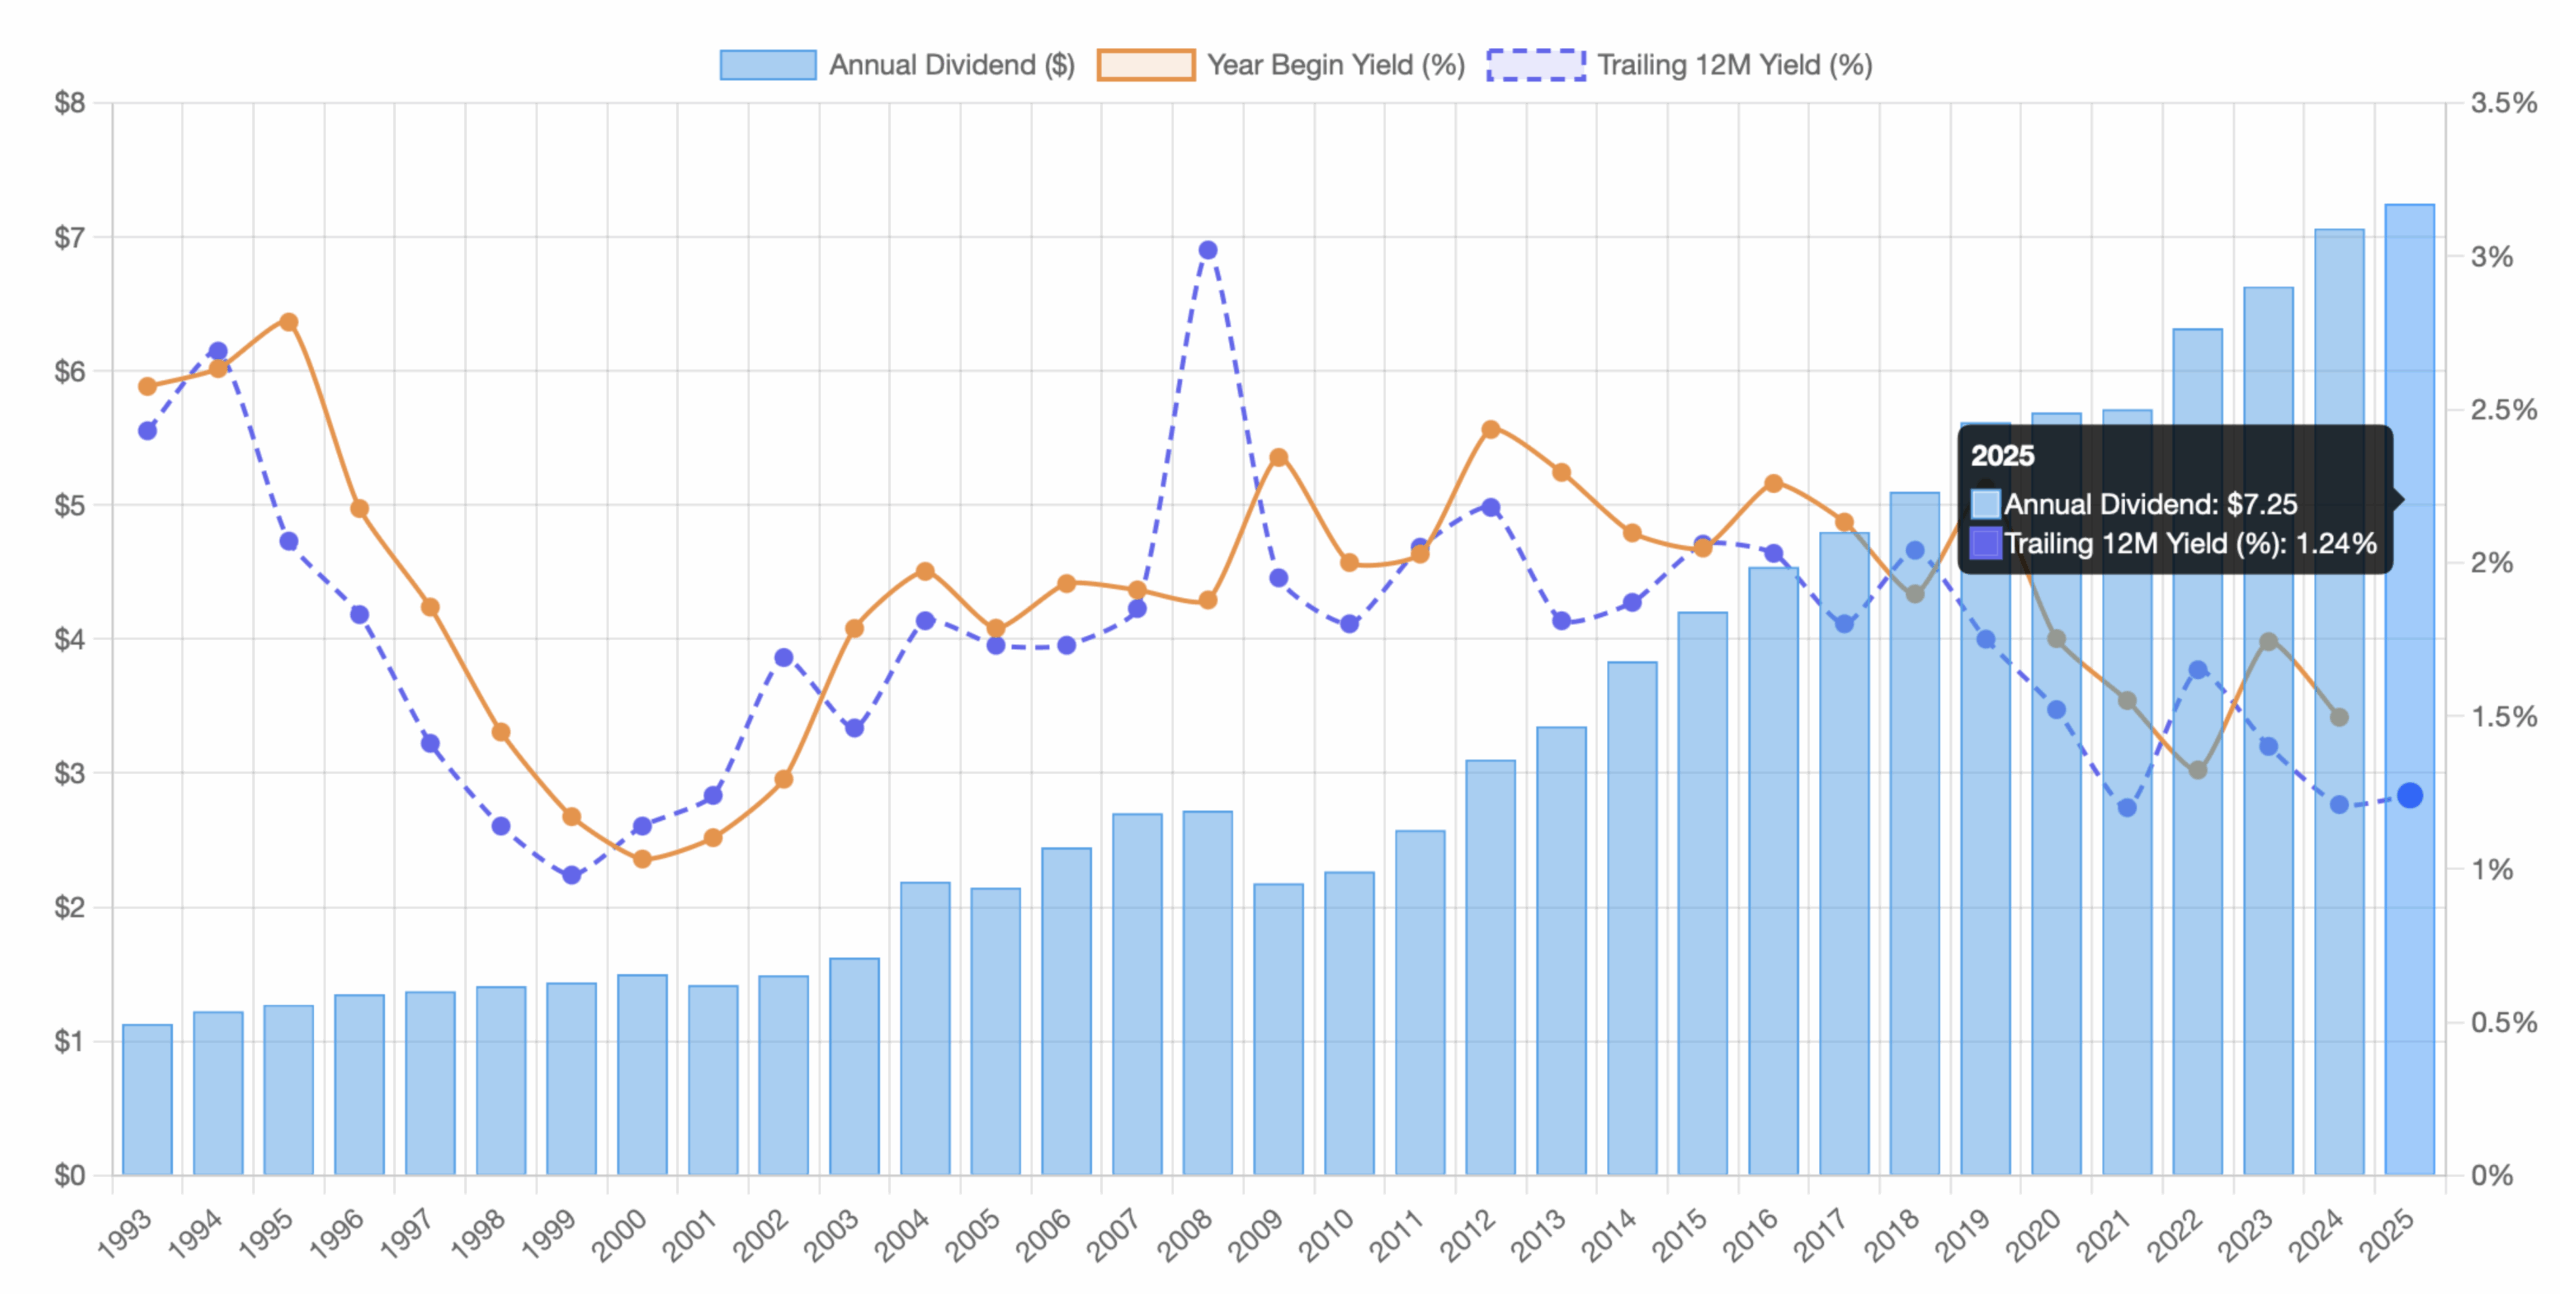
Even though by many metrics the S&P 500 Index is quite overvalued, from the above historical yield chart we can see that the current trailing 12-month yield of 1.24% is at a low level, but not as extremely low as it was in 1999.
We encourage our visitors to explore the Quote page, which offers many charts and calculators that are unique to MyPlanIQ. For example, in addition to the historical yield chart that provides a visual cue of how high or low a stock’s dividend yield is, the page also includes other tools such as rolling return charts (especially useful for ETFs or mutual funds), a DCA calculator, and a Retirement Spending (withdrawal) calculator, among others.
Finally, let’s take a look at the ‘boring’ tobacco company Altria’s dividen yield history and its long term stock total returns (price + dividend reinvested):
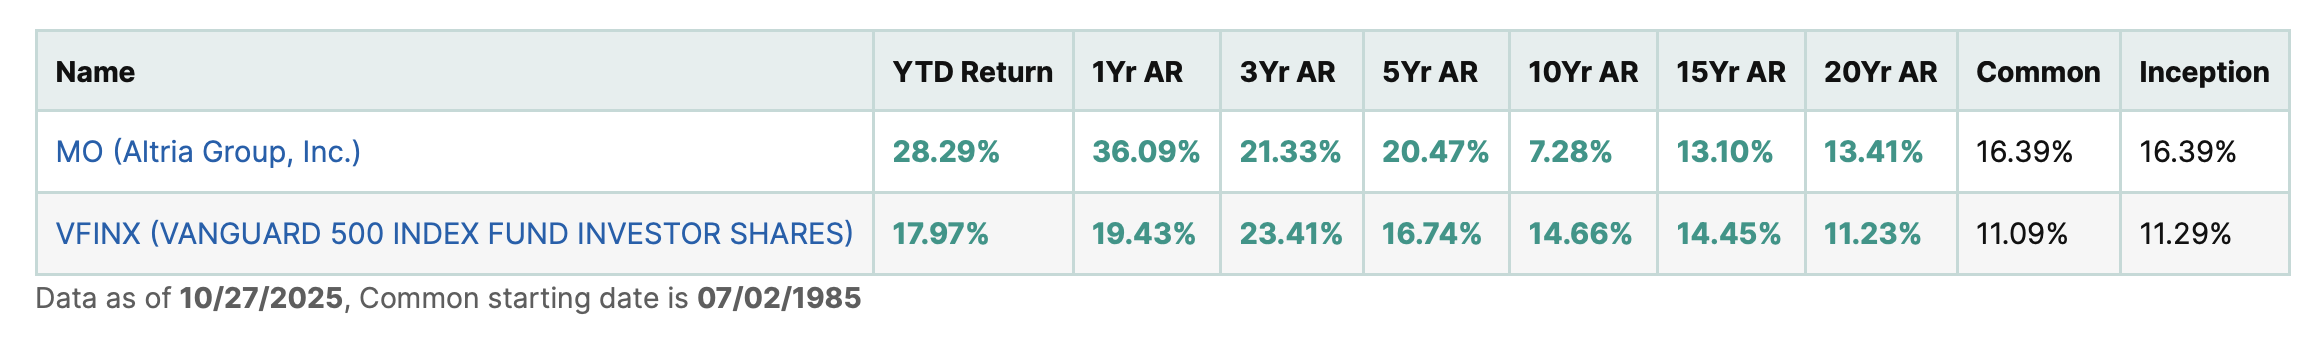
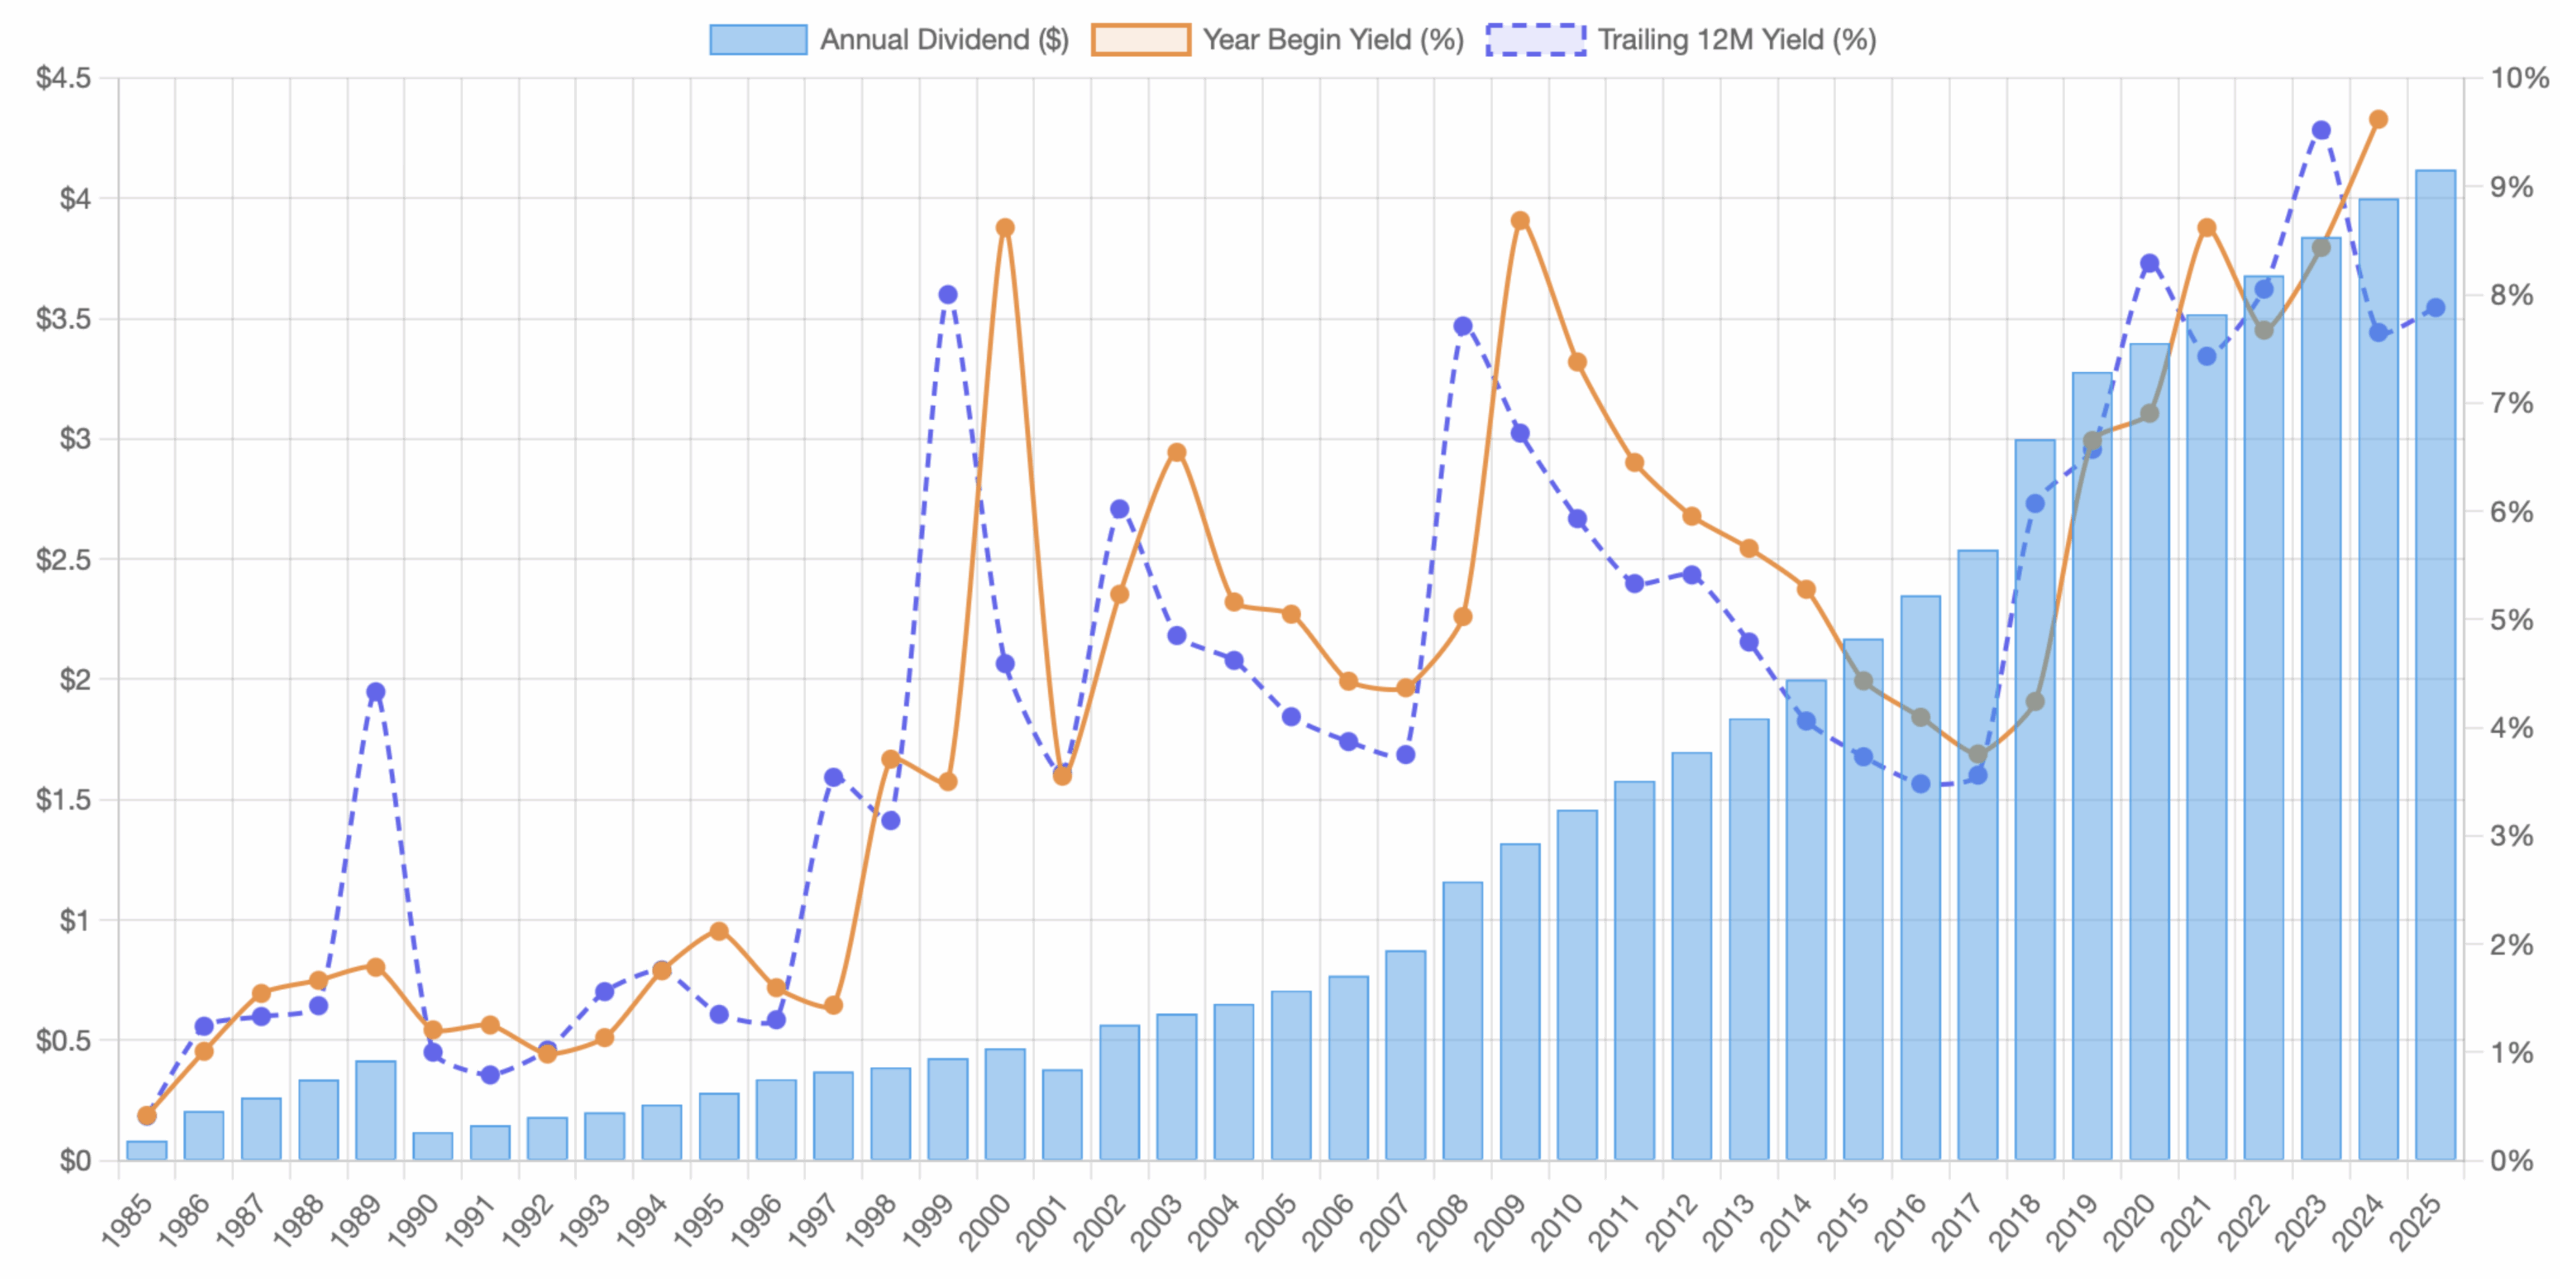
From the above, boring doesn’t mean low returns. Of course, right now the stock’s dividend yield is at a historically high level. Barring other surprises, this often indicates a higher likelihood of future price appreciation.
|
Market Overview
Another week, another big gains for stocks. Last week, we finally got the CPI number for September. The CPI seems to be fine and investors are betting that the Federal Reserve will make another interest rate cut two days from now on October 29th.
The following table shows the major asset price returns and their trend scores, as of this Monday:
| Asset Class | 1 Weeks | 4 Weeks | 13 Weeks | 26 Weeks | 52 Weeks | Trend Score |
|---|---|---|---|---|---|---|
| US Stocks | 2.1% | 3.3% | 7.9% | 25.1% | 19.4% | 11.5% |
| Foreign Stocks | 0.9% | 3.3% | 9.0% | 19.9% | 24.1% | 11.4% |
| US REITs | 0.6% | 1.8% | 3.6% | 7.8% | 0.2% | 2.8% |
| Emerging Market Stocks | 1.1% | 3.1% | 10.3% | 24.2% | 21.1% | 11.9% |
| Bonds | 0.1% | 1.2% | 3.8% | 4.4% | 6.6% | 3.2% |
More detailed returns and trend scores can be found on MyPlanIQ.com Market Overview.