How much should I have saved for retirement by age? This is one of the most often asked questions by many Americans. This is especially true for those who are at the beginning or in the middle of their retirement savings journey.
Retirement savings can be mostly classified into employment-based retirement plans (401(k), 403(b), 457(b)), tax-deferred savings, IRAs & Roth IRAs, and other taxable savings & investments. Sometimes, people also include real estate investments and annuities. In this context, we mainly deal with total savings in tax-deferred accounts (401(k) & IRAs) and other taxable savings & investments. Furthermore, similar to a 401(k), we assume they are invested in a portfolio of stock and bond funds.
We have developed a Retirement Savings by Age Calculator that uses realistic historical year-by-year stock and bond return data, and year-by-year median income levels in the U.S., to derive some realistic reference data on accumulated savings for various income tiers and different age groups. In addition to current age, its other input parameters include the age when you started saving, the stock and bond allocation breakdown, and the annual savings rate. You can then use its derived accumulated value for your age to see how much savings people in different income tiers should have accumulated at your age. The income tiers include low income, middle income, lower upper income, and mid-upper income. That will give you a reference benchmark to compare with your own savings.
Here is the table of Retirement Savings by Age in 2025:
Accumulated Retirement Savings by Age in 2025
| Age | Low Income Savings | Middle Income Savings | Lower Upper Savings | Mid Upper Savings |
|---|---|---|---|---|
| 22 | 4,692 | 9,383 | 14,075 | 18,766 |
| 23 | 10,205 | 20,410 | 30,615 | 40,821 |
| 24 | 14,415 | 28,829 | 43,244 | 57,659 |
| 25 | 19,033 | 38,067 | 57,100 | 76,134 |
| 26 | 24,117 | 48,235 | 72,352 | 96,469 |
| 27 | 30,169 | 60,338 | 90,507 | 120,675 |
| 28 | 35,649 | 71,298 | 106,947 | 142,596 |
| 29 | 41,701 | 83,402 | 125,103 | 166,804 |
| 30 | 47,993 | 95,986 | 143,979 | 191,972 |
| 31 | 54,176 | 108,351 | 162,527 | 216,702 |
| 32 | 60,808 | 121,616 | 182,424 | 243,232 |
| 33 | 68,424 | 136,849 | 205,273 | 273,697 |
| 34 | 76,622 | 153,245 | 229,867 | 306,490 |
| 35 | 85,379 | 170,758 | 256,137 | 341,516 |
| 36 | 95,279 | 190,557 | 285,836 | 381,115 |
| 37 | 106,361 | 212,721 | 319,082 | 425,442 |
| 38 | 116,113 | 232,225 | 348,338 | 464,451 |
| 39 | 126,615 | 253,229 | 379,844 | 506,459 |
| 40 | 138,001 | 276,003 | 414,004 | 552,005 |
| 41 | 149,555 | 299,109 | 448,664 | 598,219 |
| 42 | 161,660 | 323,319 | 484,979 | 646,638 |
| 43 | 175,702 | 351,405 | 527,107 | 702,809 |
| 44 | 188,676 | 377,352 | 566,028 | 754,704 |
| 45 | 201,028 | 402,057 | 603,085 | 804,113 |
| 46 | 213,579 | 427,158 | 640,737 | 854,316 |
| 47 | 226,934 | 453,868 | 680,802 | 907,736 |
| 48 | 242,453 | 484,906 | 727,359 | 969,811 |
| 49 | 260,779 | 521,559 | 782,338 | 1,043,117 |
| 50 | 280,784 | 561,568 | 842,352 | 1,123,136 |
| 51 | 306,303 | 612,607 | 918,910 | 1,225,214 |
| 52 | 329,959 | 659,918 | 989,877 | 1,319,835 |
| 53 | 355,201 | 710,402 | 1,065,603 | 1,420,804 |
| 54 | 381,840 | 763,679 | 1,145,519 | 1,527,359 |
| 55 | 414,759 | 829,518 | 1,244,276 | 1,659,035 |
| 56 | 447,640 | 895,280 | 1,342,920 | 1,790,560 |
| 57 | 487,279 | 974,557 | 1,461,836 | 1,949,114 |
| 58 | 529,766 | 1,059,532 | 1,589,297 | 2,119,063 |
| 59 | 570,608 | 1,141,217 | 1,711,825 | 2,282,433 |
| 60 | 617,874 | 1,235,749 | 1,853,623 | 2,471,497 |
| 61 | 676,347 | 1,352,693 | 2,029,040 | 2,705,386 |
| 62 | 736,880 | 1,473,760 | 2,210,639 | 2,947,519 |
| 63 | 800,892 | 1,601,783 | 2,402,675 | 3,203,567 |
| 64 | 880,896 | 1,761,791 | 2,642,687 | 3,523,583 |
| 65 | 958,342 | 1,916,685 | 2,875,027 | 3,833,369 |
| 66 | 1,044,480 | 2,088,961 | 3,133,441 | 4,177,921 |
| 67 | 1,132,551 | 2,265,101 | 3,397,652 | 4,530,202 |
| 68 | 1,214,968 | 2,429,936 | 3,644,904 | 4,859,871 |
| 69 | 1,293,402 | 2,586,803 | 3,880,205 | 5,173,606 |
| 70 | 1,293,402 | 2,586,803 | 3,880,205 | 5,173,606 |
In the above, it has the following input parameters:
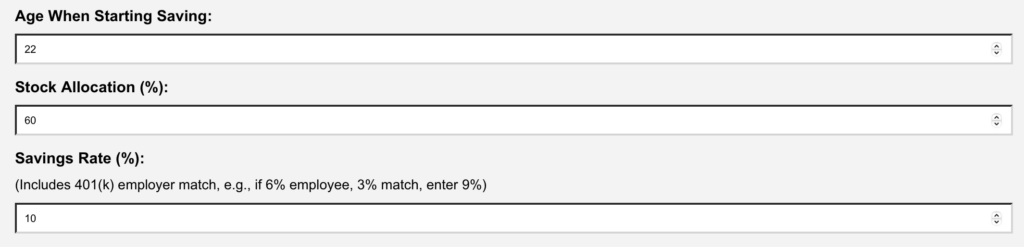
We believe a 10% annual savings rate is a reasonable assumption for someone who is a diligent saver. Of course, if you have not been able to save that much, that’s ok, as the above data are there for you to get inspiration.
The above data is also assumed to invest in a 60% stocks and 40% bonds portfolio. The historical returns data are from NYU Stern website.
Finally, the historical income tiers are from Census Bureau’s website. The following is the year by year income level table:
Historical Income Tier Levels by Year
| Year | Low Income | Middle Income | Lower Upper Income | Mid Upper Income |
|---|---|---|---|---|
| 1977 | 6,785 | 13,570 | 20,355 | 27,140 |
| 1978 | 7,530 | 15,060 | 22,590 | 30,120 |
| 1979 | 8,415 | 16,830 | 25,245 | 33,660 |
| 1980 | 9,340 | 18,680 | 28,020 | 37,360 |
| 1981 | 10,130 | 20,260 | 30,390 | 40,520 |
| 1982 | 10,525 | 21,050 | 31,575 | 42,100 |
| 1983 | 10,885 | 21,770 | 32,655 | 43,540 |
| 1984 | 11,715 | 23,430 | 35,145 | 46,860 |
| 1985 | 12,455 | 24,910 | 37,365 | 49,820 |
| 1986 | 13,240 | 26,480 | 39,720 | 52,960 |
| 1987 | 13,840 | 27,680 | 41,520 | 55,360 |
| 1988 | 14,685 | 29,370 | 44,055 | 58,740 |
| 1989 | 15,605 | 31,210 | 46,815 | 62,420 |
| 1990 | 16,355 | 32,710 | 49,065 | 65,420 |
| 1991 | 16,510 | 33,020 | 49,530 | 66,040 |
| 1992 | 16,805 | 33,610 | 50,415 | 67,220 |
| 1993 | 17,175 | 34,350 | 51,525 | 68,700 |
| 1994 | 17,870 | 35,740 | 53,610 | 71,480 |
| 1995 | 18,805 | 37,610 | 56,415 | 75,220 |
| 1996 | 19,445 | 38,890 | 58,335 | 77,780 |
| 1997 | 20,210 | 40,420 | 60,630 | 80,840 |
| 1998 | 21,220 | 42,440 | 63,660 | 84,880 |
| 1999 | 22,385 | 44,770 | 67,155 | 89,540 |
| 2000 | 22,955 | 45,910 | 68,865 | 91,820 |
| 2001 | 22,930 | 45,860 | 68,790 | 91,720 |
| 2002 | 22,915 | 45,830 | 68,745 | 91,660 |
| 2003 | 23,030 | 46,060 | 69,090 | 92,120 |
| 2004 | 23,605 | 47,210 | 70,815 | 94,420 |
| 2005 | 24,435 | 48,870 | 73,305 | 97,740 |
| 2006 | 25,055 | 50,110 | 75,165 | 100,220 |
| 2007 | 25,550 | 51,100 | 76,650 | 102,200 |
| 2008 | 25,465 | 50,930 | 76,395 | 101,860 |
| 2009 | 25,415 | 50,830 | 76,245 | 101,660 |
| 2010 | 25,240 | 50,480 | 75,720 | 100,960 |
| 2011 | 25,125 | 50,250 | 75,375 | 100,500 |
| 2012 | 25,370 | 50,740 | 76,110 | 101,480 |
| 2013 | 26,125 | 52,250 | 78,375 | 104,500 |
| 2014 | 26,345 | 52,690 | 79,035 | 105,380 |
| 2015 | 27,645 | 55,290 | 82,935 | 110,580 |
| 2016 | 28,495 | 56,990 | 85,485 | 113,980 |
| 2017 | 29,525 | 59,050 | 88,575 | 118,100 |
| 2018 | 30,540 | 61,080 | 91,620 | 122,160 |
| 2019 | 32,835 | 65,670 | 98,505 | 131,340 |
| 2020 | 33,760 | 67,520 | 101,280 | 135,040 |
| 2021 | 35,390 | 70,780 | 106,170 | 141,560 |
| 2022 | 37,290 | 74,580 | 111,870 | 149,160 |
| 2023 | 40,305 | 80,610 | 120,915 | 161,220 |
| 2024 | 40,305 | 80,610 | 120,915 | 161,220 |
Historical Income Data Source: U.S. Census Bureau, Historical Income Tables: Households, Table H-5. Access the data here. All values are in nominal (current) dollars for each year. Note: 2024 income uses 2023 data as a proxy, pending official release.
Of course, there are several caveats: it assumes a single historical savings rate (10%) for each year; furthermore, it assumes one’s income level remains the same throughout the years. As for income tiers and savings rates, for those who are in high-cost-of-living areas such as New York City or the San Francisco Bay Area, the mid-upper income level might be considered middle income and thus might also affect people’s savings rates.
From the above table, one can see that a 60-year-old middle-income earner should be able to have saved more than a million in 2025. This is a very real figure, as long as you have saved a fairly reasonable amount of money (10% or so) each year and invested consistently in a diversified portfolio since you started working at age 22.