![]()
Oil Prices and Your Wallet
In this issue:
-
- Latest in Retirement Savings & Personal Finance
- Oil Prices and Your Wallet: Oil Price Impact Calculator
- Market Overview
Latest in Retirement Savings & Personal Finance
401(k) Hardship Withdrawals Rose in 2025
Vanguard’s latest platform data shows something that should make us pause, hardship withdrawals reached 6% of participants in 2025, up from 4.8% in 2024, and far above the roughly 2% level before the pandemic. On paper, retirement balances still looked strong because markets were supportive, but this detail tells a different story under the surface. More households are tapping long-term savings for short-term survival, and that usually means monthly cash flow is getting tighter than headline wealth numbers suggest.
What is interesting is this is not only a labor market story, it is also a policy and plan design story. Vanguard noted the typical withdrawal was around $1,900, with foreclosure or eviction and medical costs among top reasons, so this looks less like optional spending and more like financial stress management. If this trend continues, the system may produce a strange outcome where aggregate retirement assets grow, while a larger share of workers feel financially fragile in real time, and that gap matters for consumption, risk tolerance, and long-term confidence.
Another AI Induced Layoff? Meta Plans to Cut 20%
Meta talking about another 20% cut, coming right after Block announced nearly 40% workforce reduction, is hard to ignore. At some point we should stop pretending this is only about normal cost control. Recent AI advancement really can let companies run leaner teams, produce similar output, and defend margins better. If management teams are judged quarter by quarter, this path is very tempting, and maybe rational too, at least from their side.
But the second order effect is where things gets uncomfortable. It also fits what Citrini warned in the so called AI doomsday scenario, many layoffs, not much new hiring, then we get this ghost GDP effect where top line numbers still look fine while household purchasing power quietly weakens. Put it in another way, if middle class jobs keep shrinking, who is going to consume all the goods and services that keep the economy moving? Efficiency gains is real, but demand side can break slowly and then suddenly.
Of course, there is another interpretation. Companies may be using AI as a narrative cover during a late economic cycle, when uncertainty is already high from geopolitical shocks, Iran war headlines, and tariff tensions. In that environment, cutting headcount can be sold as innovation instead of defensive restructuring. So maybe both things are true at the same time, AI is genuinely replacing some work, and macro pressure is giving executives the perfect excuse to move faster than they otherwise would.
In any case, neither are good for workers.
Tax Season Alert: IRS Warns of Rising Scams
Every tax season, scam activity goes up, and this year the IRS is warning people to be extra careful again. The pattern is familiar, criminals pretend to be the IRS, create urgency, and push people to send money or personal information quickly. They know many taxpayers are already stressed, waiting for refunds, or worried about filing mistakes, so fear becomes their main tool.
A simple example is the fake IRS text saying, “Your refund is on hold, click here to verify now.” The link usually leads to a look alike website that steals your Social Security number and banking details. Another common one is a phone call claiming you owe back taxes and must pay today with gift cards or crypto, otherwise you will be arrested. Real IRS communication does not work like that, they generally start with letters by mail, and they do not demand instant payment through those channels.
There is also the “helpful tax preparer” scam, where someone offers a big refund promise, then files with inflated credits and disappears after collecting fees. If the return is false, the taxpayer still carries the legal risk later. A safer approach is slow and boring, verify the sender, never click rushed links, and use trusted tax software or credentialed preparers only. In tax season, a little skepticism can save a lot of money and trouble.
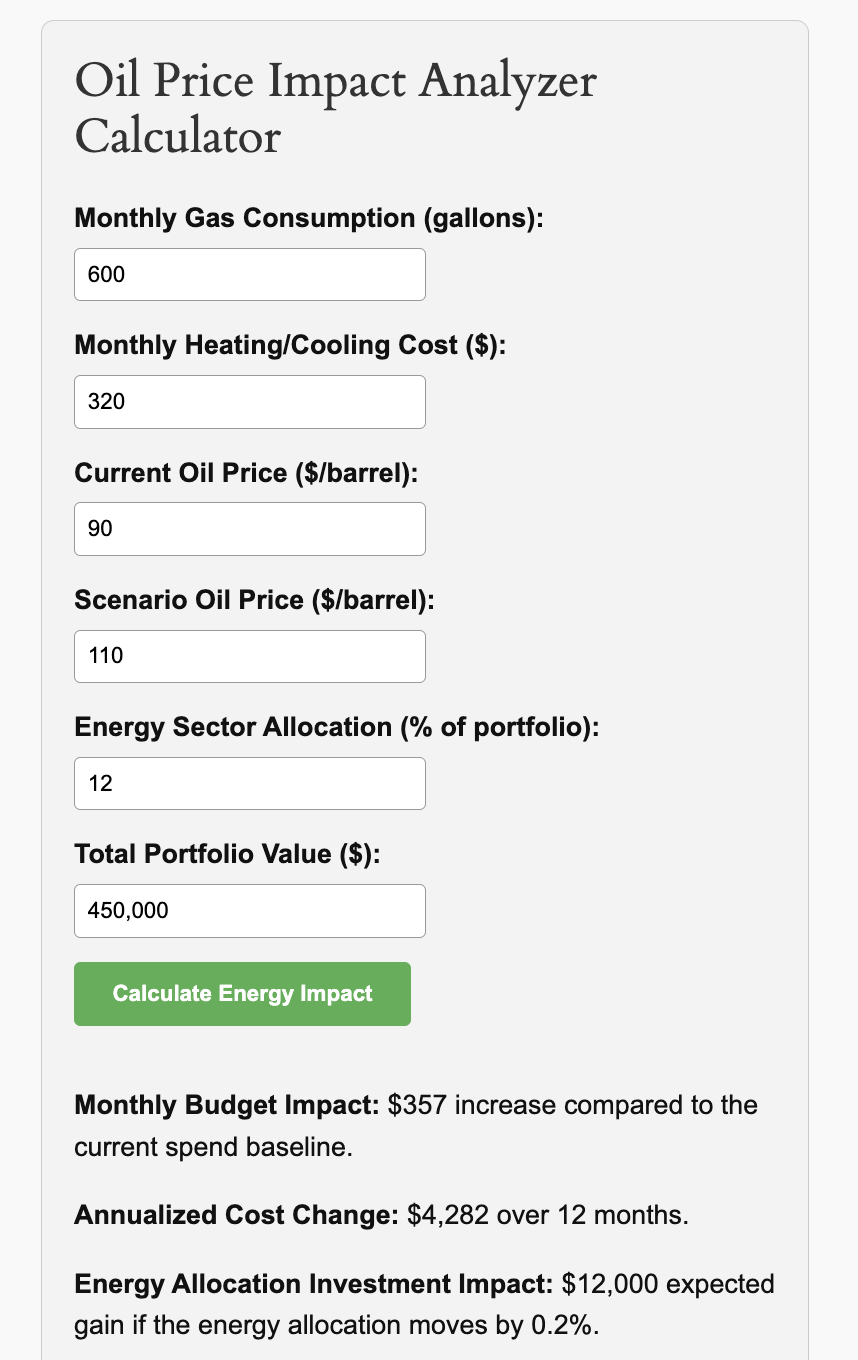
Oil Prices and Your Wallet: Oil Price Impact Calculator
The recent Iran war has pushed oil prices up sharply, and this kind of move can hit household budgets faster than many people expect, from higher gasoline bills to rising heating, cooling, and delivery related costs that quietly flow into everyday spending. This is exactly where the
can help, it lets you estimate how a new oil price scenario may affect your monthly wallet in practical dollar terms.
For investments, the calculator also works as a simple stress test for your portfolio, showing how your energy sector allocation may respond during an oil crisis. It also includes three historical precedents to add perspective on how energy exposure behaved in past shocks, so you can judge whether your current allocation is too little, too much, or roughly appropriate for this kind of geopolitical risk.
The three historical oil crisis:
1970s Energy Shock:
Oil embargo pushed energy-heavy portfolios to outperform general indexes as inflation rose, rewarding energy exposure by roughly 18% that year.
2008 Oil Spike:
Despite the broader market sell-off, high-quality energy companies delivered relative stability and dividends, blunting the downside for diversified portfolios.
2022 Energy Rally:
Energy stocks led the S&P rebound with about 22% excess returns, offsetting inflation pressures for portfolios with intentional energy exposure.
Worried About Big Loss That Might Derail Your Retirement Investments?
MyPlanIQ tactical asset allocation strategies utilize economic and financial market indicators to gauge investment risk and tactically reduce stock exposure if it deems necessary.
Our model portfolios have had more than a decade track record. Our well received monthly newsletters give informative insights into investment portfolios, funds and market conditions.
Paid subscription has 30-day free trial
(Expert tier: 14 days). Cancel anytime for a prorated refund.
Well, the sudden breakout of the recent Iran war and the possibility of a prolonged period really spooked investors. Stocks were down and volatile, while rising oil prices are adding inflation pressure, which drove up bond yields (and thus bond price decline):
| Asset Class | 1W | 4W | 13W | 26W | 52W | Trend Score |
|---|---|---|---|---|---|---|
| US Stocks | -1.4% | -1.9% | -1.4% | 1.8% | 19.4% | 3.3% |
| Foreign Stocks | -0.7% | -5.0% | 5.1% | 8.9% | 25.9% | 6.8% |
| US REITs | -0.9% | -1.7% | 4.5% | 2.1% | 5.2% | 1.8% |
| Emerging Market Stocks | 0.0% | -4.3% | 4.4% | 5.1% | 21.6% | 5.4% |
| Bonds | -0.9% | -1.0% | 0.5% | 0.8% | 5.1% | 0.9% |
More detailed returns and trend scores can be found on MyPlanIQ.com Market Overview.
Upgrade to strengthen your
retirement savings while managing risk
Use our tactical asset allocation strategies in your retirement portfolio to seek stronger long-term returns while reducing exposure to frothy markets and potential economic slowdowns.
Or choose our fixed income model portfolios, which have outperformed leading bond funds for over a decade,
Or our smart factor and sector rotation portfolios that consistently beat S&P 500 stock index with less risk.
stocks and any other securities could lose money over any period of time. All investments involve risk.
Losses may exceed the principal invested. Past performance is not an indicator of future performance. There
is no guarantee for future results in your investment and any other actions based on the information
provided on the website including, but not limited to, strategies, portfolios, articles, performance data
and results of any tools. All rights are reserved and enforced. By accessing the website, you agree not to
copy and redistribute the information provided herein without the explicit consent from MyPlanIQ.