-
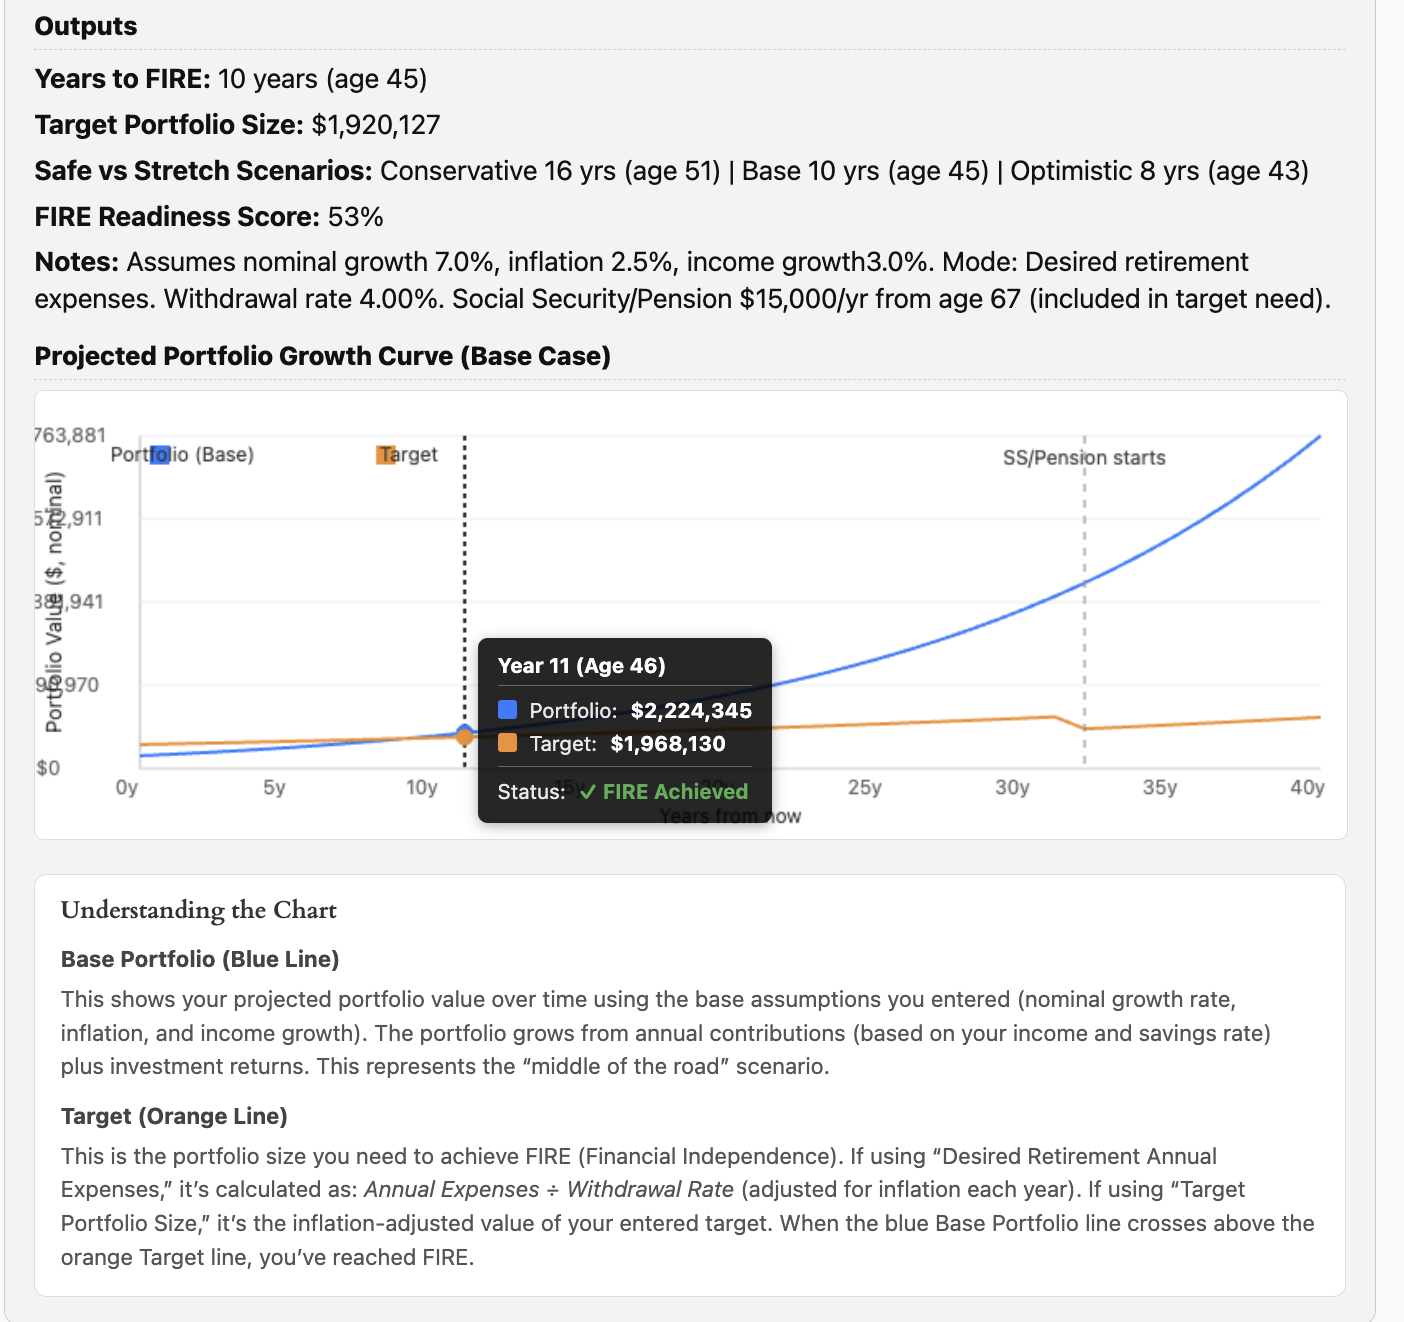
FIRE: Financial Independence Retire Early Readiness
- Latest in Retirement Savings & Personal Finance
- FIRE (Financial Independence Retire Early) Readiness Calculator
- Market Overview
-
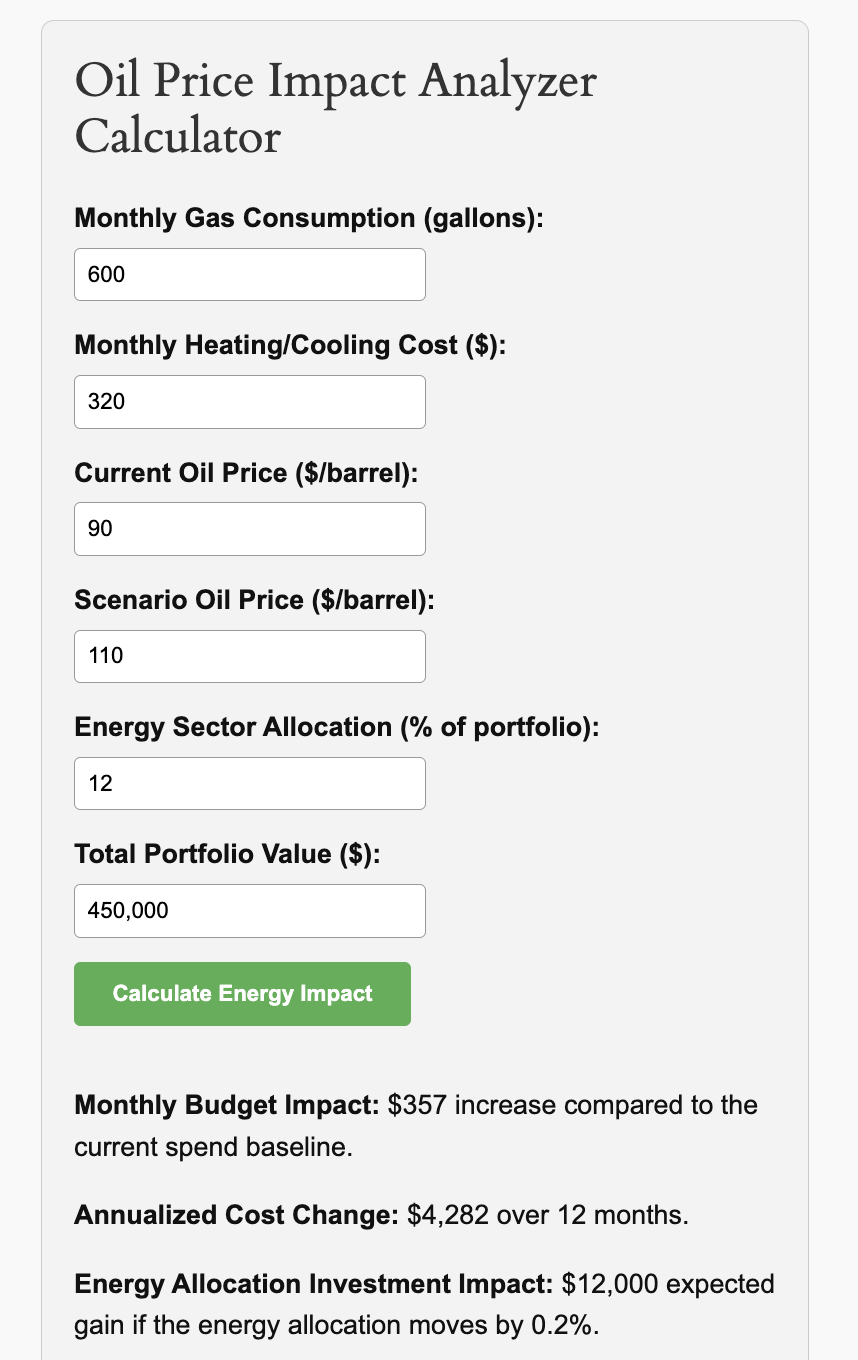
Oil Prices and Your Wallet
- Latest in Retirement Savings & Personal Finance
- Oil Prices and Your Wallet: Oil Price Impact Calculator
- Market Overview
-

Special Report: Iran War, Oil Price & Your Investments
- Special Report: Iran War, Oil Price & Your Investments
- Tools & Tips: Asset Location Calculator
- Market Overview
-
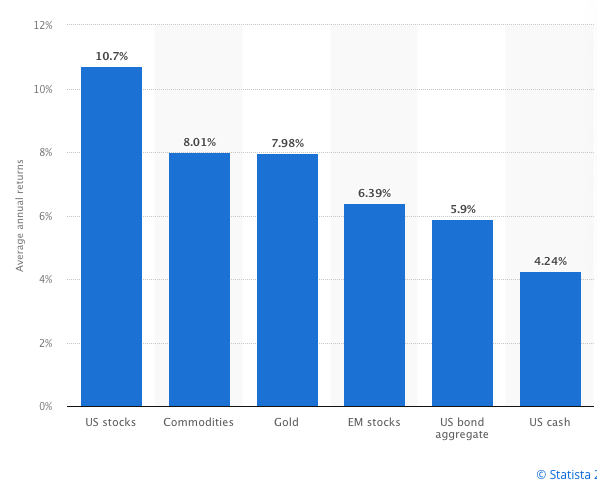
Gold’s Long-Term Performance: Historical Returns and Key Drivers
We review gold’s long-term returns since 1971. We further examine key drivers that are behind gold returns and point out these factors, inflation, inflation expectation, interest rates, economic uncertainties, international demand and geopolitical events, have a more complex relationship with gold prices.
-
Harry Browne’s Permanent Portfolio Long Term Performance
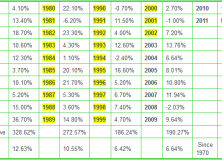
This is the latest update (as of 12/31/2016) of the performance of Harry Browne’s permanent portfolio. In 201, 6the portfolio returned 5.4% return. Since 1970, for the past 46 years, the average compound annual return of the permanent portfolio has been 8.5%. Harry Browne proposed the concept of permanent portfolio in his Fail-Safe Investing book in 1999. In the book, he showed the performance table of his ‘permanent portfolio’. The following table incorporated Harry Browne’s performance and the new performance since 2003. As of 12/31/2016: 1970 4.10% 1980 22.10% 1990 -0.70% 2000 2.70% 2010 11.92% 1971 13.40% 1981 -6.20% 1991 11.50% 2001 -1.00% 2011 8.16% 1972 18.70% 1982 23.30% 1992 4.00% 2002 7.20% 2012 5.5% 1973 10.60% 1983 4.30% 1993 12.60% 2003 13.76% 2013 -3.8% 1974 12.30% 1984 1.10% 1994 -2.40% 2004 6.64% 2014 7.6% 1975 3.70% 1985 20.10% 1995 16.60% 2005 8.01% 2015 -4.5% 1976 10.10% 1986 21.70% 1996 5.20% 2006 10.80% 2016 5.4% 1977 5.20% 1987 5.30% 1997 6.70% 2007 11.94% 1978 15.00% 1988 3.60% 1998 7.40% 2008 -2.03% 1979 36.70% 1989 14.80% 1999 4.70% 2009 9.64% Cumulative 328.62% 272.57% 186.24% 190.27% Annual 12.63% 10.55% 6.42% 6.64% Since 1970 8.48% The highlighted portion is from Browne’s book (page 81) and the rest is from MyPlanIQ’s Harry Browne Permanent Portfolio. Notice there is some discrepancy for performance between 2000 to 2002. This is because in MyPlanIQ’s portfolio, Vanguard funds and Gold ETF (GLD) are used while in Browne’s calculation, he uses the following: Stock results are for an S&P 500 Index mutual fund, including reinvestment of dividends. Bond results are for a 30-year T-bond, including interest received. Gold results are for American Eagle 1-ounce coins. Cash results are for Treasury bills, assuming a 1-year bill was bought at start of each year. Cash in MyPlanIQ’s Harry Browne Permanent Portfolio is modeled using 3 month Treasury bill’s returns. We will continue to update this table as time goes. See also Permanent Global Portfolio ETF Plan Permanent Portfolio ETF Plan
-
Harry Browne’s Permanent Portfolio Long Term Performance
This is the latest update (as of 12/31/2015) of the performance of Harry Browne’s permanent portfolio. In 2015, the portfolio had a negative -4.5% return. Since 1970, for the past 46 years, the average compound annual return of the permanent portfolio has been 8.35%. Harry Browne proposed the concept of permanent portfolio in his Fail-Safe Investing book in 1999. In the book, he showed the performance table of his ‘permanent portfolio’. The following table incorporated Harry Browne’s performance and the new performance since 2003. As of 12/31/2015: 1970 4.10% 1980 22.10% 1990 -0.70% 2000 2.70% 2010 11.92% 1971 13.40% 1981 -6.20% 1991 11.50% 2001 -1.00% 2011 8.16% 1972 18.70% 1982 23.30% 1992 4.00% 2002 7.20% 2012 5.5% 1973 10.60% 1983 4.30% 1993 12.60% 2003 13.76% 2013 -3.8% 1974 12.30% 1984 1.10% 1994 -2.40% 2004 6.64% 2014 7.6% 1975 3.70% 1985 20.10% 1995 16.60% 2005 8.01% 2015 -4.5% 1976 10.10% 1986 21.70% 1996 5.20% 2006 10.80% 1977 5.20% 1987 5.30% 1997 6.70% 2007 11.94% 1978 15.00% 1988 3.60% 1998 7.40% 2008 -2.03% 1979 36.70% 1989 14.80% 1999 4.70% 2009 9.64% Cumulative 328.62% 272.57% 186.24% 190.27% Annual 12.63% 10.55% 6.42% 6.64% Since 1970 8.35% The highlighted portion is from Browne’s book (page 81) and the rest is from MyPlanIQ’s Harry Browne Permanent Portfolio. Notice there is some discrepancy for performance between 2000 to 2002. This is because in MyPlanIQ’s portfolio, Vanguard funds and Gold ETF (GLD) are used while in Browne’s calculation, he uses the following: Stock results are for an S&P 500 Index mutual fund, including reinvestment of dividends. Bond results are for a 30-year T-bond, including interest received. Gold results are for American Eagle 1-ounce coins. Cash results are for Treasury bills, assuming a 1-year bill was bought at start of each year. Cash in MyPlanIQ’s Harry Browne Permanent Portfolio is modeled using 3 month Treasury bill’s returns. We will continue to update this table as time goes. See also Permanent Global Portfolio ETF Plan Permanent Portfolio ETF Plan