
Income Growth, Historical 401(k) Contribution Limit Data
In this issue:
- Latest in Retirement Savings & Personal Finance: Interest Rates Rise Again, Rising Home Insurance Cost, …
- Historical Income Growth, 401(k) Contribution Limit Growth
- Tools & Tips: 401(k) Maximum Match Calculator — Marvell Semiconductor
- Market Overview
Latest in Retirement Savings & Personal Finance: Interest Rates Rise Again, Rising Home Insurance Cost, …
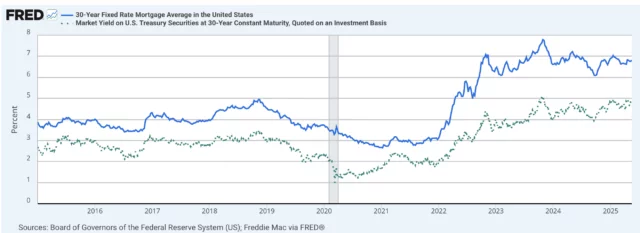
Long-Term Treasury Rate Rise Again and Mortgage Interest Is at 7%
As of today, the 30-year Treasury interest rate is approaching 5% again, reaching 4.906%. This comes after Moody’s, one of the last three major credit rating agencies (the other two being S&P Global and Fitch), downgraded the U.S. credit rating to Aa1 from Aaa (the top rating). The other two had downgraded the U.S. some time ago. The following chart shows the 30-year Treasury rate and the 30-year mortgage rate:
Housing costs are still as high as they were in 2022–2023, making affordability the lowest in decades.
Rising Home Insurance Rates
Speaking of high mortgage rates, the rising home insurance rates in many coastal states doesn’t help. In recent years, because of the global climate change, states like California have experienced some major wild fire disasters while states like Florida and Louisiana have had several devastating floods. These are making home insurance cost skyrocketing. Some insurance companies have either refused to insure or completely abandoned some states.
- California: State Farm, the state’s largest home insurer, received approval for a 17% emergency rate hike effective June 1, 2025, after major wildfire losses. This follows a 20% increase last year. Condo owners will see a 15% hike, and rental home rates will jump 38%.
- Florida: Citizens Property Insurance, the state-backed insurer, was approved for a maximum 14% rate hike for 2025. Most primary residences will see an average increase of 6.6%, while vacation homes face an average 17% hike. Some policyholders in Miami-Dade and Broward counties may see decreases. Florida’s home insurance costs have risen 57% since 2015, nearly triple the U.S. average, making it the most expensive state for home insurance. The average premium is expected to hit $15,460 by the end of 2025, with some cities like Hialeah facing annual costs over $26,000. Adding property tax, the cost of owning a house is rapidly becoming unfavorable.
- Other States: Louisiana leads the nation with a projected 27% average increase in 2025. Iowa, Minnesota, and Hawaii are also seeing double-digit hikes (around 15%), driven by severe weather and rising repair costs
Retirement Concerns Again
The market swooned again, reigniting concerns about retirement security. A D.A. Davidson survey reveals that 41% of older Americans—potentially over 20 million—fear their savings won’t be enough to support their desired retirement lifestyle, citing rising healthcare and housing costs, along with longer life expectancies. Additionally, 69% of workers believe that simply working until retirement age won’t be sufficient to build adequate savings.
Historical Income Growth, 401(k) Contribution Limit Growth
Our previous newsletter drew quite a few reactions from readers. Let’s continue the conversation by discussing income growth and retirement contribution limit data.
Historical Income Growth: The Growing Income Equality
The Year-by-Year Income Levels in the U.S. since 1977 show that middle (or median) income has slightly outpaced inflation over the long term. However, over the past five years, income has lagged behind inflation.
| Middle Income | Annual CPI % Growth | |
| CAGR (1977–2024) | 3.85% | 3.56% |
| CAGR (2005–2024) | 2.68% | 2.51% |
| CAGR (2015–2024) | 4.28% | 3.07% |
| CAGR (2020–2024) | 4.54% | 4.77% |
However, if we compare the middle income growth with the top 0.01% income growth, we see the following:
| Year | 0.01% | 50% |
|---|---|---|
| 2001 | $6,869,952 | $31,418 |
| 2002 | $5,891,214 | $31,299 |
| 2020 | $14,757,246 | $42,184 |
| 2021 | $22,756,244 | $46,637 |
| 2022 | $17,855,123 | $50,339 |
From 2001 to 2022, the income of the top 0.01% grew by 2.6 times, while the median income grew by only 1.6 times. Clearly, income inequality has been increasing.
401(k) Contribution Limit Year by Year Growth
Let’s take a look at year by year annual 401(k) contribution limit change since 1978:
Historical 401(k) Contribution Limits with CPI % Change and Annualized Increases (1978–2024)
| Year | Employee Contribution Limit | Catch-Up Contribution | Total Contribution Limit | Annualized CPI Increase (1986–Year) | Annualized Limit Increase (1986–Year) |
|---|---|---|---|---|---|
| 1978 | $45,475* | $0 | N/A | N/A | N/A |
| 1981 | $45,475* | $0 | N/A | N/A | N/A |
| 1982 | $30,000** | $0 | $30,000 | N/A | N/A |
| 1985 | $30,000 | $0 | $30,000 | N/A | N/A |
| 1986 | $7,000*** | $0 | $30,000 | N/A | N/A |
| 1987 | $7,313 | $0 | $30,000 | 3.65% | 4.47% |
| 2020 | $19,500 | $6,500 | $57,000 | 2.61% | 3.14% |
| 2021 | $19,500 | $6,500 | $58,000 | 2.66% | 3.06% |
| 2022 | $20,500 | $6,500 | $61,000 | 2.77% | 3.12% |
| 2023 | $22,500 | $7,500 | $66,000 | 2.81% | 3.26% |
| 2024 | $23,000 | $7,500 | $69,000 ($76,500 with catch-up) | 2.83% | 3.20% |
Congress has indeed made efforts to ensure that the annual contribution limit increases at a rate higher than the annual CPI (inflation). On the other hand, we can see that there was a significant reset in 1986 for the retirement contribution limit.
Tools & Tips: 401(k) Maximum Match Calculator — Marvell Semiconductor
We are developing a maximum match calculator for 401(k) and other retirement plans, based on each plan’s employer match policy. The calculator helps participants determine the minimum contribution required to receive the maximum employer match, using their bi-weekly pay or compensation amount. This is especially useful for individuals with student loans or other financial obligations—those who want to contribute just enough to capture the maximum employer match. After all, the employer match is essentially “free” money.
The following is an example for MARVELL SEMICONDUCTOR 401K RETIREMENT PLAN that has the following contribution and match policy:
1. Employee Contribution Rates: Participants may elect to contribute up to 75% of eligible pre-tax or post-tax compensation.
2. Employer Match/Contribution Conditions: The Company matched 100% of the first 5% of each eligible participant’s contribution up to $1,250 on a calendar quarterly basis, with a maximum of $5,000 for the calendar year. The participant must be employed by the Company on the last day of the quarter to qualify for the match.
3. Vesting Schedule/Eligibility: Participants are immediately vested in their voluntary contributions and discretionary matching contributions. They vest in the Company’s discretionary profit sharing contributions at 33% per year after a full year of service, continuing until fully vested after three years of service.
The Calculator:

It’s important to make an effort to capture the full employer match—after all, it’s essentially free money.
Market Overview
Investors viewed the 90-day tentative U.S.–China tariff agreement as good news, pushing U.S. stocks firmly back into an uptrend. So far, all major asset classes have posted positive year-to-date returns.
The following table shows the major asset price returns and their trend scores, as of last Friday:
| Asset Class | 1 Weeks | 4 Weeks | 13 Weeks | 26 Weeks | 52 Weeks | Trend Score |
|---|---|---|---|---|---|---|
| US Stocks | 5.3% | 12.9% | -2.2% | 2.1% | 13.7% | 6.4% |
| Foreign Stocks | 2.1% | 8.3% | 5.7% | 10.0% | 7.9% | 6.8% |
| US REITs | 1.4% | 4.0% | -1.4% | -3.7% | 8.5% | 1.7% |
| Emerging Market Stocks | 0.9% | 10.2% | 4.8% | 5.1% | 7.5% | 5.7% |
| Bonds | -0.2% | -0.2% | -0.1% | 0.3% | 3.1% | 0.6% |
More detailed returns and trend scores can be found on MyPlanIQ.com Market Overview.
Try to Find Your Old Retirement Accounts?
Find Tools and Calculators That Provide Quick Help