|
Vanguard ETF: |  |
7.4%* |
|
Diversified Core: | |
8.1%* |
|
Six Core Asset ETFs: | |
7.3%* |
Articles on (NYSEArca
- Swensen Six Asset Lazy Portfolio Review
03/16/2011
One of the most glaring holes in our education system is retirement investing. Much is said about day trading and the high wire acts of Hedge Funds. Retirement investing is a long term proposition and is similar to looking after your health – do what is sensible and have occasional checkups that become more frequent as you age. Aging boomers highlight the major retirement crisis as they come to the end of their working careers with the recent crash and current turmoil in the forefront of their minds. We believe that it is possible for the individual to be more involved with their retirement investing and to see better results. These articles are intended to help build the foundational understanding that will enable better returns, lower risk and less angst in our lives.
In two articles, we are going to review the Swensen Six Lazy Portfolio. In the first article we are going to look over the past year. In the second, we are going to look at the last quarter and project into the future. Each of these timeframes sheds light on building an effective retirement portfolio.
David Swensen, the Yale Endowment Investment Manager, proposed this portfolio for individual investors. Swensen was one of the first to diversify and this portfolio has five asset classes: US, international including emerging market equities and real estate trusts. Even today, many diversified portfolios would have a much higher US concentration and less outside the US. This makes this a well rounded portfolio.The portfolio consists of the following:
- 30% in Vanguard Total Stock Market Index (MUTF: VTSMX) ), (NYSE: VTI)
- 20% in Vanguard REIT Index (MUTF: VGSIX), (NYSE: VNQ)
- 20% in Vanguard Total International Stock (MUTF: VGTSX) or 15% in (VGTSX) and 5% in (MUTF: VEIEX), (NYSE: VEU), (NYSE: VWO), (NYSE: VEA)
- 15% in Vanguard Inflation Protected Securities (MUTF: VIPSX), (NYSE: TIP)
- 15% in Vanguard Long Term Treasury Index (MUTF: VUSTX), (NYSE: LQD)
A Lazy portfolio is appealing because it requires so little effort to maintain it. If we can find a portfolio that requires little effort and still delivers good returns, then let's use it. We are going to compare a number of portfolios that use mimic all or part of the Swensen Six approach.- The original Swensen funds with an annual rebalance. Swensen himself performs a daily rebalance but that is too onerous for the general user
- The original Swensen funds with a quarterly rebalance. Normal protocal for advisors is to have a quarterly review of a portfolio and that is what this is
- The Swensen funds with the MyPlanIQ strategic asset allocation for a moderate portfolio, 40% bonds 20% in each of the other three asset classes
- The Swensen funds with the MyPlanIQ tactical asset allocation for a moderate portfolio, 40% bonds 30% in each of the top two asset classes or moved to fixed income (including cash)
- The Six Core Asset ETF Benchmark
Portfolio Performance Comparison
Portfolio Name 1Yr AR 1Yr Sharpe 3Yr AR 3Yr Sharpe 5Yr AR 5Yr Sharpe David Swensen Six Asset Individual Investor Plan Strategic Asset Allocation Moderate 9% 109% 4% 21% 6% 31% David Swensen Six Asset Individual Investor Plan Tactical Asset Allocation Moderate 9% 100% 8% 75% 11% 83% P David Swensen Yale Individual Investor Portfolio Annual Rebalancing 14% 110% 5% 22% 5% 22% P David Swensen Yale Individual Investor Portfolio Quarterly Rebalancing 15% 115% 5% 21% 5% 20% Six Core Asset ETF Benchmark Tactical Asset Allocation Moderate 12% 86% 8% 65% 13% 88%
We note that over the longer time horizon, the six asset benchmark with tactical asset allocation is the overall winner. This is not a surprise because with recent event crushing just about all buy and hold portfolios, we would expect a tactical asset allocation strategy to win. The same holds true for the TAA deployment of the Swensen funds. The difference between the two TAA portfolios is that the Six SIB has commodities. This applies to both the three and five year timeframes.
Over five years, the TAA returns are 13% a year compared to 6% a year. In a previous article, we said that the Morningstar 401K plan was one to follow and it delivered 14% a year over five years. For a plan with only six funds, the Swensen plan does pretty well.
For the buy and hold strategies we see in the three and five year timeframes some swapping of returns but they are relatively closely matched. The differences between the three portfolios are:
- The SAA strategy using the Swensen funds is more conservative in the sense that it has 40% designated to fixed income compared 30% for the Swensen originals
- The SAA strategy can rebalance monthly subject to redemption limits and has the ability to rotate funds -- this only applies to fixed income where there is a choice but over the longer term, that can add 1% to the returns although the choices aren't always perfectly made
- The other two are identical except for the frequency with which they reblance.
As we review the past one year, we see the situation is reversed. The TAA strategies struggle as they search for a trend to be established which it did not. This clearly shows you the reality of trading off between a buy and hold and momentum strategy. When the risk equities are performing well, buy and hold works best. However, if you want to eliminate the big drops as we saw in 2008/2009, TAA is what you are looking for. In fact, as the graph starts tracking, we see the TAA strategies heavily into cash or fixed income and missing the ups and down of the buy and hold but moves into equities behind and never catches up during the rally.
We also notice that the original portfolios separate from the SAA as they have more risk equities and derive a higher return from the overall portfolio. Finally we notice that the quarterly rebalancing portfolio inches ahead througout the year but it is very close.
This is a well chosen, simple set of funds that gives you good diversification and has delivered reasonable returns. For those who are still reeling from the drop in value of your portfolio and don't have another decade to recover, you might want to accept the lower returns in the good times for less volatility from the momentum based portfolio.
One final point is don't let short term exuberance cloud your long term judgement. The majority of SAA portfolios beat TAA portfolios in 2010 and there were some very healthy numbers reported. However, it was only a couple of years ago that we were all feeling sick at the precipitous drops in our portfolios and TAA limits these downside losses. Make sure you consider the long term when conditions will change.
This segues nicely into the next article where we look at the last quarter in more detail and see that, indeed, things are beginning to change.Disclosure:
MyPlanIQ does not have any business relationship with the company or companies mentioned in this article. It does not set up their retirement plans. The performance data of portfolios mentioned above are obtained through historical simulation and are hypothetical.
Symbols:(NYSEArca,VTI,),(NYSEArca,VEU),(NYSEArca,BND),(NYSEArca,VNQ),(NYSEArca,VWO),(NYSEArca, ,DBC),(MUTF,PTTRX),(MUTF,PTTDX),(NYSE,RSP),(NYSE,VBK),(NYSE,IJJ),(NYSE,EFA),(NYSE,RWR),(NYSE,RWO) , - Swensen Six Asset Lazy Portfolio Review
03/16/2011
One of the most glaring holes in our education system is retirement investing. Much is said about day trading and the high wire acts of Hedge Funds. Retirement investing is a long term proposition and is similar to looking after your health – do what is sensible and have occasional checkups that become more frequent as you age. Aging boomers highlight the major retirement crisis as they come to the end of their working careers with the recent crash and current turmoil in the forefront of their minds. We believe that it is possible for the individual to be more involved with their retirement investing and to see better results. These articles are intended to help build the foundational understanding that will enable better returns, lower risk and less angst in our lives.
In two articles, we are going to review the Swensen Six Lazy Portfolio. In the first article we are going to look over the past year. In the second, we are going to look at the last quarter and project into the future. Each of these timeframes sheds light on building an effective retirement portfolio.
David Swensen, the Yale Endowment Investment Manager, proposed this portfolio for individual investors. Swensen was one of the first to diversify and this portfolio has five asset classes: US, international including emerging market equities and real estate trusts. Even today, many diversified portfolios would have a much higher US concentration and less outside the US. This makes this a well rounded portfolio.The portfolio consists of the following:
- 30% in Vanguard Total Stock Market Index (MUTF: VTSMX) ), (NYSE: VTI)
- 20% in Vanguard REIT Index (MUTF: VGSIX), (NYSE: VNQ)
- 20% in Vanguard Total International Stock (MUTF: VGTSX) or 15% in (VGTSX) and 5% in (MUTF: VEIEX), (NYSE: VEU), (NYSE: VWO), (NYSE: VEA)
- 15% in Vanguard Inflation Protected Securities (MUTF: VIPSX), (NYSE: TIP)
- 15% in Vanguard Long Term Treasury Index (MUTF: VUSTX), (NYSE: LQD)
A Lazy portfolio is appealing because it requires so little effort to maintain it. If we can find a portfolio that requires little effort and still delivers good returns, then let's use it. We are going to compare a number of portfolios that use mimic all or part of the Swensen Six approach.- The original Swensen funds with an annual rebalance. Swensen himself performs a daily rebalance but that is too onerous for the general user
- The original Swensen funds with a quarterly rebalance. Normal protocal for advisors is to have a quarterly review of a portfolio and that is what this is
- The Swensen funds with the MyPlanIQ strategic asset allocation for a moderate portfolio, 40% bonds 20% in each of the other three asset classes
- The Swensen funds with the MyPlanIQ tactical asset allocation for a moderate portfolio, 40% bonds 30% in each of the top two asset classes or moved to fixed income (including cash)
- The Six Core Asset ETF Benchmark
Portfolio Performance Comparison
Portfolio Name 1Yr AR 1Yr Sharpe 3Yr AR 3Yr Sharpe 5Yr AR 5Yr Sharpe David Swensen Six Asset Individual Investor Plan Strategic Asset Allocation Moderate 9% 109% 4% 21% 6% 31% David Swensen Six Asset Individual Investor Plan Tactical Asset Allocation Moderate 9% 100% 8% 75% 11% 83% P David Swensen Yale Individual Investor Portfolio Annual Rebalancing 14% 110% 5% 22% 5% 22% P David Swensen Yale Individual Investor Portfolio Quarterly Rebalancing 15% 115% 5% 21% 5% 20% Six Core Asset ETF Benchmark Tactical Asset Allocation Moderate 12% 86% 8% 65% 13% 88%
We note that over the longer time horizon, the six asset benchmark with tactical asset allocation is the overall winner. This is not a surprise because with recent event crushing just about all buy and hold portfolios, we would expect a tactical asset allocation strategy to win. The same holds true for the TAA deployment of the Swensen funds. The difference between the two TAA portfolios is that the Six SIB has commodities. This applies to both the three and five year timeframes.
Over five years, the TAA returns are 13% a year compared to 6% a year. In a previous article, we said that the Morningstar 401K plan was one to follow and it delivered 14% a year over five years. For a plan with only six funds, the Swensen plan does pretty well.
For the buy and hold strategies we see in the three and five year timeframes some swapping of returns but they are relatively closely matched. The differences between the three portfolios are:
- The SAA strategy using the Swensen funds is more conservative in the sense that it has 40% designated to fixed income compared 30% for the Swensen originals
- The SAA strategy can rebalance monthly subject to redemption limits and has the ability to rotate funds -- this only applies to fixed income where there is a choice but over the longer term, that can add 1% to the returns although the choices aren't always perfectly made
- The other two are identical except for the frequency with which they reblance.
As we review the past one year, we see the situation is reversed. The TAA strategies struggle as they search for a trend to be established which it did not. This clearly shows you the reality of trading off between a buy and hold and momentum strategy. When the risk equities are performing well, buy and hold works best. However, if you want to eliminate the big drops as we saw in 2008/2009, TAA is what you are looking for. In fact, as the graph starts tracking, we see the TAA strategies heavily into cash or fixed income and missing the ups and down of the buy and hold but moves into equities behind and never catches up during the rally.
We also notice that the original portfolios separate from the SAA as they have more risk equities and derive a higher return from the overall portfolio. Finally we notice that the quarterly rebalancing portfolio inches ahead througout the year but it is very close.
This is a well chosen, simple set of funds that gives you good diversification and has delivered reasonable returns. For those who are still reeling from the drop in value of your portfolio and don't have another decade to recover, you might want to accept the lower returns in the good times for less volatility from the momentum based portfolio.
One final point is don't let short term exuberance cloud your long term judgement. The majority of SAA portfolios beat TAA portfolios in 2010 and there were some very healthy numbers reported. However, it was only a couple of years ago that we were all feeling sick at the precipitous drops in our portfolios and TAA limits these downside losses. Make sure you consider the long term when conditions will change.
This segues nicely into the next article where we look at the last quarter in more detail and see that, indeed, things are beginning to change.Disclosure:
MyPlanIQ does not have any business relationship with the company or companies mentioned in this article. It does not set up their retirement plans. The performance data of portfolios mentioned above are obtained through historical simulation and are hypothetical.
Symbols:(NYSEArca,VTI,),(NYSEArca,VEU),(NYSEArca,BND),(NYSEArca,VNQ),(NYSEArca,VWO),(NYSEArca, ,DBC),(MUTF,PTTRX),(MUTF,PTTDX),(NYSE,RSP),(NYSE,VBK),(NYSE,IJJ),(NYSE,EFA),(NYSE,RWR),(NYSE,RWO) , - How Good Is The Six Asset ETF Benchmark Really?
03/09/2011
The first baby boomers preparing for retirement with the still steaming financial meltdown at the forefront of our minds. We have been building a simple set of funds that have the potential to deliver good returns at a low risk.
We have seen increasing diversification can make a significant impact on simulated historical returns. Sadly, only a few retirement plans (~4%) have six asset classes but we noted that with most of us having jobs in more than one company, it may be possible to create a holistic portfolio with the combination of IRA and 401K or retirement vehicle you use.
In the last article we added the PIMCO managed bond fund to our benchmark. We noted that there are currently no ETFs that can compete in this critical area and we noted that this gave a 1% bump to the historical simulations. In a future article, we will refine each of the asset classes to see what improvement they give to build a comprehensive plan from which one can build an effective portfolio.
In this article, we are going to take a slight detour and answer two questions:
1. How well does the benchmark perform against the other plans we support
2. Is it better to have good funds with fewer asset classes than poor funds with more asset classes
We are going to answer this by showing the results of the approximately 800 plans we summarized in our initial study. Because of the number of plans, we don't provide the ability to look into individual plans but this can be provided if somebody has a specific question.

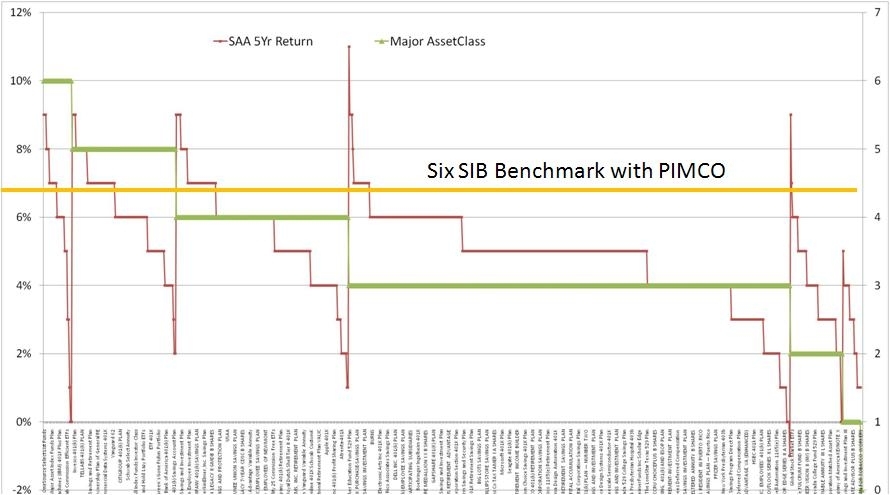
The red line are the five year returns for buy and hold strategies. The green line is the number of asset classes in the plan (axis to the right) and the gold bar is how the benchmark performed.
We note that:- The benchmark performs in the middle region of the six asset class plans and above average in all the other plans
- The top performing plan has an 11% annual rate of return over five years but that is only one out of 800 and the next best is 9%
- There is a general trend down as the number of asset classes reduce in number but there are definite spikes
- There are a few plans in the lower number of asset classes that perform as well as any
For those who only want buy and hold strategies, there is merit in looking into the 11% and 9% plans in all asset class categories to understand what makes them tick and what the trade off is between more or less asset classes.
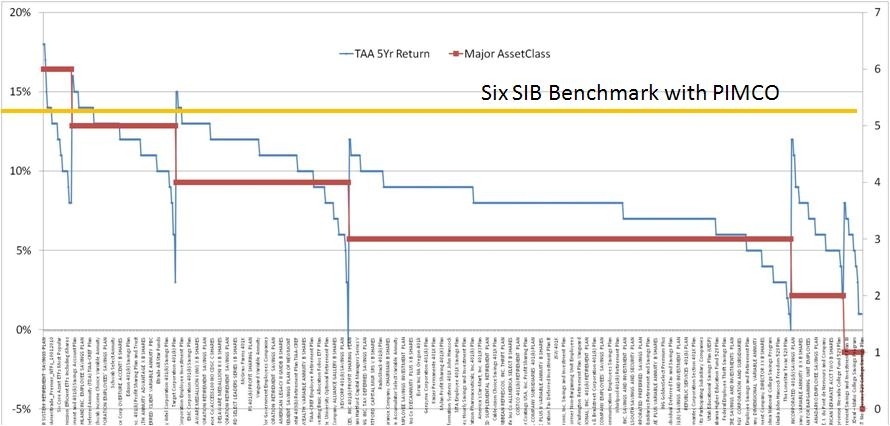
If we now look at the same plans with a tactical asset allocation strategy applied:
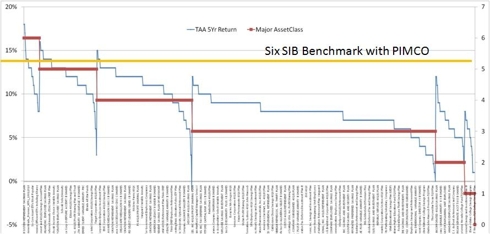
The blue line is the five year returns for tactical asset allocation strategies. The red line is the number of asset classes in the plan (axis to the right) and the gold bar is how the benchmark performed.
We note that:- The behavior is more regulated -- there are no big spikes
- We see that some plans with a lower number of asset classes outperform the plans in a higher asset class bracket
- In general, the plans with a higher number of asset classes perform better
- The benchmark performs in the middle of the six asset class and above most of the other classes
It may be instructive to look at some of the peak performers in the lower classes but that is for another article.
The six asset benchmark with its seven funds (NYSEArca: VTI ), (NYSEArca: VEU), (NYSEArca: BND), (NYSEArca: VNQ), (NYSEArca: VWO), (NYSEArca: DBC), ), (MUTF: PTTDX) which is a substitute for (MUTF:PTTRX performs reasonably compared to any of the plans we have reviewed. If you want to stop there, you have a simple, manageable set of funds that should compete well with most plans.
Our contention is that while there are a few plans with fewer asset classes that perform very well, the best thing to do is to maximize diversification and work from there.We will go on and see how we can improve performance further by looking at adding funds within an asset class.
If there are readers that would like to look into some of the plans that stand out from this article, please feel free to contact us.
Disclosure:MyPlanIQ does not have any business relationship with the company or companies mentioned in this article. It does not set up their retirement plans. The performance data of portfolios mentioned above are obtained through historical simulation and are hypothetical.
Symbols: ,(NYSEArca,VTI,),(NYSEArca,VEU),(NYSEArca,BND),(NYSEArca,VNQ),(NYSEArca,VWO),(NYSEArca, ,DBC),(MUTF,PTTRX),(MUTF,PTTDX),
- How Good Is The Six Asset ETF Benchmark Really?
03/09/2011
- How Good Is The Six Asset ETF Benchmark Really?
03/09/2011
- How Good Is The Six Asset ETF Benchmark Really?
03/09/2011
- How Good Is The Six Asset ETF Benchmark Really?
03/09/2011
- How Good Is The Six Asset ETF Benchmark Really?
03/09/2011