 |
Vanguard ETF: |  |
7.4%* |
|
Diversified Core: | |
8.1%* |
|
Six Core Asset ETFs: | |
7.3%* |
Articles on VEU)
- Six Versus Five SIB
03/24/2011
Life moves quickly. Already this year we have seen troubles in Egypt being supplanted by Tunisia and Bahrain. This was swept into the background by the triple disasters in Japan and now Libya grabs the headlines. All of this twists and turns markets all the while, we may worry about how that impacts our retirement as well as being caught up in the human tragedy.
One of the most glaring holes in our education system is retirement investing. As a result, we feel afraid and powerless and look to “big brother” to help out. Be aware that some of the biggest pension schemes in the country are failing with terrible returns. Many states are in real trouble because of the pension liabilities so they aren’t doing any better. As inflation bites, it is unlikely that these pension schemes will keep up. In any case, increasingly they are a thing of the past. 401K plans have moved from being an adjunct to a pension plan to being the mainstay of retirement income. In a study of over 800 mainly retirement plans, we noted that the majority of plans supported only three asset classes which is going to have a significant impact on the potential returns for the participant.
Asset Classes Number of plans Three 59 Four 23 Five 14 Six 4
Sadly, only 4% of the plans we reviewed had the six asset classes to build the sort of portfolios necessary to optimize returns and minimize risk.In a previous article we found reviewed historical simulations from a five asset class plan would, over a decade, put 75% more money in your pocket compared to a three asset plan which is the staple of most 401(K) plans. In this article, we are going to add commodities as another class to provide diversification protection.
We use a simple benchmark vehicle -- SIB -- simpler is better to show the potential difference in returns between the portfolios with different numbers of asset classes.
Each of the SIBs are built from one ETF per asset class. The ETFs we selected for these portfolios are as follows:
Asset Class Ticker Name LARGE BLEND VTI Vanguard Total Stock Market ETF Foreign Large Blend VEU Vanguard FTSE All-World ex-US ETF DIVERSIFIED EMERGING MKTS VWO Vanguard Emerging Markets Stock ETF REAL ESTATE VNQ Vanguard REIT Index ETF COMMODITIES BROAD BASKET DBC PowerShares DB Commodity Idx Trking Fund Intermediate-Term Bond BND Vanguard Total Bond Market ETF So the three asset SIB has (VTI), (VEU) and (BND). The four asset SIB adds emerging markets (VWO). The five asset SIB adds Real Estate (VNQ). The six asset SIB adds commodities (DBC). Note that these ETFs were chosen arbitrarily. If you want to see a range of alternatives and their relative performance, MyPlanIQ maintains updated information on major ETFs in most asset classes.
Commodities can be volatile and some may have trepidation in owning this type of asset. ETF's which are broadly diversified reduce the volatility and don't rely on fund managers who can be hit or miss. In the coming years, commodities will be important and have already shown their value as inflation is an issue in emerging markets and will shortly start to arise more locally.
If we compare the historical returns between the five and six asset SIBs, we can see the benefit of adding the extra asset class.
Performance chart (as of Mar 2, 2011)
Performance table (as of Mar 2, 2011)
Portfolio Name 1Yr AR 1Yr Sharpe 3Yr AR 3Yr Sharpe 5Yr AR 5Yr Sharpe Six Core Asset ETF Benchmark Tactical Asset Allocation Moderate 16% 129% 9% 74% 13% 88% Six Core Asset ETF Benchmark Strategic Asset Allocation Moderate 17% 152% 4% 19% 7% 32% Five Core Asset ETF Benchmark Tactical Asset Allocation Moderate 12% 104% 7% 65% 10% 69% Five Core Asset ETF Benchmark Strategic Asset Allocation Moderate 16% 139% 4% 16% 6% 22% If we ignore the short term difference -- which are not insignificant -- and look at the five year returns we see a difference between five and six assets.. Note that the difference in returns between three and six asset SIB, over a decade -- puts more than twice the amount of money in your nestegg.
We also note that after starting the year very strongly, US Equities gave back much of their gains over the past month -- something that a portfolio with access to commodities and real estate mitigated to a large degree.
You may not have all the asset classes in your current 401K plan -- but if you have an IRA or the chance to rollover an old 401K into an IRA and assemble a six asset portfolio, you will thank yourself when you retire.
Disclosure: MyPlanIQ does not have any business relationship with the company or companies mentioned in this article. It does not set up their retirement plans. The performance data of portfolios mentioned above are obtained through historical simulation and are hypothetical.
Exchange Symbols:(NYSE,VTI),(NYSE, ,SPY),(NYSE,VEU),(NYSE,EFA),(NYSE,VWO),(NYSE,EEM),(NYSE,VMQ),(NYSE,IYR),(NYSE,BND),(NYSE,AGG),(NYSE,IEI),(NYSE,SHY),(NYSE,TIP),(NYSE,EFV),(NYSE,IWM),(NYSE,IWN),(NYSE,IWW), - Fund Advice Lazy Portfolio Performs Well in Good Times -- Be Cautious in Choppy Markets
03/22/2011
Retirement investing is a long term proposition and is similar to looking after your health – do what is sensible and have occasional checkups that become more frequent as you age. One of the most glaring holes in our education system is retirement investing. As a result, we feel afraid and powerless and look to “big brother” to help out. Be aware that some of the biggest pension schemes in the country are failing with terrible returns . Many states are in real trouble because of the pension liabilities so they aren’t doing any better. As inflation bites, it is unlikely that these pension schemes will keep up. In any case, increasingly they are a thing of the past.
A simple portfolio (six ETFs – index funds – no fancy management – one fund for each of six different classes). over a five year period, buy and hold has returned 7% and a more active momentum strategy has returned 13%. This is a simple, easy to understand fund and investment approach that can be used as a benchmark for what others are telling you.
We are investigating and breaking down luminary portfolios for ideas and approaches to retirement investing to help gain understanding and experience.
The FundAdvice Ultimate Buy and Hold Portfolio is tracked by MarketWatch.com's lazy portfolios, maintained by Paul Farrel. The portfolio is very diversified in equity asset classes although corporate bonds are missing. The plan consists of 11 funds. These funds enable participants to gain exposure to 5 major assets: US Equity, Foreign Equity, REITs, Emerging Market Equity, Fixed Income.Asset Class Ticker Original Portfolio Holdings
DIVERSIFIED EMERGING MKTS VEIEX 6% LARGE BLEND VFINX 6% Intermediate Government VFITX 20% SHORT GOVERNMENT VFISX 12% Inflation-Protected Bond VIPSX 8% Foreign Large Value VTRIX 12% Foreign Large Blend VDMIX 12% SMALL BLEND NAESX 6% SMALL VALUE VISVX 6% LARGE VALUE VIVAX 6% REAL ESTATE VGSIX 6% Asset Class Number of funds Lazy Portfolio Percentage Balanced Fund 0 REITs 1 6 Fixed Income 3 40 Commodity 0 Foreign Equity 2 24 Emerging Market Equity 1 6 US Equity 4 24 Other 6 Total 11
As of Mar 21, 2011, this plan investment choice is rated as average based on MyPlanIQ Plan Rating methodology that was designed to measure how effective a plan's available investment funds are . It has the following detailed ratings:Diversification -- Rated as average (49%)
Fund Quality -- Rated as average (48%)
Portfolio Building -- Rated as above average (72%)
Overall Rating: average (58%)Portfolio Discussions
This is a well balanced portfolio with access to five asset classes. In the original, Emerging markets and Real Estate is underweighted and Commodities are not represented at all. We are going to compare the original portfolio with an ETF portfolio with standard Strategic Asset allocation and Tactical Asset allocation weightings.
The ETF Portfolio has:
(EEM) for emerging markets, (SPY) forlarge blend, (IEI) for the intermediate government bond, (SHY) for the short treasury, (TIP) for inflation protected bonds, (EFV) for foreign large blend, (IWM) for the small blend, (IWN) as small value, (IWW) for large value, (IYR) for real estate
SAA will have 40% in Fixed income and 15% in each of the other asset classes
TAA will have 40% in Fixed income and 30% in the two top performing asset classesThe ETF portfolio uses a simpler structure -- one ETF for each asset class -- VTI or SPY, VEU or EFA, VWO or EEM, VMQ or IYR, BND or AGG.
With any of these ETFs, we would expect the performance would be similar to the Mutual Fund versions because they have high trading volume. They don't have the same history as the Mutual Funds if you want to go back ten years.
Performance table (as of Mar 21, 2011)
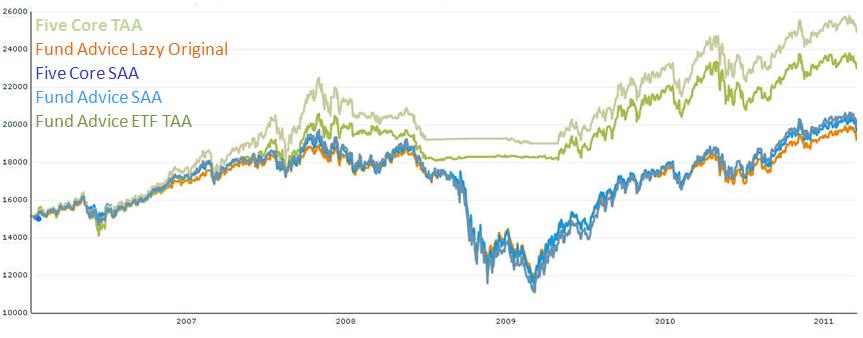
Portfolio Performance Comparison
Portfolio Name 1Yr AR 1Yr Sharpe 3Yr AR 3Yr Sharpe 5Yr AR 5Yr Sharpe FundAdvice Ultimate Buy and Hold Lazy Portfolio ETFs SAA
12% 87% 4% 18% 5% 20% Fund Advice Ultimate Buy and Hold Lazy Portfolio 10% 72% 4% 15% 5% 21% Five Core Asset ETF Benchmark Strategic Asset Allocation Moderate 12% 76% 5% 16% 5% 19% Five Core Asset ETF Benchmark Tactical Asset Allocation Moderate 7% 42% 8% 60% 10% 63% FundAdvice Ultimate Buy and Hold Lazy Portfolio ETFs TAA
5% 23% 6% 45% 8% 55%
What we can see is that the buy and hold strategies -- the original portfolio and the two strategic asset allocation portfolios -- were running neck and neck with the tactical portfolios until we started to hit significant market turbulence around 2007. Until the spring of 2009 the tactical portfolios were clearly ahead but as we came out of the recession, it's possible to see that the buy and hold strategies have closed the gap somewhat. This is a great way of understanding what the two approaches bring over the long term.
We note that the buy and hold strategies are virtually indistinguishable. The original portfolio has been well chosen in the sense that it is only rebalanced once a year and there is no rotation of sub-classes (for example between the different fixed income or US equity classes) and it has barely suffered at all. In a future article we will drill into the last few months and see whether moving some or all of the fixed income into cash has helped the two SAA portfolios squeeze out a little more of late.
We also not the difference between the two TAA portfolios. The Five asset benchmark with only one fund per asset class has outperformed the plan with multiple choices. Research has shown that rotating assets in subclasses can bring benefits but, in recent days, that hasn't proven to be the case with the exception of moving fixed income to cash. The simple benchmark plans have done remarkably well over the past five years.
The key takeaways are:- Over the longer term, when there have been downturns in the market, a tactical asset allocation strategy wins out
- When the markets are doing well, buy and hold wins out
- Be careful about asset class rotation -- it doesn't always give you the best returns
- You have to be involved and aware to get the most out of your investments
We can expect choppy markets over the next few months and care should be taken as to which strategy is selected.
Disclosure:MyPlanIQ does not have any business relationship with the company or companies mentioned in this article. It does not set up their retirement plans. The performance data of portfolios mentioned above are obtained through historical simulation and are hypothetical.
Exchange Symbols:(NYSE,VTI),(NYSE, ,SPY),(NYSE,VEU),(NYSE,EFA),(NYSE,VWO),(NYSE,EEM),(NYSE,VMQ),(NYSE,IYR),(NYSE,BND),(NYSE,AGG),(NYSE,IEI),(NYSE,SHY),(NYSE,TIP),(NYSE,EFV),(NYSE,IWM),(NYSE,IWN),(NYSE,IWW), - Earthquakes and Wars Call for Diversification and Tactical Asset Allocation in Investing
03/20/2011
Investing for wealth preservation and growth or for retirement purpose is by definition a long term process. In a long term period, experiencing wars, natural disasters and political or social unrests is a fact of life. How to deal with and navigate through these threatening events is pertinent to the success to achieve financial goals.
As baby boomers are exiting or getting ready to exit the work force, this year suddenly saw many dramatic events unfolding: Japan's earthquake and the still unfolding nuclear power meltdown events, the middle east violence with fear of radical islamic involvement and, this weekend's airstrike by allied forces on the Libyan regime are all pointing to certain tipping points in the world economic and political landscape. The new generations and the baby boomers suddenly find themselves in a world with entangled dangerous events.
The events certainly made their marks on financial markets: the big swings of the Dow Jones Industrial stocks (DJI) and S&P 500 stocks (SPY) left a dent on the otherwise stubborn euphoric markets. Most risk assets including U.S. stocks (SPY) (VTI), international stocks (EFA) (VEU), emerging market stocks (EEM) (VWO) and REITs (IYR) (VNQ) (RWX) lost ground in the last week. The only standout in the group is commodities (DBC) (GSG). For the week, DBC actually gained 0.78% while gold (GLD) gained 0.11%. For more detailed performance information, please refer to here.The key to succeed in long term investing lies in adopting sound and consistent (thus long term) strategies in managing one's portfolios. Buy and hold of a basket of major assets with properly calculated risk tolerance is one way. A more maverick way can enhance return with lower risk by adopting some tactical moves in asset allocaiton. Let's first review the following portfolios using a strategic asset allocation (buy and hold among equal weights on risk assets):A. Three Core Asset ETF Benchmark Strategic Asset Allocation Moderate (US Equity (VTI) (SPY), International Equity (VEU) and Fixed Income (BND))B. Four Core Asset ETF Index Funds Emerging Markets Strategic Asset Allocation Moderate (additonal Emerging Market Equity (VWO) (EEM))C. Five Core Asset ETF Benchmark Strategic Asset Allocation Moderate (additional US REITs (VNQ) (IYR) added)D. Five Core Asset ETF With Commodity Benchmark Strategic Asset Allocation Moderate(additional commodities (DBC) added to the four asset portfolio)E. Six Core Asset ETFs Strategic Asset Allocation Moderate (include US Equity, International Equity, Emerging Market Equity, REITs, Commodities and Fixed Income)
Portfolio Performance Comparison
Portfolio Name 1Yr AR 1Yr Sharpe 3Yr AR 3Yr Sharpe 5Yr AR 5Yr Sharpe Three Core Asset ETF Benchmark Strategic Asset Allocation Moderate 10% 69% 3% 13% 4% 14% Six Core Asset ETFs Strategic Asset Allocation Moderate 11% 89% 4% 17% 7% 31% Four Core Asset ETF Index Funds Emerging Markets Strategic Asset Allocation Moderate 9% 70% 4% 17% 6% 26% Five Core Asset ETF With Commodity Benchmark Strategic Asset Allocation Moderate 11% 85% 3% 12% 6% 29% Five Core Asset ETF Benchmark Strategic Asset Allocation Moderate 11% 76% 4% 16% 5% 19%
For the week, Six Core Asset ETFs Strategic Asset Allocation Moderate lost 0.34% compared with 0.66% loss of Five Core Asset ETF Benchmark Strategic Asset Allocation Moderate or 0.68% loss of Three Core Asset ETF Benchmark Strategic Asset Allocation Moderate. With the smaller loss of REITs and the commodity performance, diversification does show its advantage during the market stress.The last ten years experienced two major economic downturns: the technology bubble burst in 2000-2002 and the financial bubble burst in 2008-2009. The pure buy and hold strategy, even with proper diversification, does not shield its portfolios from big loss. A more active portfolio strategy such as this tactical asset allocation strategy (TAA) can be used. The following again compares the five portfolios with 3,4,5,6 assets using TAA. All of them are moderate risk portfolios.
Portfolio Performance Comparison
Portfolio Name 1Yr AR 1Yr Sharpe 3Yr AR 3Yr Sharpe 5Yr AR 5Yr Sharpe Three Core Asset ETF Benchmark Tactical Asset Allocation Moderate -3% -32% 2% 16% 4% 28% Six Core Asset ETFs Tactical Asset Allocation Moderate 9% 67% 10% 78% 14% 96% Four Core Asset ETF Index Funds Emerging Markets Tactical Asset Allocation Moderate -2% -16% 7% 62% 10% 64% Five Core Asset ETF With Commodity Benchmark Tactical Asset Allocation Moderate 2% 18% 5% 43% 10% 64% Five Core Asset ETF Benchmark Tactical Asset Allocation Moderate 6% 42% 7% 60% 10% 63% The six asset portfolio with TAA actually had a slight gain in the last week and it is also positive in the last month. This clearly illustrates that tactical asset allocation over a diverse array of major assets can be effective.The following table shows the trend scores of major assets ending 3/18/2011.
The trend score is defined as the average of 1,4,13,26 and 52 week total returns (including dividend reinvested).Assets Class Symbols 03/18
Trend
Score03/11
Trend
ScoreDirection Commodities DBC 14.15% 12.94% ^ Gold GLD 8.86% 9.46% v US Equity REITs VNQ 5.89% 8.03% v US Stocks VTI 5.55% 8.03% v International Treasury Bonds BWX 5.07% 4.04% ^ International REITs RWX 4.27% 6.89% v US High Yield Bonds JNK 3.74% 4.13% v Emerging Market Stks VWO 2.97% 4.64% v Intermediate Treasuries IEF 1.82% 1.16% ^ US Credit Bonds CFT 1.71% 1.71% v Total US Bonds BND 1.12% 0.97% ^ International Developed Stks EFA 0.87% 3.28% v Emerging Mkt Bonds PCY 0.57% 1.18% v Mortgage Back Bonds MBB 0.23% 0.12% ^ Treasury Bills SHV 0.05% 0.05% v Municipal Bonds MUB -0.9% -1.22% ^ Frontier Market Stks FRN -3.22% 1.01% v In conclusions, no one has a crystal ball to predict the future. The effective way to cope with major risks for mankind is to adhere to sound portfolio strategies such as asset allocation with diversification and tactical allocation based on prevailing events.
Symbols:EEM,VNQ,FRN,VWO,IYR,ICF,GLD,RWX,VTI,SPY,IWM,PCY,EMB,JNK,HYG,PHB,EFA,VEU,IEF,TLT,GSG,DBC,DBA,CFT,BWX,MBB,BND,MUB,SHV,AGG ,Exchange,Tickers,(NASDAQ,EEM),(NASDAQ,VNQ),(NASDAQ,FRN),(NASDAQ,VWO),(NASDAQ,IYR),(NASDAQ,ICF),(NASDAQ,GLD),(NASDAQ,RWX),(NASDAQ,VTI),(NASDAQ,SPY),(NASDAQ,IWM),(NASDAQ,PCY),(NASDAQ,EMB),(NASDAQ,JNK),(NASDAQ,HYG),(NASDAQ,PHB),(NASDAQ,EFA),(NASDAQ,VEU),(NASDAQ,IEF),(NASDAQ,TLT),(NASDAQ,GSG),(NASDAQ,DBC),(NASDAQ,DBA),(NASDAQ,CFT),(NASDAQ,BWX),(NASDAQ,MBB),(NASDAQ,BND),(NASDAQ,MUB),(NASDAQ,SHV),(NASDAQ,AGG),
Disclosure:
MyPlanIQ does not have any business relationship with the company or companies mentioned in this article. It does not set up their retirement plans. The performance data of portfolios mentioned above are obtained through historical simulation and are hypothetical.
- RWO, RWR Replace VNQ in the Six Asset Portfolio
03/20/2011
We are working through a series of articles to help improve returns for retirement investors. Aging boomers highlight the major retirement crisis as they come to the end of their working careers. They don’t have enough money. There is no money to bail out retirement – it’s already been spent on salvaging the economy for the working. It is going to be up to the individual to make the most of what they have. They will have to accept less or work longer or achieve better returns from their investments
We believe that it is possible for the individual to be more involved with their retirement investing and to see better results. These articles are intended to help build the foundational understanding that will enable better returns, lower risk and less angst in our lives.
What we have seen is:- Increasing diversification from three areas to six can make a significant impact on simulated historical returns
- Only a few retirement plans (~4%) have six asset classes but it may be possible to create a holistic portfolio with the combination of IRA and 401K plans
- We have added a managed bond fund in this critical area at a time when fixed income is under pressure and that part of the portfolio would benefit from active management. Note that we have picked what is probably one of the gold standards of recent years and not all managers are created equal
- The current set of funds we have developed are VTI, VEU, BND, VNQ, VWO, DBC, PTTDX
- We replaced VTI with LargeCap Blend RSP, MidCap Value IJJ SmallCap Growth VBK
- (NYSEArca: VTI ), (NYSEArca: VEU), (NYSEArca: BND), (NYSEArca: VNQ), (NYSEArca: VWO), (NYSEArca: DBC), (MUTF:PTTRX), (MUTF: PTTDX), (NYSEArca: RSP), (NYSEArca: IJJ), (NYSEArca: VBK),
In the last article we saw that adding three US ETFs in place of VTI didn't move the needle much. That doesn't mean that it is not valuable to have the funds, just that the market dynamics didn't show the benefit.It is likely that the benefits will be seen in future as SmallCap Growth are currently leading the US equities league table
In this article, we are going to focus on Real Estate Trusts. Anything with Real Estate in its name causes a visceral reaction as Real Estate was the notional straw that broke Wall Street's back and while the recovery is happening, we are not out of the woods. However, Real Estate Trusts are not consumer biased and they have been strong contributors to portfolios over the past year.
To keep the portfolio as small as possible, I am going to have two funds -- one domestic and one international.U.S. REITs
Description Symbol 1 Yr 3 Yr 5 Yr Avg.
Volume(K)1 Yr Sharpe Vanguard REIT Index ETF VNQ 30.39% 3.38% 1.97% 1,694 174.86% SPDR Dow Jones REIT RWR 31.88% 2.47% 0.57% 243 184.72% iShares Cohen & Steers Realty ICF 33.82% 0.56% -0.1% 616 191.7% iShares Dow Jones US Real Estate IYR 29.32% 1.97% -0.14% 7,342 176.35%
The US REITs are ordered by they five year returns. While VNQ has the best five year return, it is at the bottom of the list over the past one year. ICF is attractive in the short term but has poor medium term performance. Therefore, I selected RWR as it has better short term properties and will likely be better going forward. Again, I am not an expert in researching likely forward looking returns, others may be.International REITs
Description Symbol 1 Yr 3 Yr 5 Yr Avg.
Volume(K)1 Yr Sharpe SPDR Dow Jones Global Real Estate RWO 27.78% NA NA 71 144.86% SPDR Dow Jones Intl Real Estate RWX 24.45% -3.57% NA 312 106.56% WisdomTree International Real Estate DRW 22.25% -3.97% NA 32 99.26% iShares S&P Dev ex-US Property WPS 16.81% -4.01% NA 20 79.7% iShares FTSE EPRA/NAREIT Dev Real Estate IFGL 13.32% -5.29% NA 66 65.6%
When we examine the international REITs, we see that they have a shorter history so they were sorted on the three year returns and RWO came out the clear winner.
My two picks areIt is possible to make different selection and measure historical returns but these are the choices I make for this exercise and we will now review the historical returns against the previous version with just VNQ. Note that I have removed VNQ from the list of fund choices.
Attribute Six Core Asset ETF Benchmark With PTTRX-3USETfs-2REIT Six Core Asset ETF Benchmark With PTTRX-3USETFs Diversification above average (68%) above average (65%) Fund Quality average (37%) average (54%) Portfolio Building above average (80%) above average (83%) Overall Rating average (64%) above average (69%)
Performance chart (as of Mar 10, 2011)Performance table (as of Mar 10, 2011)
Portfolio Name 1Yr AR 1Yr Sharpe 3Yr AR 3Yr Sharpe 5Yr AR 5Yr Sharpe Six Core Asset ETF Benchmark With PTTRX-3USETfs-2REIT Tactical Asset Allocation Moderate 11% 82% 10% 79% 14% 96% Six Core Asset ETF Benchmark With PTTRX-3USETfs-2REIT Strategic Asset Allocation Moderate 16% 128% 6% 28% 8% 38% Six Core Asset ETF Benchmark With PTTRX-3USETFs Tactical Asset Allocation Moderate 13% 96% 11% 84% 14% 98% Six Core Asset ETF Benchmark With PTTRX-3USETFs Strategic Asset Allocation Moderate 16% 124% 7% 31% 8% 40%
We have already noted that the graph is going to be misleading because of the youth of the ETFs. VTI and VNQ were available before RWO, RWR, RSP, IWS and IJT so, in the early days, we were comparing portfolios with different numbers of asset classes. We have also noted that VNQ beat RWR in the longer time horizon and RWO was not available in the five year horizon but only in the three year horizon.
Notes- In the longer term there is no appreciable difference at least rounded up to the nearest whole percent
- In the three year time frame the plan with the extra funds beats the other by 1% over both strategic and tactical asset allocation
- In the short term, the simpler plan actually outperformed the plan with more funds which seems counter intuitive
We have already covered the limitations of momentum strategies and how that pertains to rotating sub-classes. The asset class rotation was not effective in the one year timeframe for Tactical asset allocation and the as both SAA and TAA will deploy both the REITs and their aggregate performance almost equal to VNQ so the SAA strategies are identical.
It is important to weigh the merits of historical performance which is past with the hope for future performance. The choices made here were with an eye to the future. International REIT will hopefully provide better diversification to minimize volatility and capture gains and the choice of the newer funds with better short term performance should hopefully give better returns. However, there is not a huge difference and it could be, for the sake of simplicity, one would want to keep this at one fund..
Disclosure:MyPlanIQ does not have any business relationship with the company or companies mentioned in this article. It does not set up their retirement plans. The performance data of portfolios mentioned above are obtained through historical simulation and are hypothetical.
Symbols:VTI,VEU,BND,VNQ,VWO,DBC,PTTDX,RSP,IJJ,VBK,EFA,RWO,RWR,(NYSEArca,VTI,),(NYSEArca,VEU),(NYSEArca,BND),(NYSEArca,VNQ),(NYSEArca,VWO),(NYSEArca, ,DBC),(MUTF,PTTRX),(MUTF,PTTDX),(NYSE,RSP),(NYSE,VBK),(NYSE,IJJ),(NYSE,EFA),(NYSE,RWR),(NYSE,RWO) ,
- Swensen Six Asset Lazy Portfolio Review Exhibits Different Q1 Behavior
03/19/2011
In the last article, we looked over the prior year's returns for the Swensen Six Lazy Portfolio. David Swensen, the Yale Endowment Investment Manager, proposed this portfolio for individual investors.
- 30% in Vanguard Total Stock Market Index (MUTF: VTSMX) ), (NYSE: VTI)
- 20% in Vanguard REIT Index (MUTF: VGSIX), (NYSE: VNQ)
- 20% in Vanguard Total International Stock (MUTF: VGTSX) or 15% in (VGTSX) and 5% in (MUTF: VEIEX), (NYSE: VEU), (NYSE: VWO), (NYSE: VEA)
- 15% in Vanguard Inflation Protected Securities (MUTF: VIPSX), (NYSE: TIP)
- 15% in Vanguard Long Term Treasury Index (MUTF: VUSTX), (NYSE: LQD)
We made one year comparisons between
- The original Swensen funds with an annual rebalance. Swensen himself performs a daily rebalance but that is too onerous for the general user
- The original Swensen funds with a quarterly rebalance. Normal protocal for advisors is to have a quarterly review of a portfolio and that is what this is
- The Swensen funds with the MyPlanIQ strategic asset allocation for a moderate portfolio, 40% bonds 20% in each of the other three asset classes
- The Swensen funds with the MyPlanIQ tactical asset allocation for a moderate portfolio, 40% bonds 30% in each of the top two asset classes or moved to fixed income (including cash)
- The Six Core Asset ETF Benchmark
Portfolio Performance Comparison
Portfolio Name 1Yr AR 1Yr Sharpe 3Yr AR 3Yr Sharpe 5Yr AR 5Yr Sharpe David Swensen Six Asset Individual Investor Plan Strategic Asset Allocation Moderate 9% 109% 4% 21% 6% 31% David Swensen Six Asset Individual Investor Plan Tactical Asset Allocation Moderate 9% 100% 8% 75% 11% 83% P David Swensen Yale Individual Investor Portfolio Annual Rebalancing 14% 110% 5% 22% 5% 22% P David Swensen Yale Individual Investor Portfolio Quarterly Rebalancing 15% 115% 5% 21% 5% 20% Six Core Asset ETF Benchmark Tactical Asset Allocation Moderate 12% 86% 8% 65% 13% 88%
We now drill down into the first quarter of 2011 to see where differing market conditions test the portfolio's performance. As we come to the end of the QEII program, we expect to see pressure on fixed income. PIMCO recently moved more heavily into cash and fixed income has been under pressure in general for a couple of quarters. In addition, with inflation becoming a reality in the emerging world, the lack of commodities could result in a drop in returns.We previously noted that the buy and hold portfolios outperformed the momentum portfoilos over the past year. However, as we look into the end of that year (March 2010 - March 2011), we see a different picture emerging. There are a lot of moving parts as the fixed income segment is under a lot of pressure which is only exacerbated by the end of QEII. Inflation is making commodities more desirable followed by real estate and US Equities.
By looking at the current Major Asset Class Trends (note that we include Gold even though it isn't a major asset trend in its own right) we can see that Commodities are clearly leading the field. Real Estate and US Equities are running neck and neck and fixed income is at the bottom of the table.
Major Asset Classes Trend
03/11/2011
Description Symbol 1 Week 4 Weeks 13 Weeks 26 Weeks 52 Weeks Trend Score Commodities DBC -3.09% 2.93% 12.39% 27.11% 25.38% 12.94% Gold GLD -0.81% 4.46% 2.08% 13.55% 28.04% 9.46% US Stocks VTI -1.42% -1.83% 6.16% 20.86% 16.39% 8.03% US Equity REITs VNQ 0.03% -1.17% 7.18% 11.52% 22.59% 8.03% International REITs RWX -2.38% 0.62% 3.97% 12.27% 19.95% 6.89% Emerging Market Stks VWO -2.15% 0.96% -0.17% 10.17% 14.38% 4.64% US High Yield Bonds JNK -0.52% 0.13% 4.14% 7.46% 9.42% 4.13% International Treasury Bonds BWX -0.23% 2.98% 4.84% 6.29% 6.33% 4.04% International Developed Stks EFA -3.09% -2.45% 2.97% 12.37% 6.61% 3.28% US Credit Bonds CFT 0.57% 1.48% 1.49% -0.3% 5.3% 1.71% Emerging Mkt Bonds PCY 0.65% 1.93% -1.05% -1.84% 6.23% 1.18% Intermediate Treasuries IEF 0.71% 2.07% 0.2% -2.75% 5.59% 1.16% Frontier Market Stks FRN -0.59% -0.99% -9.1% -0.5% 16.21% 1.01% Total US Bonds BND 0.55% 1.57% 0.56% -0.72% 2.92% 0.97% Mortgage Back Bonds MBB 0.47% 1.64% 0.46% -2.36% 0.41% 0.12% Treasury Bills SHV 0.04% 0.03% 0.04% 0.06% 0.09% 0.05% Municipal Bonds MUB -0.08% -0.58% 1.34% -5.02% -1.76% -1.22% Comparing the different plans, they each have slightly different properties
- The two original Swensen plans will only rebalance, there is no notion of rotating funds -- with the simplicity of the plan, this only makes sense with the fixed income portion
- The Swensen plan with TAA and SAA do have the ability to rotate fixed income funds into cash or each other with a 90 day redemption period restriction
- The Benchmark has commodities and the ability to rotate funds into cash with a 30 day redemption period
Currently
- The Six Asset Benchmark has moved all the fixed income to cash and has the risk assets in real estate and commodities.
- The Swensen TAA is in cash Real Estate and US Equities
- The Swensen SAA has 15% in cash and 15% in inflation protected (TIP, VIPSX), the balance distributed over US, international and Real Estate
The takeaways from the last quarter's review are:- Equities have still been doing well so that the buy and hold of the original Swensen portfolio with only 30% in fixed income is doing well
- The benchmark still trumps the original portfolio based on exposure to Commodities and the ability to move out of fixed income into cash
- The Swensen TAA and SAA portfolios are weighed down by extra fixed income exposure and not access to commodities as well as not being able to quickly move in and out of sub-classes with a 90 day holding period
Our contention is, for those who are serious about optimizing their long term investments, that you have to be involved. A lazy portfolio is appealing because you can "fire and forget" with only quarterly adjustments. However, if you want more out of your investments and you accept that conditions will change, then a portfolio with monthly adjustments is more likely to give you better returns. It's our contention that a monthly review (not necessarily requiring action every month), is about the right frequency.Symbols:VTI,VEU,BND,VNQ,VWO,DBC,VEA,TIP,LQD,BND,EFA,PTTRX,PTTDX,RSP,VBK,IJJ,RWR,RWO,(NYSEArca,VTI,),(NYSEArca,VEU),(NYSEArca,BND),(NYSEArca,VNQ),(NYSEArca,VWO),(NYSEArca, ,DBC),(MUTF,PTTRX),(MUTF,PTTDX),(NYSE,RSP),(NYSE,VBK),(NYSE,IJJ),(NYSE,EFA),(NYSE,RWR),(NYSE,RWO) ,
- What Do Japan and Libya Tell Us About Retirement Investing?
03/17/2011
- Swensen Six Asset Lazy Portfolio Review
03/16/2011
- 'Safe' Assets' Trends Back to Positive: Risk Aversion Began?
03/14/2011
- How Good Is The Six Asset ETF Benchmark Really?
03/09/2011