 |
Vanguard ETF: |  |
7.4%* |
|
Diversified Core: | |
8.1%* |
|
Six Core Asset ETFs: | |
7.3%* |
Articles on VWO
- Armstrong Index Based Lazy Portfolio Returns Study
09/17/2010
Frank Armstrong, author of The Informed Investor, proposed thisportfolio for an MSN Money article. The two key points of the portfolio are that it has four asset classes (US, International, REIT, Bonds) and relies on market indices rather than active management.The portfolio uses index funds because index funds eliminate manager risk. It overweights small-cap stocks as small-cap stocks have historically outperformed large caps stocks. The portfolio has a strong value tilt, based on the theory that, over the long haul, beaten-down stocks will perform better than high-flying growth stocks.
This should be a low cost, well performing portfolio.The fund selection for testing the strategy is listed below with the ETF alternatives:- 9.25% in Vanguard Small Cap Value VISVX (SCZ)
- 9.25% in Vanguard Value VIVAX (SPY, IYY)
- 6.25% in Vanguard Small-Cap Growth VISGX (VBK)
- 6.25% in Vanguard 500 Index VFINX (IVW)
- 31% in Vanguard Total International Stock VGTSX (EFA)
- 8% in Vanguard REIT VGSIX (IYR, VNQ, RWX)
- 30% in Vanguard Short-Term Bond VBISX (BND, AGG)
Things to note about the portfolio:- This is designed as a lazy portfolio with limited rebalancing specified
- With 70% in equities, this would be considered an aggressive portfolio
- REIT is possibly underweighted
We will create historical returns of this portfolio as originally planned and then compare against strategic asset allocation (annual rebalance) and tactical asset allocation. This will measure:- The impact of equal weighting of the equities – bonds will be fixed at 30% -- SAA strategy
- The impact of actively managing the equities – bonds remain fixed at 30% -- TAA strategy
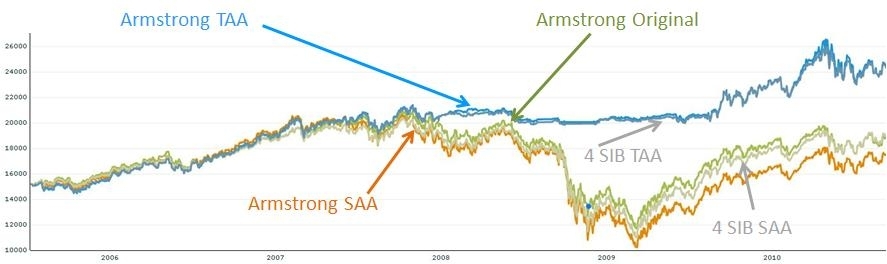
We will then introduce a four asset SIB which will give a measure of the choice of funds. The SAA and TAA strategies will give the same weights to each of the funds but use simpler asset classes funds.4 Asset SIB Breakdown with ETF alternativesLARGE BLEND VTSMX (VTI)Foreign Large Blend VGTSX (VEU)REAL ESTATE VGSIX (VNQ)Intermediate-Term Bond VBMFX (BND)The results are shown below. There are a number of interesting things to note- The closest comparison of similar strategies is the Armstrong Original versus the Armstrong SAA. The Armstrong original outperforms SAA which says that overloading the US stocks towards small value is successful
- All of the buy and hold strategies suffer from the “downturn dip” and the tactical asset allocation strategies perform much better
- The difference between the two TAA strategies is negligible
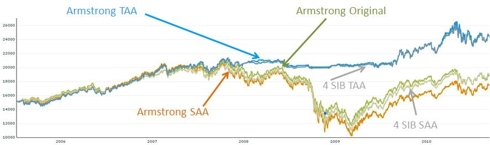
Annual Returns 1 Year 3 Years 5 Years Original 8.83 -0.88 4.27 Armstrong SAA 13.91 -2.60 2.96 Armstrong TAA 12.71 7.30 10.43 4 SIB SAA 14.12 0.25 4.59 4 SIB TAA 12.32 7.15 10.21
Takeaways:- The Armstrong portfolio is a well constructed set of diversified assets based on market indices
- To reduce volatility in today’s economy, it might make sense to add commodities and emerging market equities
- The biggest impact on returns is moving to a tactical asset allocation strategy
- The SIB portfolios which can easily be executed with ETF’s perform very well and will be low cost
labels:investment,
Symbols:DIA,IYY,VTI,DVY,ONEQ,QCLN,QABA,PWC,VTV,VUG,IWM,IWO,IWW,MDY,IJJ,IJK,VO,AGG,BND,SHY,VBK,IJS,VBR,IWP,IWS,VEA,EFG,EFV,VWO,VEU,SCZ,SPY,IYR,IVW,RWX,EFA,VNQ,Tactical,Asset,Allocation,asset,allocation,armstong,ideal,index,strategic,asset,allocation,
- How Does Your Garden Grow?
09/16/2010
Jim Lowell edits MarketWatch's ETF Trader, an investment letter employing a momentum-based exchange-traded-fund strategy for long-term investors. Large/small stocks, proposed his Sower's Growth Portfolio. This is a diversified portfolio of exchange-traded funds. The view is that a growing economy tends to create a growing portfolio.This portfolio is heavily equity and US focused. It is a diversified portfolio of exchange-traded funds including Big-caps ETF (DIAIYYONEQ PWC), Midcaps ETF(MDY), Small-caps ETF (IWM) and foreign ETF(EFA).The fund selection for testing the strategy is listed below with the ETF alternatives:
US Equities- 10% in Diamonds Trust DIA (SPY)
- 15% in iShares DJ U.S. Total Market IYY (VTI, DVY)
- 7.5% in Fidelity NASDAQ Composite ONEQ (QCLN, QABA)
- 7.5% in Power Shares Dynamic Market PWC (VTV, VUG)
- 10% in iShares Russell 2000 IWM (IWO, IWW)
- 15% in Mid Cap SPDR Trust MDY (IJJ, VO)
International Equities
- 25% in iShares MSCI International EAFE EFA (VEA, EFV)
- 10% in iShares MSCI Emerging Markets EEM (VWO)
Things to note about the portfolio:- 100% in equities is an aggressive portfolio
- 65% in US equities is high in today’s market environment
- There is no real estate (IYR, VNQ, ICF) or fixed income which would likely result in improved performance today
- With three asset classes (US, international and emerging markets), this can be mapped against a 3 asset class SIB
We will make a comparison of the performance of this portfolio against strategic asset allocation (equally spread assets), tactical asset allocation and against 3 asset class SIB portfolios we discussed in a previous article,The 3 asset class SIB breakdown- Large Blend VTSMX (ETF VTI)
- Foreign Large Blend VGTSX (ETF VEU)
- Intermediate-Term Bond VBMFX (ETF BND)
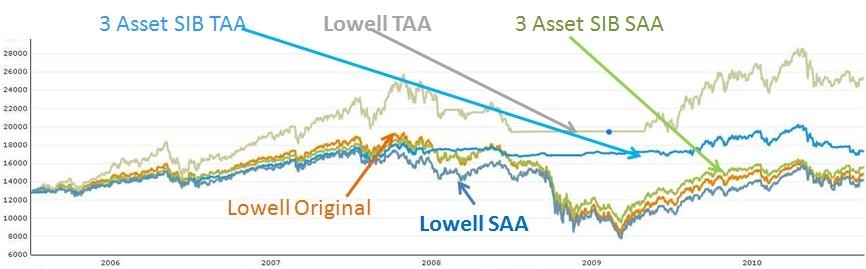
There are a number things to note about the comparisons:- The Lowell SAA and TAA were driven with a 100% in equities -- the TAA strategy will move to fixed income (cash) should the momentum drive it that way, the SAA strategy will not
- The 3 asset SIBs are using an aggressive model portfolio that still includes some fixed income
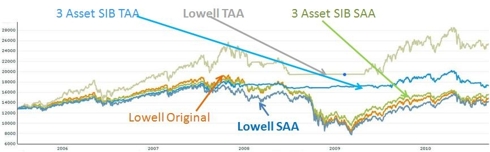
Summary Returns of Lowell's Portfolios Annual Returns 1 year 3 Year 5 Year Lowell Original 9.04 -5.38 2.25 Lowell SAA 13.14 -13.6 1.83 Lowell TAA 6.23 5.26 13.26 3 SIB SAA 7.03 -3.39 3.29 3 SIB TAA -4.23 0.63 5.76
The results are shown above. There are a number of interesting things to note :- The choice of funds, even if diversification enables reasonable returns
- Before the downturn, the original portfolio was outperforming everything except the dynamic allocation of the original strategy
- The strategy falls foul of the 2008/2009 downturn and tracks pretty closely with any buy and hold strategy
- The three asset SIBs have a fixed income fund that enables slightly better performance in choppier market conditions
- The Lowell choice of funds allows the tactical asset allocation strategy to outperform the three asset class SIB with TAA
- The 2008/2009 downturn shows the benefits of a tactical asset allocation – even if it means moving equities to cash
Takeaways:- The Sower’s growth portfolio is a low maintenance portfolio that is heavily weighted towards US equities. In the long term, there is still confidence in the US economy but following this portfolio and strategy will give you some heartache
- This portfolio was created when the sort of downturn we experienced in 2007/2008 was not envisioned -- it's hard to imagine that this portfolio would still be recommended today
- Migrating to a dynamic strategy with the same funds provides much higher returns. Given a dynamic strategy, it would make sense to add some fixed income such as AGG, BND, SHY, CSJ rather than just cash
- Conventional tactical asset allocation with the right number of asset classes (at least five) still provides the best performance
- ETF’s give you a good degree of choice a good vehicle for any portfolio and with increasing track record, it’s possible to demonstrate good historical performance
labels:investment,
Symbols:DIA,IYY,VTI,DVY,ONEQ,QCLN,QABA,PWC,VTV,VUG,IWM,IWO,IWW,MDY,IJJ,IJK,VO,AGG,BND,SHY,SPY,VBK,IJS,IWP,IWS,VEA,EFG,EFV,VWO,VEU,ETF,Asset,Allocation,Tactical,Asset,Allocation,
- John Wasik’s Nano Portfolio Performance Scrutinized
09/14/2010
John Wasik has been a professional journalist and author for 30 years specializing in personal finance, the environment, investing and social issues. John has proposed a Nano plan investment portfolio which employs just a handful of index or exchange- traded funds (ETFs) to cover virtually the entire world of bond and stock markets. This portfolio is supposed to be rebalanced annually.
John Wasik presents a classic asset allocation strategy with simple buy and hold.
- 20% in Vanguard Total Stock Market VIPERS (VTI) – alternatives: SPY, IWM
- 20% in Vanguard Total International (VGTSX) – alternatives: EFA, VEU, EEM, VWO, ADRE
- 20% in Vanguard REIT VIPERS (VNQ) – alternatives: IYR, ICF
- 20% in iShares Lehman TIPS Bond (TIP)
- 20% in iShares Lehman Aggregate Bond (AGG) – alternative: BND
Things to note about the portfolio:- With 40% in fixed income, this would be considered moderate risk
- With VGTSX covering both international and emerging markets (albeit in one fund) this would be something between a 4 and 5 asset class portfolio
- VGTSX is not an ETF; while VGTSX can easily be replaced by VEU (Vanguard FTSE All-World ex-US ETF) we will keep VGTSX because it has a longer history for back testing
We will make a comparison of the performance of this portfolio with
- Rebalancing every month as opposed to every year
- Simpler Is Better (SIB) portfolios we discussed in a previous article,
- Tactically managing the portfolio
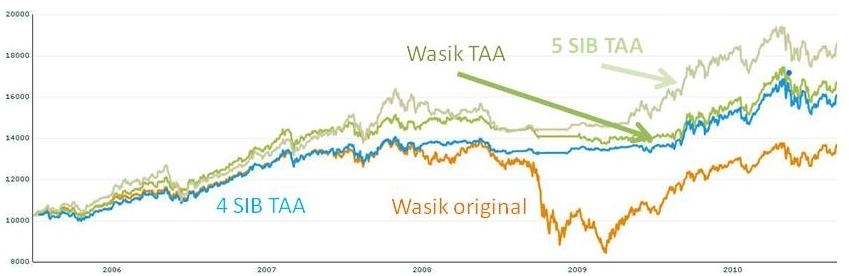
The first set of results compares strategic asset allocation performance. What we note is:
- All portfolios suffer from the sharp downturn and is what is driving the increasing move towards a tactical allocation strategy
- The lazy portfolio – rebalancing once a year performs as well as the monthly rebalancing
- Wasik’s portfolio performance matches the 4 Asset SIB closely
- The extra asset class in the 5 asset SIB enables it to outperform everything else
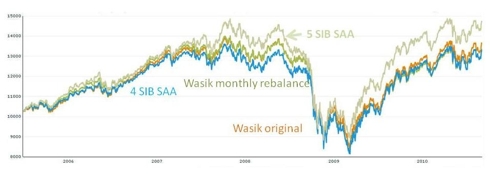
Wasik's portfolio against SIBs Annualized Returns 1 year 3 years 5 years Wasik original 16,75 1.22 5.03 Wasik monthly rebalance 16,27 0.18 4.39 4 SIB SAA 15.11 1.08 4.37 5 SIB SAA 15 2.35 6.33
The second set of results compares tactical asset allocation performance. What we note is:- The tactical asset allocation strategies clearly mitigate the downturn
- Wasik’s portfolio performance matches the 4 Asset SIB closely when tactical asset allocation strategies are applied to both
- The extra asset class in the 5 asset SIB enables it to outperform everything else
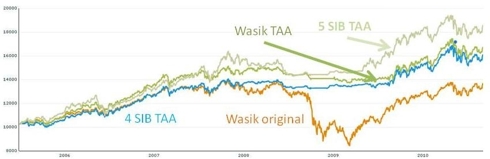
Annualized Returns 1 year 3 years 5 years Wasik TAA 16.53 8.47 10.43 4 SIB TAA 15.67 6.65 9.04 5 SIB TAA 12.62 8.13 11.35
Takeaways:- ETF’s are a good vehicle for any portfolio and with increasing track record, it’s possible to demonstrate good historical performance
- It is increasingly clear that deploying a tactical asset allocation strategy is key. All buy and hold strategies are going to suffer the same downturn properties and with choppy market conditions, minimizing downside risk is critical
- With a buy and hold, there is little difference between monthly or annual rebalancing so you can be very lazy if you don’t mind the downside!
- Five asset classes perform better in all cases – in the TAA case, the five asset SIB gives you an extra 6% a year since inception – doubling the asset base every decade
labels:investments,
Symbols:ti,vnq,tip,agg,veu,spy,iwm,efa,iyr,icf,bnd,eem,vwo,adre,
- Schwab ETFs Review
07/27/2010
In June, Schwab announced reducing expenses for their proprietary ETFs. This, along with recently announced commission free ETF trading from Schwab, Vanguard and Fidelity, represents an important and promising trend for ETFs in portfolio building. The following is the comparison among similar ETFs from Schwab, Vanguard and iShares.
Schwab Vanguard iShares Schwab U.S. Broad Market ETF SCHB (0.06%) VTI (0.07%) IWV(0.21%) Schwab U.S. Large-Cap ETF SCHX (0.08%) VV (0.12%) IVV (0.09%) Schwab U.S. Large-Cap Growth ETF SCHG (0.13%) VUG (0.14%) IVW (0.18%) Schwab U.S. Large-Cap Value ETF SCHV (0.13%) VTV (0.14%) IVE (0.18%) Schwab U.S. Small-Cap ETF SCHA (0.13%) VB (0.14%) IJR (0.20%) Schwab International Equity ETF SCHF (0.13%) VEA (0.14%) EFA (0.35%) Schwab International Small-Cap Equity ETF SCHC (0.35%) VSS (0.40%) SCZ (0.40%) Schwab Emerging Markets Equity ETF SCHE (0.25%) VWO (0.27%) EEM (0.72%) So far, Schwab ETFs are all equity (stock) index based funds that include U.S. stocks, international stocks and emerging market equity. Compared with iShares or even Vanguard, Schwab has been late in the game and their ETFs have short history. However, Schwab has a relatively good record in their mutual funds that are managed using quantitative models. That experience using quantitative models in their portfolio management certainly can help their ETF management. Ultimately, what it really matters for investors are the total returns of ETFs that reflect both expenses (taken out from asset under management, usually monthly) and fund performance before fee. The following is the total annualized return table for ETFs from Schwab, Vanguard and iShares up to 7/23/2010. All performance data are calculated from Schwab ETFs’ inception date.
Schwab Vanguard iShares Schwab U.S. Broad Market ETF (inception 11/03/2009) SCHB (11.78%) VTI (11.09%) IWV(11.9%) Schwab U.S. Large-Cap ETF (inception 11/03/2009) SCHX (10.57%) VV (9.54%) IVV (9.37%) Schwab U.S. Large-Cap Growth ETF (inception 1/4/2010) SCHG (-4.23%) VUG (-4.72%) IVW (-5.81%) Schwab U.S. Large-Cap Value ETF (inception 12/15/2009) SCHV (1.48%) VTV (1.06%) IVE (0.5%) Schwab U.S. Small-Cap ETF (inception 11/03/2009) SCHA (23.92%) VB (23.25%) IJR (22.08%) Schwab International Equity ETF (inception 11/03/2009) SCHF (-0.01%) VEA (-2.25%) EFA (-4.03%) Schwab International Small-Cap Equity ETF (inception 1/14/2010) SCHC (-9.51%) VSS (-8.43%) SCZ (-11.14%) Schwab Emerging Markets Equity ETF (inception 1/14/2010) SCHE (-3.09%) VWO (-2.49%) EEM (-5.77%) From their short history, it is very impressive that almost all of Schwab ETFs deliver better or no worse total returns: all Schwab ETFs outperform their iShares counterparts while, compared with Vanguard, only SCHE (emerging mkt equity) and SCHC (international small cap) slightly underperform Vanguard VWO and VSS respectively. Coupled with commission free trades for these ETFs, Schwab ETFs are very enticing for investors. The main drawback, however, is that Schwab does not offer ETFs in other major asset classes, especially in fixed income (it was reported that Schwab will soon provide fixed income ETFs). To build an effective portfolio, investors are forced to use other ETFs to cover missing major asset classes such as fixed income. Schwab charges $8.95 per trade for ETFs provided by other parties.
MyPlanIQ maintains Schwab Commission Efficient ETFs Plan. Since Schwab's ETFs only cover Domestic and International Equities, the additional ETFs are used to include other major asset classes including US REIT (IYR), Global REIT (IGR), Commodities (DBC, GLD), International Bonds (BWX), Fixed Incomes and Long/Intermediate/Short US Treasury Bonds (TLT, IEI, SHY) and High Yield Junk Bond (JNK). These additional ETFs are not commission free in a Schwab brokerage account. The strategic and tactical asset allocation moderate portfolios have the following performance:
1 Yr Annual Return 3 Year Annual Return 5 Year Annual Return Strategic Asset Allocation Moderate 20% 0% 3% Tactical Asset Allocation Moderate 4% 5% 6% In conclusion, like Vanguard ETFs, Schwab proprietary ETFs offer compelling values for portfolio building: low cost and commission free. To make their ETFs widely usable and competitive to iShares, however, Schwab (as well as Vanguard) needs to help to increase trading volume for these ETFs so that the tracking errors/friction could be reduced. This is perhaps the major important remaining obstacle for these ETFs to become staples for portfolios.
Symbols:schb,vti,iwv,schx,vv,ivv,schg,vug,ivw,schv,vtv,ive,scha,vb,ijr,schf,vea,efa,schc,vss,scz,sche,vwo,eem,iyr,icf,igr,dbc,gld,bwx,tlt,iei,shy,jnk,iyg,agg,bnd,
- Investing with Styles Can Pay off
07/09/2010
Portfolio construction consists of the following steps
- Decide personal risk profile which determines the target allocation in risk assets.
- Decide asset allocation method: strategic or tactical or both (strategic does not change target asset allocations while tactical can alter allocations more actively)
- Decide target allocation for each asset in a strategic asset allocation
- Periodically rebalancing portfolios
For a portfolio using strategic asset allocation, with long term target allocation being fixed (and only changed when major events such as approaching to retirement and children college education spending, for example), one can further enhance a portfolio return and reduce the risk by rebalancing and fund selection in an asset class. It is reported that adopting proper timing and way to rebalance a portfolio can improve return and reduce risk (see Daryanani opportunitstic rebalancing article). In this article, we focus on fund selection.
In a well designed portfolio for retirement plans (401K or IRA), it is a popular practice to have funds with various style exposures. In a stock/equity asset, a fund style is defined as value style (growth/blend/value) and size style (large/mid/small cap). The Morningstar 9 boxes of styles are essentially the combinations of the 3 value and 3 size styles. In a fixed income asset, a fund style is a combination of credit risk (junk/investment grade) and interest rate risk (short/intermediate/long) for corporate bonds or a just interest rate risk for treasury bonds. In an actively managed portfolio, it is a well recognized and widely practiced method to select funds based on style rotation to improve a portfolio alpha or return. For example, in an article published in Journal of Asset Management (May, 2007), B. Arshanapalli , L. Switzer and K. Panju concluded that active multi-style rotation strategies can be devised to outperform the best performing buy-and-hold portfolio.
MyPlanIQ maintains an index fund based plan or an ETF based plan using candidate funds based on those in a lazy portfolio proposed by Fund Advice Paul Merriman and maintained by MarketWatch.com (called Fund Advice Ultimate Buy and Hold Portfolio) (see here for the independently tracked portfolio on MyPlanIQ.com). The candidate funds and the original allocation are as follows
Index ETF Allocation Vanguard Interm-Tm Trs (VFITX) iShares 3-7 Year Treasury (IEI) 20% Vanguard Short-Tm Trs(VFISX) iShares 3-7 Year Treasury (SHY) 12% Vanguard Intl Val (VTRIX) iShares MSCI EAFE Value Index (EFV) 12% Vanguard Dev Mkts (VDMIX) iShares MSCI EAFE Index (EFA) 12% Vanguard Inflation-Prot (VIPSX) iShares TIPS Bond (TIP) 8% Vanguard Small-Cap Idx (NAESX) iShares Russell 2000 Index (IWM) 6% Vanguard Small-Cap Val (VISVX) iShares Russell 2000 Value Index (IWN) 6% Vanguard Value Idx (VIVAX) iShares Russell 3000 Value Index (IWW) 6% Vanguard 500 Index (VFINX) SPDR S&P 500 (SPY) 6% Vanguard Emerging Mkt (VEIEX) iSharess Emerging Market Stock (EEM) 6% Vanguard REIT Idx (VGSIX) iShares Dow Jones REIT Index (IYR) 6% The funds cover five asset classes: U.S. Equity, International Equity, Emerging Mkt Equity, U.S. REIT and Fixed Income. They have various style exposures for U.S. stock market (equity), International Stocks and Fixed income.
MyPlanIQ Strategic Asset Allocation (SAA) selects funds with the best risk adjusted returns for each asset class when rebalancing. The following table compares the Strategic Asset Allocation (SAA) moderate portfolios in both index fund and ETF plans as well as the original portfolio (both MyPlanIQ SAA moderate portfolios have 40% allocation in fixed income). We also include the strategic asset allocation moderate portfolio in MyPlanIQ Five Core Asset ETF Plan that consists one fund for each asset class.
As of 7/2/2010
Portfolio 1 Yr Return 3 Yr Return 5 Yr Return Since 12/2000 FundAdvice SAA Moderate Index Funds 17% -1.0% 5.1% 7.4% FundAdvice SAA Moderate ETF 16.7% -2.2% 4.8% 7% FundAdvice Buy and Hold Index Funds 14.5% -2.4% 4.1% 5.7% Five Core SAA Moderate 16.9% -3.4% 3.93% 5.6% From the above table, we can observe:
- Diversification over styles improves return (FundAdvice Buy and Hold vs. Five Core SAA Moderate).
- Style rotation adds 1.3-1.7% returns over buy and hold (SAA Moderate ETF or Index Funds vs. FundAdvice Buy and Hold).
The above observations are consistent across thousands of plans MyPlanIQ maintains. We should also point out that better fund/style selection does not alter the overall portfolio risk allocation, which is a major advantage over an actively managed tactical asset allocation portfolio.
At the moment, for U.S. stocks, MyPlanIQ SAA favors small cap (IWM), small cap value (IWN). For fixed income, it favors Inflation-protected treasury (TIP).
labels:investments,IRA,401K,
Symbols:vti,spy,veu,efa,vwo,eem,iyr,icf,vnq,dbc,gsg,bnd,agg,tlt,lqd,tip,iwb,oef,iwd,iwo,iwm,ijr,iwn,iwp,iwr,ijh,iws,dvy,iwc,efv,iww,iwv,iwz,VFITX,VFISX,VTRIX,VDMIX,VIPSX,NAESX,VISVX,VIVAX,VFINX,VEIEX,VGSIX,
- Understanding and Building Your ETF Portfolio
06/27/2010
- The Mystery Advisers
06/09/2010
- David Swensen's Six Asset Investment Plan
06/09/2010
- Selecting Candidate ETFs for Effective Portfolio Building
06/03/2010

- Apache Design Solutions 401K Report On 12/03/2010
12/03/2010
This report reviews Apache Design Solutions 401K plan. We will discuss the investment choices and present the plan rating by MyPlanIQ. Current economic and market conditions are discussed in the context of the investment portfolios in the plan. We will then show how participants in Apache Design Solutions 401K can achieve reasonable investment results using asset allocation strategies.
Plan Review and Rating
Apache Design Solutions 401K's 401K plan consists of 42 funds. These funds enable participants to gain exposure to 5 major assets: US Equity, Foreign Equity, REITs, Emerging Market Equity, Fixed Income. The list of minor asset classes covered:
Conservative Allocation: AOK
Diversified Emerging Mkts: EEM, GMM, PXH, DEM, SCHE
Foreign Large Blend: EFA, VEU, GWL, PFA
Foreign Small/mid Growth: IFSM, VSS, SCHC
Health: IYH, IXJ, VHT, XBI, PBE, DBR, RYH
Intermediate Government: IEI, VGIT, ITE
Intermediate-term Bond: AGG, CIU, BIV, BND
Large Blend: IVV, IYY, IWV, VTI, VV, SPY, DLN, RSP, SCHX
Large Growth: IVW, IWZ, JKE, VUG, ELG, QQQQ, RPG, SCHG
Large Value: IVE, IWW, JKF, VTV, ELV, PWV, RPV, SCHV
Mid-cap Growth: IJK, IWP, VOT, EMG, PWJ, RFG, UKW
Mid-cap Value: IJJ, IWS, JKI, VOE, EMV, PWP, RFV, UVU
Moderate Allocation: AOM
Natural Resources: IYM, IGE, VAW, XLB, XME, PYZ, DBN, RTM, UYM
Real Estate: IYR, ICF, VNQ
Retirement Income:
Small Blend: IJR, IWM, JKJ, VB, DSC, PJM, DES, SAA, UWM, SCHA
Small Growth: IJT, IWO, JKK, VBK, DSG, PWT, RZG, UKK
Small Value: IJS, IWN, JKL, VBR, DSV, PWY, RZV, UVT
Target Date 2016-2020: TZG
Target Date 2026-2030: TZL
Target Date 2036-2040: TZV
World Stock: IOO, VT
As of Dec 2, 2010, this plan investment choice is rated as based on MyPlanIQ Plan Rating methodology that measures the effectiveness of a plan's available investment funds. It has the following detailed ratings:
Diversification -- Rated as (85%)
Fund Quality -- Rated as (18%)
Portfolio Building -- Rated as (79%)
Overall Rating: (62%)Current Economic and Market Conditions
We have experienced an uncertain 2010: plenty of worries on whether the US economy will climb out of the great recession and recover.
- The Federal Reserve embarked on Quantitative Easing II (QE2) to stimulate the economy.
- The housing market is still at its low but largely stabilized.
- The unemployment rate is stuck at 9%.
Americans continue to face an uncertain future, given (among others) the high unemployment rate, large federal and local government debts and global trade imbalance. With such an economic backdrop, the stock and debt markets are going to be volatile. Despite this, markets have been resilient and appear positioned to rebound.
In this market it is even more critical to properly diversify and respond market changes. MyPlanIQ offers two asset allocation strategies: strategic and tactical asset allocation strategies ( SAA and TAA for participants in Apache Design Solutions 401K).
Strategic Asset Allocation is based on well known modern portfolio theory and its key features include: diversification, proper fund selection and periodically re-balancing.
Tactical Asset Allocation works on a diversified array of assets provided by funds in a plan and adjusts asset mixes based on market conditions such as asset price momentum utilized by TAA.
Portfolio Discussions
The chart and table below show the historical performance of moderate model portfolios employing strategic and tactical asset allocation strategies. For comparison purpose, we also include the moderate model portfolios of a typical 5 asset SIB (Simpler Is Better) plan . This SIB plan has the following candidate index funds and their ETFs equivalent:
US Equity: (SPY or VTI)
Foreign Equity: (EFA or VEU)
Emerging Market Equity: (EEM or VWO)
REITs: (IYR or VNQ or ICF)
Fixed Income: (AGG or BND)
Performance chart (as of Dec 2, 2010)Performance table (as of Dec 2, 2010)
Portfolio Name 1Yr AR 1Yr Sharpe 3Yr AR 3Yr Sharpe 5Yr AR 5Yr Sharpe Apache Design Solutions 401K Tactical Asset Allocation Moderate 15% 100% 8% 64% 11% 81% Apache Design Solutions 401K Strategic Asset Allocation Moderate 16% 155% 4% 22% 8% 44% Five Core Asset Index ETF Funds Tactical Asset Allocation Moderate 9% 59% 7% 57% 14% 94% Five Core Asset Index ETF Funds Strategic Asset Allocation Moderate 12% 95% 4% 14% 8% 35% Currently, asset classes in US Equity (SPY,VTI) and Emerging Market Equity (EEM,VWO) are doing relatively well. These asset classes are available to Apache Design Solutions 401K participants.
To summarize, Apache Design Solutions 401K plan participants can achieve reasonable investment returns by adopting asset allocation strategies that are tailored to their risk profiles.
Symbols: APA , SPY , VTI , EFA , VEU , EEM , VWO , IYR , VNQ , ICF , AGG , BND , AOM , AOK , CIU , BIV , IYH , IXJ , VHT , XBI , PBE , DBR , RYH , IYM , IGE , VAW , XLB , XME , PYZ , DBN , RTM , UYM , GWL , PFA , IVE , IWW , JKF , VTV , ELV , PWV , RPV , SCHV , TZG , TZL , TZV , IVV , IYY , IWV , VV , DLN , RSP , SCHX , IOO , VT , IVW , IWZ , JKE , VUG , ELG , QQQQ , RPG , SCHG , IJJ , IWS , JKI , VOE , EMV , PWP , RFV , UVU , IFSM , VSS , SCHC , IJS , IWN , JKL , VBR , DSV , PWY , RZV , UVT , IJR , IWM , JKJ , VB , DSC , PJM , DES , SAA , UWM , SCHA , GMM , PXH , DEM , SCHE , IEI , VGIT , ITE , IJK , IWP , VOT , EMG , PWJ , RFG , UKW , IJT , IWO , JKK , VBK , DSG , PWT , RZG , UKK
- Allegheny Ludlum Corporation Personal Retirement and 401(k) Savings Account Plan Report On 12/03/2010
12/03/2010
- AMERICAN EXPRESS RETIREMENT SAVINGS PLAN Report On 12/03/2010
12/03/2010
- PEABODY WESTERN-UMWA 401(K) PLAN Report On 12/03/2010
12/03/2010
- Peabody Investments Corp.Employee Retirement Account Report On 12/03/2010
12/03/2010
- Capital Accumulation Plan of The Chubb Corporation Report On 12/03/2010
12/03/2010
- EQT CORPORATION SAVINGS AND PROTECTION PLAN Report On 12/03/2010
12/03/2010
- TD Ameritrade Commission Free ETFs Report On 12/07/2010
12/07/2010
- Sprint Nextel 401K Plan Report On 03/21/2011
03/21/2011
- David Swensen Six ETF Asset Individual Investor Plan Report On 06/02/2011
06/02/2011
- The Goldman Sachs 401(k) Plan Report On 06/03/2011
06/03/2011
- Oracle Corporation 401(k) Savings and Investment Plan Report On 06/13/2011
06/13/2011
- Hewlett Packard 401K Report On 06/13/2011
06/13/2011
- Hewlett Packard 401K Report On 06232011
06/23/2011