Goldman Sachs Tactical Strategy Examined With Fewer ETFs in the Portfolio
12/17/2010 0 comments
Goldman Sachs Global Tactical Asset Allocation portfolios were an early leader in tactical asset allocation strategies. Their strategy is a type of cross-asset (or multi-asset) momentum based tactical asset allocation.
In a previous article we took a simplified interpretation of the strategy and showed how it could be cloned with ETFs.
The simplified strategy is:
On a monthly (or quarterly basis), from six asset classes: US equity, International equity, Emerging Markets, Real Estate, Commodities, US aggregate bond,
-
Calculate the previous 12 month return.
-
Rank the returns among these 6 assets.
-
Choose the top 3 assets and invest in these top 3 assets in equal amounts.
-
Any asset has to score higher than CASH to qualify for the purchase.
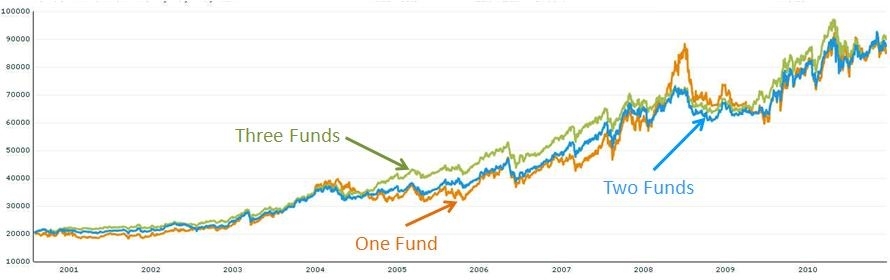
In this development, we examine what would happen if the strategy only picks the best one, or the top two, funds as opposed to always having three.
The funds we used and their ETF counterparts are:
|
Fund |
ETF |
Description |
|
VFINX |
(VTI) |
Total Stock Market |
|
VGTSX |
(EFA) |
International Stock |
|
VEIEX |
(EEM) |
Emerging Markets |
|
VGSIX |
(IYR) |
Real Estate |
|
QRAAX |
(DBC) |
Commodities |
|
VFISX |
(SHY) |
Short Term Bond |
|
VFITX |
(IEI) |
Intermediate Bond |
|
VUSTX |
(TLT) |
Long Term Bond |
|
VFSTX |
(AGG) |
Aggregate Bond |
|
VFICX |
(MBB) |
Intermediate Bond |
|
VWESX |
(LWC) |
Long Term Bond |
|
VWEHX |
(HYG) |
High Yield Bond |
|
VFIIX |
(IEI) |
Intermediate Bond |
|
BEGBX |
(BWX) |
International Treasury Bond |
|
VIPSX |
(TIP) |
Inflation Protected Bond |
click to enlarge
Portfolio Performance Comparison
| Portfolio Name | 1Yr AR | 1Yr Sharpe | 3Yr AR | 3Yr Sharpe | 5Yr AR | 5Yr Sharpe |
|---|---|---|---|---|---|---|
| P Goldman Sachs Global Tactical Small Cap Include Emerging Market Diversified Bonds | 8% | 40% | 11% | 61% | 15% | 81% |
| Goldman Sachs One Fund | 8% | 30% | 13% | 50% | 18% | 71% |
| Goldman Sachs Two Fund | 11% | 52% | 11% | 62% | 17% | 91% |
We can see that each of the strategies exhibit different performance parameters with the two fund strategy appearing to give the best overall performance.
If we add the drawdown ratios:
|
Draw Down |
1 Yr |
3 Yr |
5 Yr |
Inception |
|
Three Fund |
14% |
14% |
18% |
18% |
|
Two Fund |
14% |
17% |
18% |
18% |
|
One Fund |
17% |
33% |
33% |
33% |
We can see that the additional funds reduce the drawdowns - there is a large jump going from two funds to three funds.
Consideration of the number of funds to select will have an impact on the behavior of the portfolio.
In this case, the two fund portfolio appears to inherit the best properties, whereas the one fund portfolio can give good returns, but at some cost to ulcers.
It may be worth considering moving to two funds in some cases.
labels:investment,
Symbols:AGG,BWX,DBC,EEM,EFA,HYG,IEI,IYR,LWC,MBB,SHY,TIP,TLT,VTI,
comments 0
Or Start FREE 30-day trial now >>
