
The Most Reliable Retirement Savings: Why $1.8 Million is a Popular Lie
In this issue:
- Latest in Retirement Savings & Personal Finance: Retirement Savings Still Fall Short, Sluggish Home Sales & The Most Overvalued Stock Market
- The Most Reliable Retirement Savings Needed: Why $1.8 Million is a Popular Lie
- Tools & Tips: Retirement Spending Calculator Based on a Portfolio, Fund, or Stock
- Market Overview
Latest in Retirement Savings & Personal Finance: Retirement Savings Still Fall Short, Sluggish Home Sales & The Most Overvalued Stock Market
Retirement Savings Still Fall Short
Latest reports indicate that median savings for Americans near retirement still fall short. Based on CNBC, the median retirement savings for people of 65 years old or those near retirement is about $200,000, which is a far cry from the $1.8 million people expect to save for retirement. The number is also short of our most reasonable retirement savings number $600,000 for an America of median income at age 65. See our detailed discussion in the next section.
Sluggish Home Sales
With mortgage interest rate still being high, we are seeing a sluggish real estate market:
- Sales Trend: In June 2025, existing home sales dropped to a sub-4 million annual pace, a 2.7% decline from May and the slowest May in 16 years,
- Price Trend: The median existing home price reached a record $435,300 in June 2025, up from June 2024, but annual price growth slowed to 1.3% from 1.6% in May, with one-third of the top 100 markets seeing at least 1% price declines.
- Mortgage Rate Trend: As of late July 2025, 30-year fixed-rate mortgages averaged 6.74%–6.76% and 15-year rates 5.86%–5.92%, remaining stable between 6.5%–7% with forecasts suggesting a slight drop to 6.4%–6.7% by year-end if inflation eases, though a fall below 6% is unlikely.
The Most Overvalued Stock Market
US stock markets have non-stop reached all-time highs in the past several weeks. However, it would be a good time to remind everyone that as stock prices rise, they become more expensive (naturally). But the following chart shows actually the US stock is way more expensive than any time in history, even a lot more than the peak before the Great Depression in 1929.
The following chart is from Advisor Perspective:

To quote from the article:
At the time, the peak in 2000 marked an unprecedented 107% overshooting of the trend — substantially above the overshoot in 1929 (77%) and in 1901 (93%). In recent years, the index got as high as 165% (2021) and 183% (2024) above the trend.From this chart, we can see that the index has been above trend for nearly three decades, with one exception. From October 2008 to August 2009 the index dropped as low as 29% below trend. The major troughs of the past saw declines in excess of 50% below the trend. If the current S&P 500 were sitting squarely on the regression, its value would be 2210.
So just beware that this would be a 65% haircut, or 2/3 of the current value!
The Most Reliable Retirement Savings Needed: Why $1.8 Million is a Popular Lie
You’ve probably come across those big retirement numbers that show up in media or surveys. Most of them sound a lot higher than what many people can actually save. Here are some popular ones:
- $1.8 million — Schwab 401(k) Participant Study (2024)
This one shows up a lot. According to Schwab’s annual study, most 401(k) participants believe they’ll need around $1.8 million to retire comfortably. That number has crept up over time. It was $1.7 million back in 2022. It’s become the most quoted figure, even though very few people actually get close to it. - $1.46 million — Northwestern Mutual Planning & Progress Survey (2024)
This one came out the same year but from a different group. Northwestern Mutual’s 2024 survey said the average “magic number” people expect to need in retirement is $1.46 million. It’s a bit lower than Schwab’s, but still far beyond what most people are realistically working with. - $1.26 million — Northwestern Mutual Planning & Progress Survey (2025)
In the following year’s survey, the number came down a bit. People started adjusting expectations. The 2025 version of the same survey showed the average dropped to $1.26 million. So even though the big number thinking is still there, it seems like there’s at least some recognition that those earlier expectations might have been too much.
The article The Most Reliable Retirement Savings Amount You Need in 2025 walks through a way to show how an American with median income actually needs far less than the above headline numbers to retire at approximately the same quality life before retirement. Here are the main points:
According to BLS data summarized by SmartAsset, full‑time workers aged 65+ earn a median of roughly $60,268 per year. Financial planners generally advise replacing 75%–85% of pre‑retirement income; Schwab specifically recommends about 80%. That puts your retirement income target at about $48,000 annually.
Meanwhile, the average newly retired worker collects about $2,000 per month in Social Security, or $24,000 per year, as of 2025. That equates to Social Security covering nearly half your income goal, leaving a gap of $24,000 per year. Under the 4% safe withdrawal rule, you’d need only $24,000 * 25 = $600,000 (as 100%/4%=25) in savings to generate that supplemental income. This is far less than the headline figures!
Why $600K Can Be Enough
That’s not to say larger balances are useless. But if you can invest $600K conservatively and consistently earn about 4% after inflation, that portfolio should support a stable $24,000 annual withdrawal. It could last decade, and you can still manage to leave something over at the end. This amount also reduces pressure to chase high‑risk strategies during market fluctuations. In comparison, obsessing over a $1.8 million goal may mislead you into delaying retirement unnecessarily or taking undue risks.
Why Realistic Targets Matter — Both Psychologically and Economically
Setting an overly ambitious savings target like $1.8 million can create anxiety, discouragement, or inaction. Many people in their 50s or 60s with $300K–$400K saved may feel they’ve already failed, even if they are on track for a comfortable retirement based on income replacement. That psychological burden can erode confidence and planning energy.
Economically, inflating your savings goal can steer you toward riskier investments or unnecessary financial austerity in your productive years. By contrast, a realistic target tied to your actual needs lets you invest steadily, spend reasonably now, and retire with clarity. It also makes you to focus on your investment portfolio risk, something you can manage with tools like MyPlanIQ’s Fixed‑Income and Tactical Portfolios, which aim for low‑volatility, inflation‑beating performance for retirement savings.
Tools & Tips: Retirement Spending Calculator Based on a Portfolio, Fund, or Stock
The Retirement Spending Calculator Based on a Portfolio, Fund, or Stock helps you figure out how long your retirement savings could have lasted by looking at historical investment returns. You just enter a starting amount, choose the time period, pick your withdrawal rate, and select an investment option (like a portfolio, fund, or stock).
For example, in the following, you can pick your investment as VFINX (Vanguard S&P 500 index fund) and use the past 20 year’s history (i.e. from 2005 to 2025) to see how the 4% (or any other number) annual withdrawal rate could have worked for the past 20 years on your S&P 500 fund (VFINX) investment. Note, you can select a portfolio or enter any fund or stock symbol in the “Investment Portfolio or Fund” parameter for other types of investments or portfolios investigation.
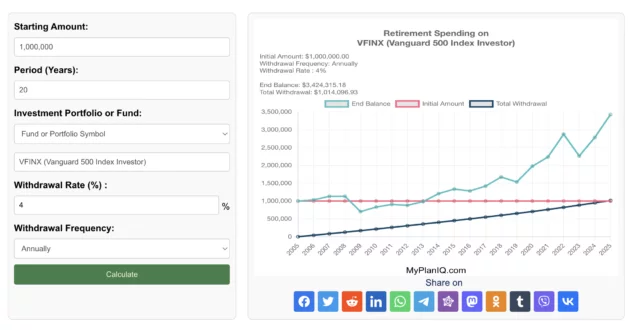
So, this is a very good news: starting in $1m in 2005, you ended up $3.4m today after withdrawing (spending) $1m!
But on the other hand, if you would have retired in 2000, an internet bubble (or technology bubble) high, things change drastically:
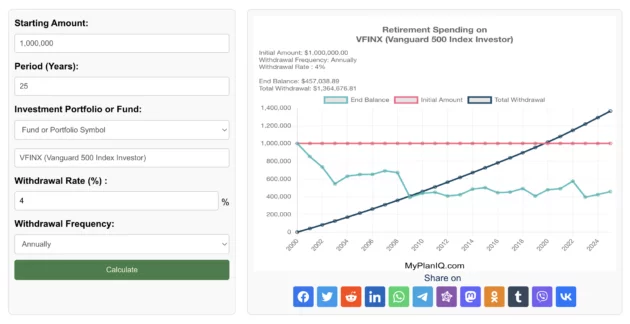
You would end up a much smaller account: only $457K left after spending $1.36m (in 25 years)! So now your account value is much depleted from the original $1m.
We encourage you to play with it using various funds, portfolios and periods and even different withdrawal rates! It will help you understand why it’s important to manage investments conservatively. Furthermore, it will give you a far much better expectation on retirement savings and spending.
Market Overview
Well, our first sentence ‘Stocks continued to ascend, breaking historical highs again last week’ hasn’t changed for several weeks now. With earnings underway and the tariff negotiation near its end, investors perceive a relatively calm and good time ahead.
The following table shows the major asset price returns and their trend scores, as of last Friday:
| Asset Class | 1 Weeks | 4 Weeks | 13 Weeks | 26 Weeks | 52 Weeks | Trend Score |
|---|---|---|---|---|---|---|
| US Stocks | 1.3% | 3.0% | 15.9% | 6.9% | 18.4% | 9.1% |
| Foreign Stocks | 0.2% | 0.8% | 10.0% | 15.8% | 17.9% | 8.9% |
| US REITs | 0.0% | 1.3% | 4.0% | 0.1% | 4.0% | 1.9% |
| Emerging Market Stocks | -0.3% | 2.4% | 12.6% | 15.5% | 18.6% | 9.8% |
| Bonds | -0.1% | -0.8% | 0.5% | 2.7% | 3.7% | 1.2% |
More detailed returns and trend scores can be found on MyPlanIQ.com Market Overview.
Try to Find Your Old Retirement Accounts?
Find Tools and Calculators That Provide Quick Help