
How Much Should I Save for Retirement By Age? A Realistic Reference
In this issue:
- Latest in Retirement Savings & Personal Finance: Medicare Rude Surprise, Scoop to Be a Millionaire
- How Much Should I Save for Retirement By Age? A Realistic Reference
- Tools & Tips: Retirement Savings by Age Calculator
- Market Overview
Latest in Retirement Savings & Personal Finance: Medicare Rude Surprise, Scoop to Be a Millionaire
Medicare drug plans may disappoint — especially if you’re used to good employer coverage
Something worth paying attention to, especially if you’re about to retire and switch from your company insurance to Medicare: your drug coverage might not be as good as you think. A recent study says the average Medicare plan excludes 44% of medications. For most employer plans, it’s only 21%. And even when Medicare does cover something, nearly half the time there are hurdles including prior authorization, step therapy, that sort of thing. These restrictions don’t just sound annoying. They often mean delays or outright denials.
It’s not that Medicare drug coverage is useless. But if you’re part of that 11,000-a-day crowd turning 65, you might want to budget more time and probably more money than you expected for figuring this out. Drug coverage under Medicare Advantage can be cheaper on paper, but both versions (Part D and Advantage) are full of fine print. Especially around access. It’s frustrating, but the best you can do is get organized ahead of time. Know your meds. Check the plan’s rules, not just the list.
Some more numbers: a 65-year-old on traditional Medicare is looking at around $24,000 in drug plan premiums over retirement, plus another $43,000 or so in out-of-pocket costs for prescriptions, based on estimates from HealthView Services. Medicare Advantage skips the monthly drug premium part, but you’re still likely to end up paying just as much out-of-pocket over time.
Scoop to Be a Millionaire in an Employee Stock Ownership Plan (ESOP)
More than 175 employees at Stewart’s Shops, the gas station and ice cream chain in the Northeast, have quietly become millionaires. Not from flashy startups or lucky breaks, just from working there long enough. The company offers something called an ESOP, a stock ownership plan for employees. If you work 500 hours in a quarter or 1000 in a year, you qualify. You become a “Partner” and start building equity in the business. No paycheck deductions. The company funds it entirely.
As the business has grown over the years, so has the value of the shares. Dividend payouts and contributions kept compounding. By 2023, over 175 employees had ESOP accounts worth more than $1 million. Many of them started as hourly workers. It’s not the kind of story that makes headlines every day, but it probably should. Ownership, patience, and just showing up — that combination can still change lives.
ESOPs like this can also be offered inside a company’s retirement plan, usually alongside or instead of a 401(k). In those setups, company stock is one of the investment options, or sometimes the main one. It’s not always ideal depending on the company, but when it works, it really works.
This is a perfect example of ‘good’ capitalism and shared prosperity!
How Much Should I Save for Retirement By Age? A Realistic Reference
How much should I have saved for retirement by age? To get a realistic figure for your age, we have developed a Retirement Savings by Age Calculator that uses realistic historical year-by-year stock and bond return data, and year-by-year median income levels in the U.S., to derive some realistic reference data on accumulated savings for various income tiers and different age groups. Here is the table of Realistic Retirement Savings by Age in 2025:
Accumulated Retirement Savings by Age in 2025
| Age | Low Income Savings | Middle Income Savings | Lower Upper Savings | Mid Upper Savings |
|---|---|---|---|---|
| 22 | 4,692 | 9,383 | 14,075 | 18,766 |
| 23 | 10,205 | 20,410 | 30,615 | 40,821 |
| 24 | 14,415 | 28,829 | 43,244 | 57,659 |
| 25 | 19,033 | 38,067 | 57,100 | 76,134 |
| 30 | 47,993 | 95,986 | 143,979 | 191,972 |
| 35 | 85,379 | 170,758 | 256,137 | 341,516 |
| 40 | 138,001 | 276,003 | 414,004 | 552,005 |
| 45 | 201,028 | 402,057 | 603,085 | 804,113 |
| 50 | 280,784 | 561,568 | 842,352 | 1,123,136 |
| 55 | 414,759 | 829,518 | 1,244,276 | 1,659,035 |
| 56 | 447,640 | 895,280 | 1,342,920 | 1,790,560 |
| 57 | 487,279 | 974,557 | 1,461,836 | 1,949,114 |
| 58 | 529,766 | 1,059,532 | 1,589,297 | 2,119,063 |
| 59 | 570,608 | 1,141,217 | 1,711,825 | 2,282,433 |
| 60 | 617,874 | 1,235,749 | 1,853,623 | 2,471,497 |
| 61 | 676,347 | 1,352,693 | 2,029,040 | 2,705,386 |
| 62 | 736,880 | 1,473,760 | 2,210,639 | 2,947,519 |
| 63 | 800,892 | 1,601,783 | 2,402,675 | 3,203,567 |
| 64 | 880,896 | 1,761,791 | 2,642,687 | 3,523,583 |
| 65 | 958,342 | 1,916,685 | 2,875,027 | 3,833,369 |
| 70 | 1,293,402 | 2,586,803 | 3,880,205 | 5,173,606 |
The above assumes that you start your savings at age 22 and you save 10% annually and your investments are in 60% in a US index stock fund and 40% in a US bond index fund.
Some observations:
- It’s very doable to be a 401(k) or retirement saving millionaire at age 60: this is true for middle income, lower upper and middle upper income tier people. Even if you are at low income tier, you could have accumulated $600K plus!
- at age 35, mid upper income tier savers could have accumulated half a million. This is confirmed by various reports that people became 401(k) millionaires at such a young age.
For more detailed calculation and the explanations on how it arrives at the above figures, you can visit the Retirement Savings by Age Calculator and enter different parameters. For example, if you started your savings at a later age, you can enter it in the input parameter. Also see this.
Tools & Tips: Retirement Savings by Age Calculator
The Retirement Savings by Age Calculator is the most realistic Retirement Savings Estimator by Age based on historical annual income levels in the U.S. and the historical stocks and bonds returns.
It derives average retirement savings (such as 401(k), 403(b), IRA etc.) based on historical market performance and income levels. By inputting a current age, the age one started saving, the stock allocation, and savings rate, the calculator calculates accumulated savings across different income tiers (low, middle, lower-upper, and mid-upper) from 1977 to 2025. Using credible historical data from NYU Stern for stock and bond returns and authoritative sources for U.S. income levels from U.S. Census Bureau, it provides a realistic view of how the average savings could grow over time, factoring in annual portfolio returns and consistent savings contributions.
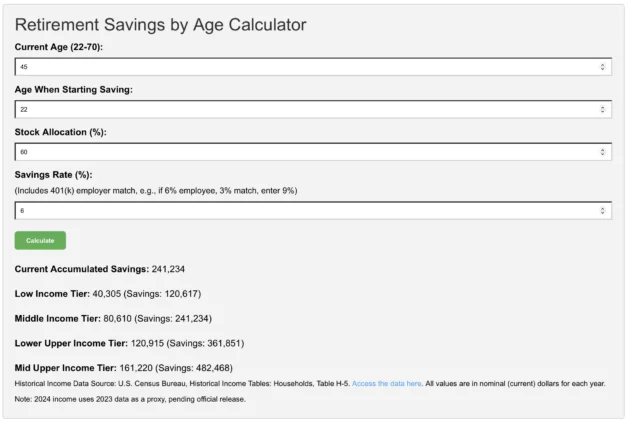
The above output includes the Income Tier’s income level and the accumulated savings. In the above calculation, the annual savings rate is 6%. You can see for a middle income earner, the accumulated savings $241,234 is much less than $400,057 when annual savings rate is set to be 10% (the above table).
So Save More & Grow Wise!
Market Overview
Based on FactSet, as we approach the end of the first quarter earnings reporting period, with 90% of S&P 500 companies having announced their results, year-over-year earnings growth stands at 13.4%. This figure is significantly higher than the 7.1% growth that was expected at the start of the quarter on March 31, 2025. However, investors seem to be holding back ahead of the trade tariff negotiation results, which caused stock prices to fluctuate last week.
As of this writing, the U.S. and China made a tentative deal that makes substantial reductions to tariffs from both sides for 90 days. Stock prices surged. We’ll see whether it can sustain or not.
The following table shows the major asset price returns and their trend scores, as of last Friday:
| Asset Class | 1 Weeks | 4 Weeks | 13 Weeks | 26 Weeks | 52 Weeks | Trend Score |
|---|---|---|---|---|---|---|
| US Stocks | -0.4% | 5.6% | -5.7% | -5.0% | 9.7% | 0.9% |
| Foreign Stocks | -0.5% | 8.0% | 5.2% | 3.9% | 7.1% | 4.7% |
| US REITs | -1.4% | 5.8% | -3.3% | -7.7% | 9.0% | 0.5% |
| Emerging Market Stocks | -0.3% | 7.8% | 2.5% | -2.1% | 6.4% | 2.8% |
| Bonds | -0.3% | 0.7% | 0.2% | -0.5% | 3.6% | 0.7% |
More detailed returns and trend scores can be found on MyPlanIQ.com Market Overview.
Struggle to Find Your Old Retirement Accounts?
Find Tools and Calculators That Provide Quick Help