
Annuity Income Payout vs. Invest & Withdraw
In this issue:
- Latest in Retirement Savings & Personal Finance: Annuity Is Back, HSA & Retirement Healthcare Improvement, Growing Medical Debt Crisis
- Tools & Tips: Annuity vs Invest Calculator
- Annuity Income Payout vs. Invest & Withdraw
- Market Overview
Latest in Retirement Savings & Personal Finance: Annuity Is Back, HSA & Retirement Healthcare Improvement, Growing Medical Debt Crisis
Annuities Make a Comeback
In today’s higher–interest‐rate environment, immediate and deferred annuities are once again providing compelling, guaranteed income options that retirees—and pre-retirees—can lock in. Whereas yields on fixed-rate products were scarcely enough to keep pace with inflation just a few years ago, current rates on single-premium immediate annuities (SPIAs) often exceed 6–7% annual payout. This means a $1 million investment can generate roughly $60 000–$70 000 of secure annual income, indexed to your lifetime or a joint-survivor period.
Yet, despite these attractive yields and the reassurance of predictable cash flows, annuity take-up remains surprisingly low. Many savers remain wary of surrender charges, lack of liquidity, or the perception that products are too complex. To bridge that gap, some plan designers and experts now recommend automatically allocating a portion of participants’ 401(k) balances—say, 10–20%—into a deferred annuity at or near retirement age. This “default” approach combines the upside of a self-managed investment portfolio with a core “floor” of guaranteed lifetime income, helping ensure retirees won’t outlive their nest egg even if markets turn volatile.
See more discussions below.
HSA & Retirement Healthcare Improvement
Proposed changes in the 2025 federal budget reconciliation (e.g., House “One Big Beautiful Bill”) and Senate tax proposals would transform HSAs into a more potent retirement-healthcare tool:
- Medicare Part A eligibility relaxed: Once enrolled in Medicare Part A (typically at age 65), individuals currently lose HSA contribution ability. The new legislation would allow continued HSA contributions post–Medicare Part A enrollment—although withdrawals for insurance premiums remain disallowed.
- Contribution limits doubled: Individual limits could rise by about $4,300 (to approx. $8,600), and family limits by about $8,550. Eligibility expansion includes people with onsite clinics or direct primary care (DPC) memberships and allows spousal catch-up contributions into the same HSA account.
- Broader qualified expenses: Funds could cover certain fitness-related costs (up to $1,000/year for families) and reimburse eligible expenses incurred up to 60 days before account setup. These enhancements are aimed at using HSAs not just for medical emergencies but as long-term healthcare nest eggs for retirement.
Growing Medical Debt Crisis
The medical debt situation in the U.S. remains grave:
- Massive scale of debt: Surveys estimate at least 20 million adults hold “significant” debt (over $250), with total unpaid medical debt around $220 billion, which doesn;t includeapproximately $88 billion in medical debt currently in collections.
- Widespread household impact: Roughly 41% of adults report owing some form of medical debt (including on credit cards or borrowed from family). Approximately 14 million Americans owe over $1,000, and about 3 million carry debts exceeding $10,000.
- Life-altering consequences: Medical debt forces people to:
- Cut back on necessities like food and heating,
- Spend down savings or retirement funds,
- Borrow from family or take on loans/credit card debt,
- Delay or skip medical care due to financial constraints,
- Face aggressive collection practices that impact credit scores, wages, or even result in bankruptcy.
Tools & Tips: Annuity vs. Invest Calculator
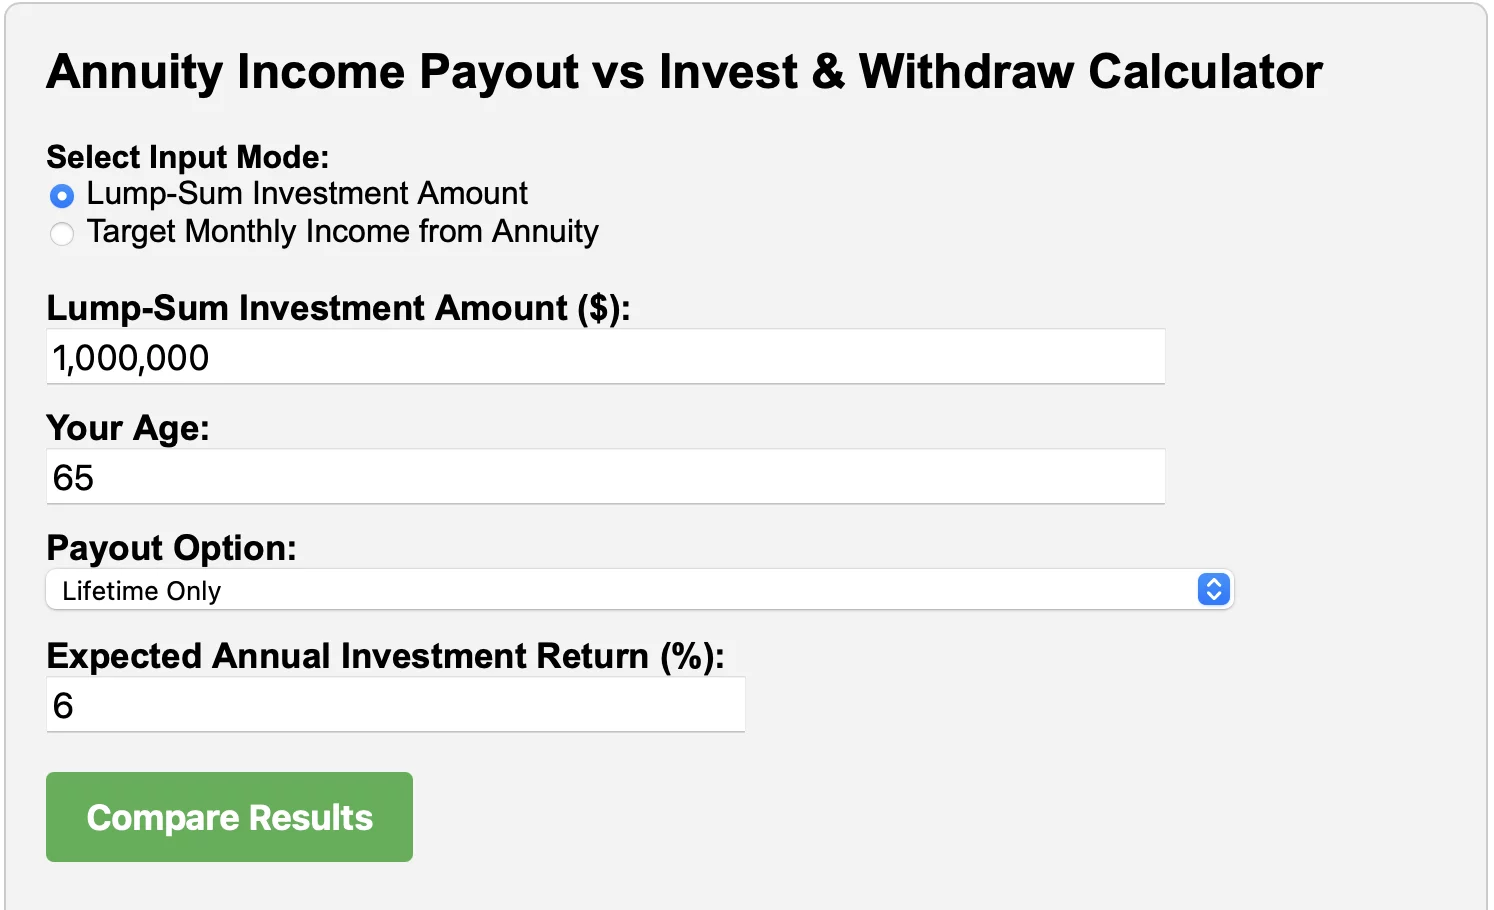
We switch our order here to first show our latest Annuity Income Payout vs Invest & Withdraw Calculator. This calculator allows you to compare two retirement income strategies: buying a guaranteed annuity vs. investing your lump-sum and withdrawing income over time. By modeling both options side-by-side, you can evaluate which approach may provide greater longevity and flexibility for your retirement savings.
And the results:
Here you input your annuity option: either ra lump-sum or a target monthly income. You then enter your age and chooses the payout option such as lifetime only, joint life etc. You then set your investment expected annual return.
The calculator will output the results that compare with the guaranteed income from the annuity, how many years you would be able to sustain the same withdrawal or income in your investments.
Similarly, if you choose the targeted monthly income for your annuity, the calculator will use the annuity required initial amount (to generate the targeted monthly income) as initial investment and procceeds to calculate the years when the investment approach can sustain the same targeted monthly income.
Annuity Income Payout vs. Invest & Withdraw
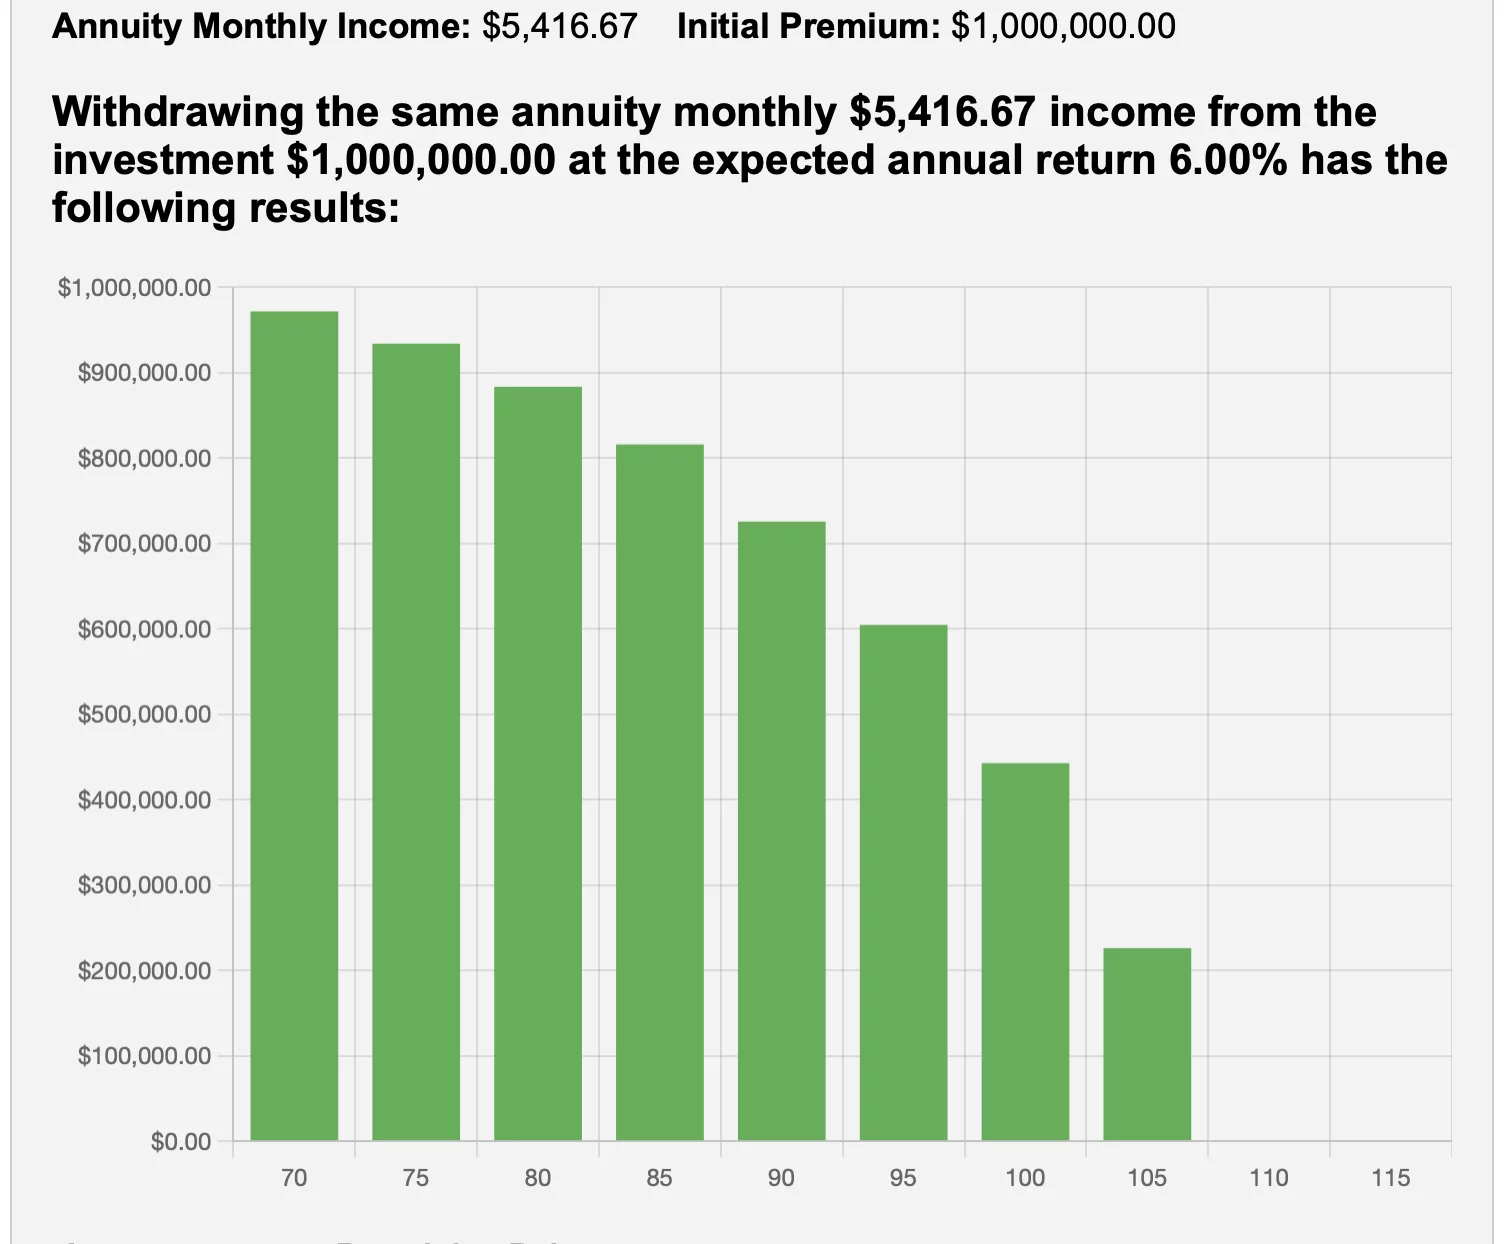
The calculator results above show something interesting. With a $1,000,000 lump sum and a 6% expected investment return, you could buy a lifetime annuity that pays about $5,416 per month. Or, you could try to self-manage and withdraw the same income amount each year from your own investment account.
From the above, the invest & withdraw approach would’ve depleted your portfolio. It runs out completely at around age 110. Let’s take a bit more detailed look:
1. Reliability vs Flexibility
The main difference isn’t really about return. It’s about certainty or reliability.
- Annuity gives you a guaranteed monthly income for life. It doesn’t matter how long you live or what the markets do. You won’t run out.
- With a self-managed portfolio, nothing is guaranteed. Sure, the expected return is 6% in this simulation, and that’s not unreasonable for a balanced long-term portfolio. But in real life, markets are volatile, and return isn’t linear. If early years underperform or you live longer than expected, there’s a chance you outlive the portfolio.
Flexibility:
- In the investment case, if you pass away at 90 or 95, you’d still have hundreds of thousands left in the portfolio. That money stays with you or goes to your heirs. It doesn’t disappear.
- In the annuity option, you wouldn’t be able to leave anything to your heirs if you die at any time. The guarantee certainly comes with a price.
2. How Much Can You Safely Spend?
Here’s another angle. The annuity is paying out over 6% of your original capital each year. That’s generous. It’s more than what’s generally considered sustainable from a long-term portfolio.
If instead you drew just 4%, you’d only be taking $3,333 per month. Not quite as exciting. But that amount could last decades longer. Possibly forever. The portfolio would likely survive into your 100s, even under mild market stress. And still leave something for heirs.
To be precise, we can pull up our Retirement Calculator and enter the numbers and here is the result:
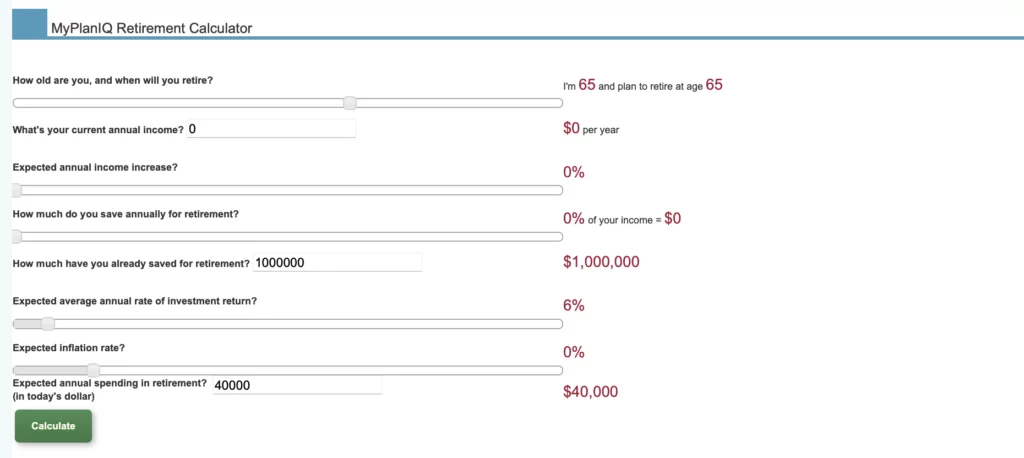
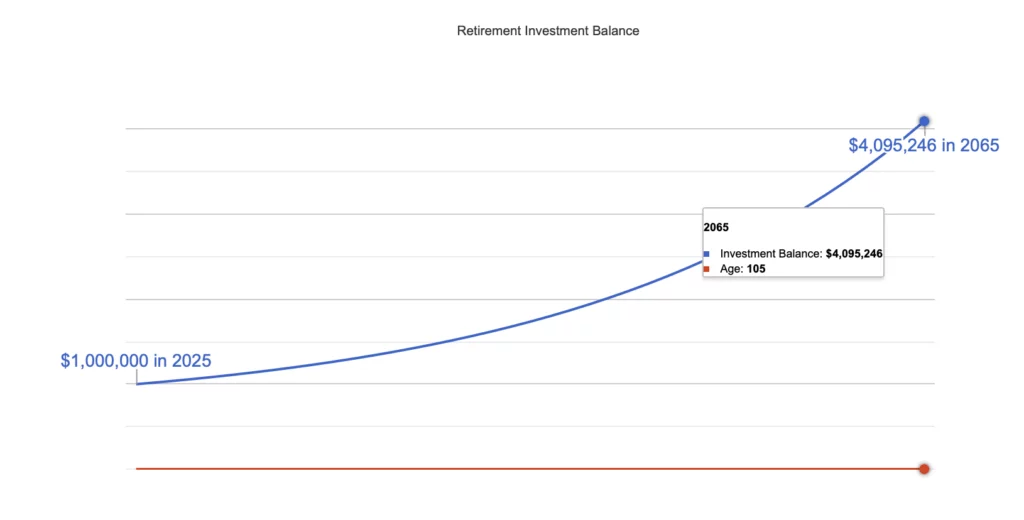
So, spending $40,000 or $3,3333 a month on a $1,000,000 investment portfolio with 6% annual return would actually get you $4 million left when you are 105 years old!
3. What If You Combine Both?
Here comes the hybrid approach to get some good from each strategy. In reality, you could allocate some to annuity to generate a floored, guaranteed income while investing the rest for growth. Of course, if you really don’t want an annuity, you could just allocate that portion to a good fixed income investment portfolio that, hopefully, will generate good enough and more stable returns.
Summary
Longevity risk is real. And often overlooked. It’s good to understand both annuity and investment approaches and make a solid retirement income plan. It has many pieces, including Social Security, pensions (if any), retirement savings (401(k), IRAs), and other investments. Annuity is just another option one should at least take a look at.
See more detailed discussions here.
Market Overview
Financial markets were surprisingly sanguine amid the Israel and Iran conflict. Later on Saturday, the US entered the conflict by bombing some Iranian facilities. The U.S. Federal Reserve, Bank of England, and Bank of Japan all held interest rates steady.
The following table shows the major asset price returns and their trend scores, as of last Friday:
| Asset Class | 1 Weeks | 4 Weeks | 13 Weeks | 26 Weeks | 52 Weeks | Trend Score |
|---|---|---|---|---|---|---|
| US Stocks | -0.1% | 3.9% | 4.8% | 1.5% | 11.9% | 4.4% |
| Foreign Stocks | -1.9% | 0.4% | 5.5% | 13.5% | 13.6% | 6.2% |
| US REITs | 1.4% | 4.6% | 0.4% | 3.6% | 12.0% | 4.4% |
| Emerging Market Stocks | -1.9% | 0.0% | 3.5% | 6.8% | 11.3% | 3.9% |
| Bonds | 0.6% | 1.6% | 1.1% | 3.4% | 4.4% | 2.2% |
More detailed returns and trend scores can be found on MyPlanIQ.com Market Overview.
Try to Find Your Old Retirement Accounts?
Find Tools and Calculators That Provide Quick Help