 |
Vanguard ETF: |  |
7.4%* |
|
Diversified Core: | |
8.1%* |
|
Six Core Asset ETFs: | |
7.3%* |
Articles on PID
- American Express Provides Above Average Investment Choices in Its 401K Plan
12/06/2010
This report reviews AMERICAN EXPRESS RETIREMENT SAVINGS PLAN. We will discuss the investment choices and present the plan rating by MyPlanIQ. Current economic and market conditions are discussed in the context of the investment portfolios in the plan. We will then show how participants in AMERICAN EXPRESS RETIREMENT SAVINGS PLAN can achieve reasonable investment results using asset allocation strategies.
Plan Review and Rating
American Express Company provides charge and credit payment card products, and travel-related services worldwide. It offers a range of products and services, including charge and credit card products; expense management products and services; consumer and business travel services; stored value products, such as Travelers Cheques and prepaid products; network services; merchant acquisition, and merchant processing, point-of-sale, servicing and settlement, and marketing products and services for merchants; and fee services, including market and trend analyses along with related consulting services and customer loyalty and rewards programs. American Express was founded in 1850 and is headquartered in New York, New York.
AMERICAN EXPRESS RETIREMENT SAVINGS PLAN consists of 24 funds. These funds enable participants to gain exposure to 4 major assets: US Equity, Foreign Equity, Emerging Market Equity, Fixed Income. The list of minor asset classes covered:
Diversified Emerging Mkts: EEM, GMM, PXH, DEM, SCHE
Foreign Large Blend: EFA, VEU, GWL, PFA
Foreign Large Value: EFV, PID, DWM
Foreign Small/mid Value: SCZ
Intermediate-term Bond: AGG, CIU, BIV, BND
Large Blend: IVV, IYY, IWV, VTI, VV, SPY, DLN, RSP, SCHX
Long-term Bond: CLY, LQD, BLV, VCLT
Mid-cap Blend: IJH, IWR, JKG, VO, MDY, EMM, PJG, DON, EZM, MVV
Small Blend: IJR, IWM, JKJ, VB, DSC, PJM, DES, SAA, UWM, SCHA
Us Equity: IVV, IYY, IWV, VTI, VV, SPY, DLN, RSP, SCHXAs of Dec 2, 2010, this plan investment choice is rated as Above Average based on MyPlanIQ Plan Rating methodology that measures the effectiveness of a plan's available investment funds. It has the following detailed ratings:
Diversification -- Rated as Average (61%)
Fund Quality -- Rated as Average (60%)
Portfolio Building -- Rated as Good (96%)
Overall Rating: Above Average (75%)Current Economic and Market Conditions
We have experienced an uncertain 2010: plenty of worries on whether the US economy will climb out of the great recession and recover.
- The Federal Reserve embarked on Quantitative Easing II (QE2) to stimulate the economy.
- The housing market is still at its low but largely stabilized.
- The unemployment rate is stuck at 9%.
Americans continue to face an uncertain future, given (among others) the high unemployment rate, large federal and local government debts and global trade imbalance. With such an economic backdrop, the stock and debt markets are going to be volatile. Despite this, markets have been resilient and appear positioned to rebound.
In this market it is even more critical to properly diversify and respond market changes. MyPlanIQ offers two asset allocation strategies: strategic and tactical asset allocation strategies ( SAA and TAA for participants in AMERICAN EXPRESS RETIREMENT SAVINGS PLAN).
Strategic Asset Allocation is based on well known modern portfolio theory and its key features include: diversification, proper fund selection and periodically re-balancing.
Tactical Asset Allocation works on a diversified array of assets provided by funds in a plan and adjusts asset mixes based on market conditions such as asset price momentum utilized by TAA.
Portfolio Discussions
The chart and table below show the historical performance of moderate model portfolios employing strategic and tactical asset allocation strategies. For comparison purpose, we also include the moderate model portfolios of a typical 4 asset SIB (Simpler Is Better) plan . This SIB plan has the following candidate index funds and their ETFs equivalent:
US Equity: (SPY or VTI)
Foreign Equity: (EFA or VEU)
Emerging Market Equity: (EEM or VWO)
Fixed Income: (AGG or BND)
Performance chart (as of Dec 2, 2010)Performance table (as of Dec 2, 2010)
Portfolio Name 1Yr AR 1Yr Sharpe 3Yr AR 3Yr Sharpe 5Yr AR 5Yr Sharpe AMERICAN EXPRESS RETIREMENT SAVINGS PLAN Tactical Asset Allocation Moderate 5% 50% 10% 100% 14% 124% AMERICAN EXPRESS RETIREMENT SAVINGS PLAN Strategic Asset Allocation Moderate 13% 108% 3% 16% 9% 49% Four Core Asset ETF Index Funds Emerging Markets Tactical Asset Allocation Moderate 1% 6% 6% 49% 12% 78% Four Core Asset ETF Index Funds Emerging Markets Strategic Asset Allocation Moderate 10% 75% 2% 6% 7% 31% Currently, asset classes in US Equity (SPY,VTI), Foreign Equity (EFA,VEU), Emerging Market Equity (EEM,VWO) and Fixed Income (AGG,BND) are doing relatively well. These asset classes are available to AMERICAN EXPRESS RETIREMENT SAVINGS PLAN participants.
To summarize, AMERICAN EXPRESS RETIREMENT SAVINGS PLAN plan participants can achieve reasonable investment returns by adopting asset allocation strategies that are tailored to their risk profiles.
labels:investment,
Symbols:AXP,SPY,VTI,EFA,VEU,EEM,VWO,AGG,BND,IVV,IYY,IWV,VV,DLN,RSP,SCHX,CIU,BIV,GWL,PFA,SCZ,EFV,PID,DWM,IJH,IWR,JKG,VO,MDY,EMM,PJG,DON,EZM,MVV,IJR,IWM,JKJ,VB,DSC,PJM,DES,SAA,UWM,SCHA,GMM,PXH,DEM,SCHE,CLY,LQD,BLV,VCLT, ,
- ETF's for Income Nov 29
11/29/2010
ETFs for high dividend stocks can be used to represent their corresponding equity classes in asset allocation. Monitoring these ETF's give insight into the funds for a high performance portfolio that provides income as well as growth. The fixed income (bond) trend is covered in a separate weekly report.
More details are available on the MyPlanIQ website.
Description
Symbol
Nov 22 Trend Score
Direction
Nov 15 Trend Score
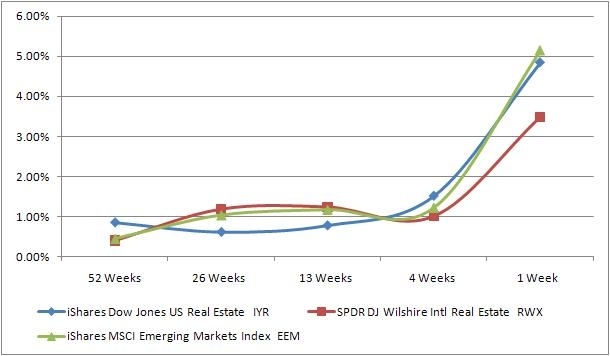
iShares MSCI Emerging Markets Index
EEM
11%
^
8%
SPDR DJ Wilshire Intl Real Estate
RWX
10%
^
8%
PowerShares Intl Dividend Achievers
PID
10%
^
7%
iShares Dow Jones Intl Select Div Idx
IDV
10%
^
6%
iShares S&P U.S. Preferred Stock Index
PFF
8%
^
7%
iShares MSCI EAFE Index
EFA
8%
^
6%
iShares Dow Jones US Real Estate
IYR
8%
v
8%
PowerShares HighYield Dividend Achievers
PEY
8%
^
6%
SPDR S&P 500
SPY
7%
^
6%
SPDR S&P Dividend
SDY
7%
^
6%
iShares Dow Jones Select Dividend Index
DVY
7%
^
5%
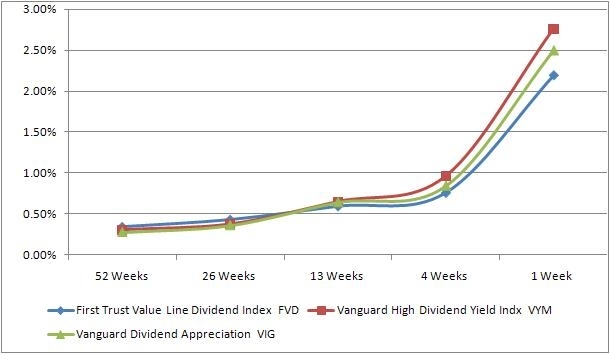
Vanguard Dividend Appreciation
VIG
7%
^
5%
Vanguard High Dividend Yield Indx
VYM
7%
^
5%
First Trust Value Line Dividend Index
FVD
6%
^
5%
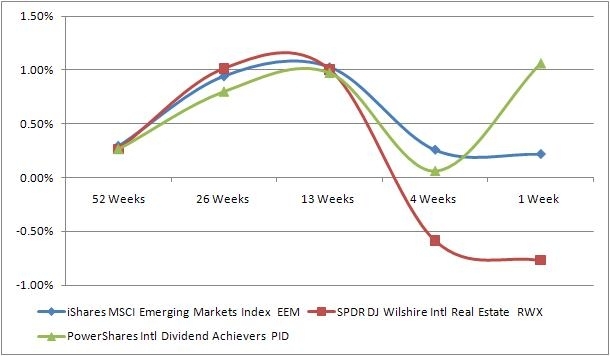
All of these ETFs trade within a relatively tight band -- this hints at a lower portfolio volatility which is good.
Top Three
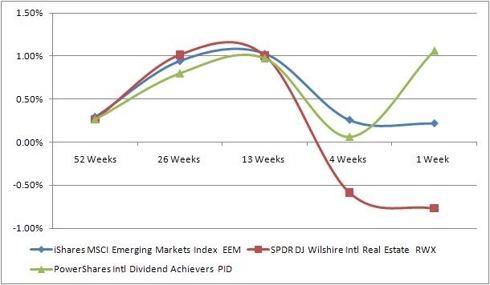
The top three ETFs remain the same. Emerging markets spring back well as would be expected from the asset class indicators. Real estate has levelled off but should be watched as it might drop out of the top three next week. International stocks seem to be doing better than the asset class indicators would suggest and it will be interesting to see whether their upward trend continue next week.
Bottom Three
Even in the bottom three, there is a mildly positive overall trend -- however, other asset classes are performing better.
The nature of dividend bearing assets remove some volatility and give short term income. This continues to be appealing to those who have investments but want income now.labels:investment,
Symbols:IYR,RWX,EEM,PID,IDV,PEY,EFA,SPY,SDY,PFF,DVY,FVD,VYM,VIG,
- ETF's for Income Rebound Well
11/23/2010
ETFs for high dividend stocks can be used to represent their corresponding equity classes in asset allocation. Monitoring these ETF's give insight into the funds for a high performance portfolio that provides income as well as growth. The fixed income (bond) trend is covered in a separate weekly report.
More details are available on the MyPlanIQ website.
Description
Symbol
Nov 22 Trend Score
Direction
Nov 15 Trend Score
iShares MSCI Emerging Markets Index
EEM
11%
^
8%
SPDR DJ Wilshire Intl Real Estate
RWX
10%
^
8%
PowerShares Intl Dividend Achievers
PID
10%
^
7%
iShares Dow Jones Intl Select Div Idx
IDV
10%
^
6%
iShares S&P U.S. Preferred Stock Index
PFF
8%
^
7%
iShares MSCI EAFE Index
EFA
8%
^
6%
iShares Dow Jones US Real Estate
IYR
8%
v
8%
PowerShares HighYield Dividend Achievers
PEY
8%
^
6%
SPDR S&P 500
SPY
7%
^
6%
SPDR S&P Dividend
SDY
7%
^
6%
iShares Dow Jones Select Dividend Index
DVY
7%
^
5%
Vanguard Dividend Appreciation
VIG
7%
^
5%
Vanguard High Dividend Yield Indx
VYM
7%
^
5%
First Trust Value Line Dividend Index
FVD
6%
^
5%
Top Three
COMMENT
Bottom Three
COMMENT
CONCLUSIONlabels:investment,
Symbols:IYR,RWX,EEM,PID,IDV,PEY,EFA,SPY,SDY,PFF,DVY,FVD,VYM,VIG,
- High Dividend Stock ETFs for Income Producing Portfolios
11/12/2010
We are initiating coverage on dividend producing ETF's in a number of different asset classes or styles. ETFs for high dividend stocks can be used to represent their corresponding equity classes in asset allocation. It is thus important to monitor their trends to gain insights into the funds to build a high performamce portfolio with the goal of providing income as well as growth. Fixed income (bond) trend is covered in a separate weekly report.
More details are available on the MyPlanIQ website.
DescriptionSymbol
8-Nov Trend Score
Direction
iShares Dow Jones US Real Estate
IYR
16%
First Week
SPDR DJ Wilshire Intl Real Estate
RWX
15%
First Week
iShares MSCI Emerging Markets Index
EEM
15%
First Week
PowerShares Intl Dividend Achievers
PID
11%
First Week
iShares Dow Jones Intl Select Div Idx
IDV
11%
First Week
PowerShares HighYield Dividend Achievers
PEY
10%
First Week
iShares MSCI EAFE Index
EFA
9%
First Week
SPDR S&P 500
SPY
9%
First Week
SPDR S&P Dividend
SDY
9%
First Week
iShares S&P U.S. Preferred Stock Index
PFF
9%
First Week
iShares Dow Jones Select Dividend Index
DVY
9%
First Week
First Trust Value Line Dividend Index
FVD
8%
First Week
Vanguard High Dividend Yield Indx
VYM
8%
First Week
Vanguard Dividend Appreciation
VIG
8%
First Week

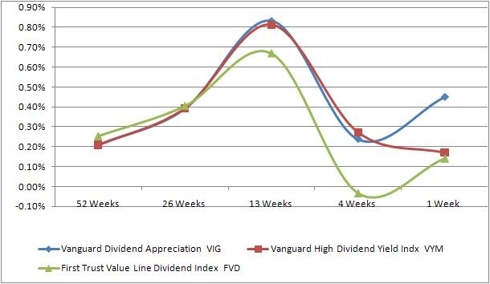
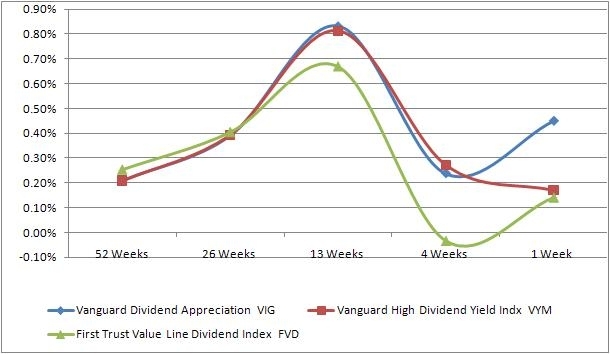
Despite the perception that real estate is a toxic asset, real estate trusts internationally and domestically continue to deliver strong results.
Emerging markets are also doing well as exports recover although the weakness of the dollar is a concern to many.
U.S. equity dividend stock ETFs have had similar performance. They under performed foreign dividend ETFs mostly due to dollar weakness. Their performance are all pointing to an up trend.
It is also noteworthy that U.S. dividend ETFs have similar returns as broad base indices such as s&P 500 while in the meantime, international dividend ETFs out perform their benchmark (MSCI EAFE Index).labels:investment,
Symbols:IYR,RWX,EEM,PID,IDV,PEY,EFA,SPY,SDY,PFF,DVY,FVD,VYM,VIG,
- Retirement Income Portfolio Building Using ETFs and Asset Allocation Strategies
11/12/2010
Building a steady and safe income producing portfolio is paramount to retirees. High yield stocks, preferred stocks, convertibles and bonds are the basic building blocks for such portfolios. Research results indicate that blue chip stocks with high dividends, unlike highly volatile and low dividend or no dividend stocks (such as many high tech stocks and small company stocks), have produced comparable or even slightly higher returns with less risk in long term.
In this article, we present a high income investment plan (Retirement Income ETFs) that is based on asset allocation strategies. Both MyPlanIQ Strategic Asset Allocation (SAA) and Tactical Asset Allocation (TAA) strategies are used to construct model portfolios.
This plan is designed for income producing purpose: high dividend (yield) stock ETFs are chosen for both US stocks and international stocks asset classes. We have decided to use general emerging market stocks ETFs (EEM or VWO) instead of some thinly traded high dividend emerging market stock ETFs. This situation will be changed once the high yield emerging market stock ETFs become more liquid and tradable.
The plan uses 34 ETFs that represent the following five key asset classes:
U.S. stocks: VIG, DVY, SDY, FVD, VYM, PEY, PFF
International stocks: PID, IDV
Emerging market stocks: EEM, VWO
Real Estate Investment Trusts (REITs): IYR, ICF, VNQ, RWX
Fixed Income:- US Fixed Income: HYG, LQD, VCLT, CIU, CORP, CSJ, VCSH, IEI, IEF, SHY, TLT, TIP, MBB, MUB, SHM
- International Fixed Income: BWX, EMB, PCY, WIP
Notice that preferred stocks PFF is classified under U.S. stocks.
We compared the back tested performances of the SAA and TAA moderate model portfolios with the corresponding SIB (Simpler Is Better) five core asset ETF portfolios. As of 11/9/2010, the performance is:Performance table (as of Nov 10, 2010)
Portfolio Name 1Yr AR 1Yr Sharpe 3Yr AR 3Yr Sharpe 5Yr AR 5Yr Sharpe Retirement Income ETFs Tactical Asset Allocation Moderate 16% 105% 8% 57% 12% 84% Retirement Income ETFs Strategic Asset Allocation Moderate 14% 108% 1% 5% 6% 28% Five Core Asset Index ETF Funds Tactical Asset Allocation Moderate 15% 105% 8% 57% 16% 106% Five Core Asset Index ETF Funds Strategic Asset Allocation Moderate 19% 146% 4% 16% 10% 42% From the above chart, one can see that since the portfolio inception (12/31/2000),the Retirement Income ETFs Strategic Asset Allocation Moderate has outperformed its corresponding Five Core Asset Index ETF Funds Strategic Asset Allocation Moderate while in the meantime, the Retirement Income ETFs Tactical Asset Allocation Moderate has outperformed its corresponding Five Core Asset Index ETF Funds Tactical Asset Allocation Moderate. In fact, in the past ten years, the Retirement Income portfolios had lower standard deviation than the Five Core SIB. Please visit the corresponding portfolios for more detailed performance information.
Currently, the SAA Moderate Portfolio has the following holdings and yields:Asset ETFs Allocation Yield REAL ESTATE ICF (iShares Cohen & Steers Realty Majors) 11.96% 2.88% FIXED INCOME LQD (iShares iBoxx $ Invest Grade Corp Bond) 18.40% 4.80% Emerging Market VWO (Vanguard Emerging Markets Stock ETF) 13.31% 1.20% US EQUITY DVY (iShares Dow Jones Select Dividend Index) 5.92% 3.53% US EQUITY PEY (PowerShares HighYield Dividend Achievers) 4.87% 4.28% INTERNATIONAL EQUITY IDV (iShares Dow Jones Intl Select Div Idx) 16.50% 4.25% High Yield Bond HYG (iShares iBoxx $ High Yield Corporate Bd) 16.47% 8.40% INTERNATIONAL BONDS BWX (SPDR Lehman Intl Treasury Bond) 12.57% 0.70% Total Yield 4% Compared with current sub-zero interests in a cash account, the above portfolio's yield is very attractive.
In conclusions, using effective asset allocation strategies (especially the tactical asset allocation strategy), one can build an income producing portfolio that is less risky and achieve higher returns. Retirees or anyone who needs supplemental income can benefit from learning more on these investment plans.labels:investment,
Symbols:VIG,DVY,SDY,FVD,VYM,PEY,PFF,SPY,IWM,PID,IDV,EFA,VEU,EEM,VWO,IYR,ICF,VNQ,RWX,HYG,LQD,VCLT,CIU,CORP,CSJ,VCSH,IEI,IEF,SHY,TLT,TIP,MBB,MUB,SHM,AGG,BND,BWX,EMB,PCY,WIP,
- How Plan Rating Stack up Against ETF Portfolios Returns -- Part 3
11/03/2010
- New York Times -- How Plan Rating Stack up Against ETF Portfolios -- Part 1
11/02/2010
- TD Ameritrade Commission Free ETF’s Empowers Both Strategic and Tactical Asset Allocation
10/19/2010
- AMERICAN EXPRESS RETIREMENT SAVINGS PLAN Report On 12/03/2010
12/03/2010
This report reviews AMERICAN EXPRESS RETIREMENT SAVINGS PLAN plan. We will discuss the investment choices and present the plan rating by MyPlanIQ. Current economic and market conditions are discussed in the context of the investment portfolios in the plan. We will then show how participants in AMERICAN EXPRESS RETIREMENT SAVINGS PLAN can achieve reasonable investment results using asset allocation strategies.
Plan Review and Rating
--
AMERICAN EXPRESS RETIREMENT SAVINGS PLAN's 401K plan consists of 24 funds. These funds enable participants to gain exposure to 4 major assets: US Equity, Foreign Equity, Emerging Market Equity, Fixed Income. The list of minor asset classes covered:
Diversified Emerging Mkts: EEM, GMM, PXH, DEM, SCHE
Foreign Large Blend: EFA, VEU, GWL, PFA
Foreign Large Value: EFV, PID, DWM
Foreign Small/mid Value: SCZ
Intermediate-term Bond: AGG, CIU, BIV, BND
Large Blend: IVV, IYY, IWV, VTI, VV, SPY, DLN, RSP, SCHX
Long-term Bond: CLY, LQD, BLV, VCLT
Mid-cap Blend: IJH, IWR, JKG, VO, MDY, EMM, PJG, DON, EZM, MVV
Small Blend: IJR, IWM, JKJ, VB, DSC, PJM, DES, SAA, UWM, SCHA
Us Equity: IVV, IYY, IWV, VTI, VV, SPY, DLN, RSP, SCHX
As of Dec 2, 2010, this plan investment choice is rated as based on MyPlanIQ Plan Rating methodology that measures the effectiveness of a plan's available investment funds. It has the following detailed ratings:
Diversification -- Rated as (61%)
Fund Quality -- Rated as (60%)
Portfolio Building -- Rated as (96%)
Overall Rating: (75%)Current Economic and Market Conditions
We have experienced an uncertain 2010: plenty of worries on whether the US economy will climb out of the great recession and recover.
- The Federal Reserve embarked on Quantitative Easing II (QE2) to stimulate the economy.
- The housing market is still at its low but largely stabilized.
- The unemployment rate is stuck at 9%.
Americans continue to face an uncertain future, given (among others) the high unemployment rate, large federal and local government debts and global trade imbalance. With such an economic backdrop, the stock and debt markets are going to be volatile. Despite this, markets have been resilient and appear positioned to rebound.
In this market it is even more critical to properly diversify and respond market changes. MyPlanIQ offers two asset allocation strategies: strategic and tactical asset allocation strategies ( SAA and TAA for participants in AMERICAN EXPRESS RETIREMENT SAVINGS PLAN).
Strategic Asset Allocation is based on well known modern portfolio theory and its key features include: diversification, proper fund selection and periodically re-balancing.
Tactical Asset Allocation works on a diversified array of assets provided by funds in a plan and adjusts asset mixes based on market conditions such as asset price momentum utilized by TAA.
Portfolio Discussions
The chart and table below show the historical performance of moderate model portfolios employing strategic and tactical asset allocation strategies. For comparison purpose, we also include the moderate model portfolios of a typical 4 asset SIB (Simpler Is Better) plan . This SIB plan has the following candidate index funds and their ETFs equivalent:
US Equity: (SPY or VTI)
Foreign Equity: (EFA or VEU)
Emerging Market Equity: (EEM or VWO)
Fixed Income: (AGG or BND)
Performance chart (as of Dec 2, 2010)Performance table (as of Dec 2, 2010)
Portfolio Name 1Yr AR 1Yr Sharpe 3Yr AR 3Yr Sharpe 5Yr AR 5Yr Sharpe AMERICAN EXPRESS RETIREMENT SAVINGS PLAN Tactical Asset Allocation Moderate 5% 50% 10% 100% 14% 124% AMERICAN EXPRESS RETIREMENT SAVINGS PLAN Strategic Asset Allocation Moderate 13% 108% 3% 16% 9% 49% Four Core Asset ETF Index Funds Emerging Markets Tactical Asset Allocation Moderate 1% 6% 6% 49% 12% 78% Four Core Asset ETF Index Funds Emerging Markets Strategic Asset Allocation Moderate 10% 75% 2% 6% 7% 31% Currently, asset classes in US Equity (SPY,VTI), Foreign Equity (EFA,VEU), Emerging Market Equity (EEM,VWO) and Fixed Income (AGG,BND) are doing relatively well. These asset classes are available to AMERICAN EXPRESS RETIREMENT SAVINGS PLAN participants.
To summarize, AMERICAN EXPRESS RETIREMENT SAVINGS PLAN plan participants can achieve reasonable investment returns by adopting asset allocation strategies that are tailored to their risk profiles.
Symbols: AXP , SPY , VTI , EFA , VEU , EEM , VWO , AGG , BND , IVV , IYY , IWV , VV , DLN , RSP , SCHX , CIU , BIV , GWL , PFA , SCZ , EFV , PID , DWM , IJH , IWR , JKG , VO , MDY , EMM , PJG , DON , EZM , MVV , IJR , IWM , JKJ , VB , DSC , PJM , DES , SAA , UWM , SCHA , GMM , PXH , DEM , SCHE , CLY , LQD , BLV , VCLT
- PEABODY WESTERN-UMWA 401(K) PLAN Report On 12/03/2010
12/03/2010
- Peabody Investments Corp.Employee Retirement Account Report On 12/03/2010
12/03/2010
- CVS CAREMARK CORPORATION AND AFFILIATED COMPANIES Report On 12/03/2010
12/03/2010
- Danaher Corporation Subsidiaries Retirement and Savings Plan Report On 12/03/2010
12/03/2010
- Danaher Corporation Subsidiaries Savings Plan Report On 12/03/2010
12/03/2010
- TD Ameritrade Commission Free ETFs Report On 12/07/2010
12/07/2010