How Plan Rating Stack up Against ETF Portfolios Returns -- Part 3
11/03/2010 0 comments
Plan rating is a quick and easy way to get a read on a plan and what a portfolio built from the funds in the plan can deliver. This is not the whole story but is a rapid means of making an assessment.
In this article we are comparing two sets of plans to expose what plan rating gives you and contrast it with backtested results.
1. News Corp Versus New York Times have been separately reviewed and the purpose here is to compare their plan profile and compare the plan ranking.
As of Oct 26, 2010 News Corp's plan and ratings summary is:
| Asset Class | News Corp Funds | New York Times Funds |
| U.S. Equity Excluding Company Stock | 3 | 6 |
| International Equity | 2 | 2 |
| Emerging Markets | 0 | 1 |
| Fixed Income Including Money Market | 2 | 2 |
| Target Date Funds | 0 | 11 |
| Plan Rating Attribute | News Corp | New York Times |
| Diversification | 4% | 64% |
| Fund Quality | 49% | 90% |
| Portfolio Building | 65% | 31% |
| Overall Rating | 42% | 59% |
Performance table (as of Oct 29, 2010)
| Portfolio Name | 1Yr AR | 1Yr Sharpe | 3Yr AR | 3Yr Sharpe | 5Yr AR | 5Yr Sharpe |
|---|---|---|---|---|---|---|
| News America (News Corp) 401k Savings Plan Tactical Asset Allocation Moderate | 8% | 67% | 6% | 62% | 10% | 92% |
| News America (News Corp) 401k Savings Plan Strategic Asset Allocation Moderate | 11% | 130% | 3% | 18% | 7% | 44% |
| THE NEW YORK TIMES COMPANIES SUPPLEMENTAL RETIREMENT AND INVESTMENT PLAN Tactical Asset Allocation Moderate | 10% | 85% | 7% | 62% | 13% | 114% |
| THE NEW YORK TIMES COMPANIES SUPPLEMENTAL RETIREMENT AND INVESTMENT PLAN Strategic Asset Allocation Moderate | 14% | 135% | 1% | 2% | 7% | 44% |
Currently, asset classes in US Equity ( SPY , VTI ) , Foreign Equity ( EFA , VEU ) and Fixed Income ( AGG , BND ) are doing relatively well. These asset
2. TD Ameritrade Versus Vanguard ETFs have been separately reviewed and the purpose here is to compare their plan profile and compare the plan ranking.
| Asset Class | TDA Funds | Vanguard Funds |
| U.S. Equity Excluding Company Stock | 31 | 33 |
| International Equity | 14 | 6 |
| Emerging Markets | 11 | 1 |
| Real Estate | 4 | 1 |
| Commodities | 6 | 1 |
| Sectors | 3 | 9 |
| Fixed Income Including Money Market | 32 | 11 |
| Plan Attribute | TDA | Vanguard |
| Diversification | 95% | 57% |
| Fund Quality | 26% | 56% |
| Portfolio Building | 92% | 51% |
| Overall Rating | 73% | 54% |
Performance chart (as of Oct 25, 2010):
| Portfolio Name | 1Yr AR | 1Yr Sharpe | 3Yr AR | 3Yr Sharpe | 5Yr AR | 5Yr Sharpe |
|---|---|---|---|---|---|---|
| Vanguard 62 Tactical Asset Allocation Moderate | 14% | 93% | 5% | 33% | 13% | 81% |
| Vanguard 62 Strategic Asset Allocation Moderate | 17% | 126% | 2% | 5% | 8% | 42% |
| TD Ameritrade Commission Free ETFs Tactical Asset Allocation Moderate | 14% | 96% | 13% | 84% | 20% | 128% |
| TD Ameritrade Commission Free ETFs Strategic Asset Allocation Moderate | 10% | 89% | -1% | -10% | 8% | 44% |
labels:investment,
Symbols:SPY,VTI,EFA,VEU,EEM,VWO,AGG,BND,AOM,CIU,BIV,GWL,PFA,EFV,PID,DWM,TZD,TZE,TZG,TZI,TZO,TZL,TZV,IVV,IYY,IWV,VV,DLN,RSP,SCHX,IVW,IWZ,JKE,VUG,ELG,QQQQ,RPG,SCHG,IJR,IWM,JKJ,VB,DSC,PJM,DES,SAA,UWM,SCHA,GMM,PXH,DEM,SCHE,
If we now compare ratings and five year performance we get the following graph: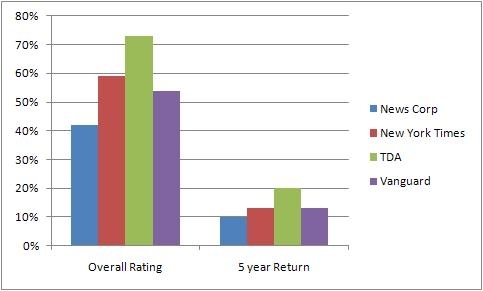
If we now normalize both sides 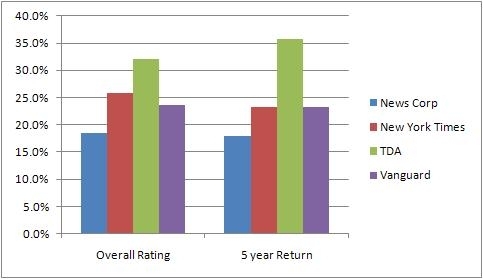
We can see that there is reasonable correlation between the plan rating and the five year return number.
Note that this is not an exact science and there are many exceptions. In addition, this is not the whole story, just a means of assessing a plan and uncovering where there may be weaknesses in the long term.
MyPlanIQ continues to improve the plan rating which is accessible to anybody at no cost.
comments 0
Or Start FREE 30-day trial now >>
