 |
Vanguard ETF: |  |
7.4%* |
|
Diversified Core: | |
8.1%* |
|
Six Core Asset ETFs: | |
7.3%* |
Articles on PCY
- Major Asset Movements Muted, Bonds Continue to Stabilize
12/27/2010
Last week, investors took a vacation: major asset movements were subdued while bonds continued to show signs of life: other than emerging market bonds (PCY or EMB), all bond sub-assets registered positive gains.
It is noteworthy to point out that U.S. stocks (VTI or SPY) and commodities (GSG or DBC) have been very strong; they were the only two risk assets that had positive returns last week. In addition, U.S. high yield (junk) bonds continued to recoup their losses and were consistent with the risk chasing attitude investors have shown recently. Municipal and mortgage back bonds were still at negative trend territory, showing a downtrend that was worse than cash (SHV or short term treasury bills).
All in all, it was a quiet week and investors enjoyed their long awaited holidays.
Assets Class Symbols 12/23
Trend
Score12/10
Trend
ScoreDirection Frontier Market Stks (FRN) 12.32% 13.93% v International REITs (RWX) 9.7% 10.35% v US Stocks (VTI) 9.41% 10.21% v Commodities (GSG) 9.08% 8.74% ^ Emerging Market Stks (VWO) 8.86% 9.64% v Gold (GLD) 8.16% 9.46% v US Equity REITs (VNQ) 6.24% 7.67% v International Developed Stks (EFA) 5.32% 6.51% v US High Yield Bonds (JNK) 3.86% 4.33% v US Credit Bonds (CFT) 1.1% 0.72% ^ Emerging Mkt Bonds (PCY) 1.04% 2.82% v International Treasury Bonds (BWX) 0.77% 0.54% ^ Intermediate Treasuries (IEF) 0.09% -0.73% ^ Total US Bonds (BND) 0.06% -0.19% ^ Treasury Bills (SHV) 0.02% 0.03% v Mortgage Back Bonds (MBB) -1.96% -1.71% v Municipal Bonds (MUB) -2.01% -3.5% ^ click to enlarge
labels:investment,
Symbols:AGG,BND,BWX,CFT,DBA,DBC,EEM,EFA,EMB,FRN,GLD,GSG,HYG,ICF,IEF,IWM,IYR,JNK,MBB,MUB,PCY,PHB,RWX,SHV,SPY,TLT,VEU,VNQ,VTI,VWO,
- ETF Outlook on Emerging Market Debt and Muni Bond Turbulence in 2011
12/21/2010
Last week, Emerging Market Bonds (PCY), T-Bills (SHV), MBS Bonds (MBB), and High Yields (JNK) were under selling pressure. The drop in emerging-markets debt came as a surprise as it gave up ground gained early in the week after the Fed’s reaffirmation on QE2. For more information, please visit MyPlanIQ 360 Degree Market View.
We make the following observations about last week's development:
-
Emerging Market Debt (PCY) weakened. Close attention is paid by investors to the inflationary pressures emerging markets are facing. Inflation has been rising rapidly in some emerging economies such as China. Monetary policy and interest rate changes will be in focus in the near term and remain as a catalyst for the market.
-
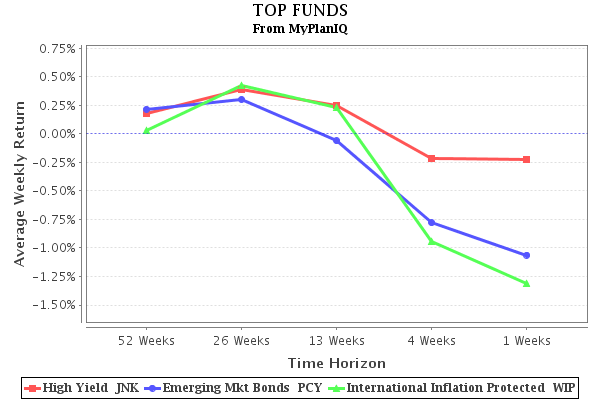
International Inflation Protected Bond fund (WIP) now takes the second spot in our following trend table with a gain of 0.5% last week
-
All medium-to-long-term U.S. government securities (TLH, TLT) gained ground last week. The flattening yield curve signals that the market expects no additional round of quantitative easing and usually foreshadows the end of Federal Reserve’s simulative rates cutting.
-
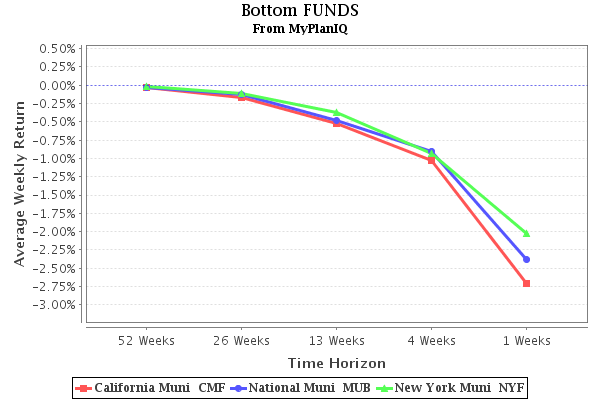
The outlook for the municipal bond market (MUB) (CMF) (NYF) remains tepid: States' fiscal problems may worsen in 2011 and put pressure on the federal government to bail out struggling states to avoid defaults. New Jersey governor Chris Christie commented on the dire fiscal problems many states face on 60 minutes that “the day of reckoning has arrived. That's it. And it's gonna arrive everywhere.”
Assets Class Symbols 12/17
Trend
Score12/10
Trend
ScoreDirection High Yield JNK 3.86% 4.33% v International Inflation Protected WIP 2.47% 2.12% ^ Long Term Credit LQD 1.33% 0.83% ^ Inflation Protected TIP 1.09% -0.3% ^ Emerging Mkt Bonds PCY 1.04% 2.82% v Intermediate Term Credit CIU 0.79% 0.43% ^ International Treasury BWX 0.77% 0.54% ^ Short Term Credit CSJ 0.57% 0.53% ^ Short Term Treasury SHY 0.29% 0.21% ^ Intermediate Treasury IEF 0.09% -0.73% ^ US Total Bond BND 0.06% -0.19% ^ Treasury Bills SHV 0.02% 0.03% v 10-20Year Treasury TLH -0.73% -1.28% ^ New York Muni NYF -1.43% -2.91% ^ MBS Bond MBB -1.96% -1.71% v National Muni MUB -2.01% -3.5% ^ 20+ Year Treasury TLT -2.07% -2.28% ^ California Muni CMF -3.39% -3.93% ^ Click charts to enlarge:


In conclusion, investors should remain cautious of municipal bonds. Default risk remains high and yields are poised to jump higher as the end of the federally subsidized Build America Bonds program puts more financial pressure on debt-riddled states and cities.labels:investment,
Symbols:AGG,BND,BWX,CIU,CMF,CSJ,EMB,HYG,IEF,JNK,LQD,MBB,MUB,NYF,PCY,PHB,SHV,SHY,TIP,TLH,TLT,WIP,
-
- Major Asset Trends: Municipal and Other Bonds Recover Some, Commodities Strong
12/20/2010
Major asset trends are critical to tactical asset allocation strategies such as our Tactical Asset Allocation. We track the trends weekly.
Last week, municipal bonds (MUB) had the strongest recovery. Credit bonds (investment grade bonds, CFT, CIU, LQD) also recovered some. With Bill Gross at PIMCO putting his own money to beaten down closed end bond funds (see here), investors were encouraged and flocked back to bonds.
The most noticeable trend shuffling is that commodities were strong and inched up to the top five spots. Among other risk assets, U.S. stocks continued to be strong while investors should pay attention to emerging market stocks' performance: they were lackluster in the past several weeks due to inflation concerns in China and India as well as the Korean peninsula tension.
Assets Class Symbols 12/17
Trend
Score12/10
Trend
ScoreDirection Frontier Market Stks (FRN) 12.32% 13.93% v International REITs (RWX) 9.7% 10.35% v US Stocks (VTI) 9.41% 10.21% v Commodities (GSG) 9.08% 8.74% ^ Emerging Market Stks (VWO) 8.86% 9.64% v Gold (GLD) 8.16% 9.46% v US Equity REITs (VNQ) 6.24% 7.67% v International Developed Stks (EFA) 5.32% 6.51% v US High Yield Bonds (JNK) 3.86% 4.33% v US Credit Bonds (CFT) 1.1% 0.72% ^ Emerging Mkt Bonds (PCY) 1.04% 2.82% v International Treasury Bonds (BWX) 0.77% 0.54% ^ Intermediate Treasuries (IEF) 0.09% -0.73% ^ Total US Bonds (BND) 0.06% -0.19% ^ Treasury Bills (SHV) 0.02% 0.03% v Mortgage Back Bonds (MBB) -1.96% -1.71% v Municipal Bonds (MUB) -2.01% -3.5% ^ click to enlarge
labels:investment,
Symbols:AGG,BND,BWX,CFT,DBA,DBC,EEM,EFA,EMB,FRN,GLD,GSG,HYG,ICF,IEF,IWM,IYR,JNK,MBB,MUB,PCY,PHB,RWX,SHV,SPY,TLT,VEU,VNQ,VTI,VWO,
- Credit Market Trends: Upbeat Data Adds to Pressure on Treasuries
12/14/2010
Fixed income indices provide important insight into debt market conditions that are key to asset allocation strategies such as our Tactical Asset Allocation. MyPlanIQ uses representative ETFs and tracks detailed weekly bond trend movements. For detailed information, please visit MyPlanIQ 360 Degree Market View.
As the economic outlook continues to improve with better-than-expected U.S. trade and consumer-sentiment reports, Treasuries sank in the week ended on 12/10. The brighter economic outlook has prompted investors to seek higher returns in riskier assets.
The 10-year note's yield surged more than 0.30% last week, driving down prices of the 10-20 Year Treasury Bond Fund (TLH). The rising yields also pushed up long-term borrowing costs for consumers and businesses. As a result, national mortgage rates moved higher last week. The MBS Bond Fund (MBB) registered a weekly drop of 0.66%. With a struggling housing market, higher mortgage rates pose a threat to the recovery of the housing sector and the broader economy. If high interest rates persist in the weeks ahead, we expect to see a further drop in (MBB).
Lower Treasury bond prices and higher yields were also putting pressure on the high yield bonds (JNK). High yield investors need to remain cautious and pay particular attention on the rate at which the Treasury benchmark rises - the pace of increase in the junk bond yield spreads over Treasuries might eventually catch up with that of the rising benchmark, further putting pressure on the prices of junk bonds.
Yields on munis (MUB) also rose along with Treasuries as investors grappled with the ramifications of the likely end of the government-subsidized Build America Bond Program. As more states and cities rush to tap the tax-exempt debt market to raise funds before year-end, investors are concerned that, as a result of incremental supply, there will be a sell-off. Uncertainties around the extension of this popular program has triggered a great deal of volatility in the market and will remain to be the case until after the passage of the tax bill.
Assets Class
Symbols
12/10
Trend
Score
12/03
Trend
Score
Direction
High Yield
(JNK)
4.33%
4.81%
v
Emerging Mkt Bonds
(PCY)
2.82%
3.14%
v
International Inflation Protected
(WIP)
2.12%
2.65%
v
Long Term Credit
(LQD)
0.83%
1.3%
v
International Treasury
(BWX)
0.54%
0.98%
v
Short Term Credit
(CSJ)
0.53%
0.85%
v
Intermediate Term Credit
(CIU)
0.43%
1.37%
v
Short Term Treasury
(SHY)
0.21%
0.46%
v
Treasury Bills
(SHV)
0.03%
0.03%
v
US Total Bond
(BND)
-0.19%
0.59%
v
Inflation Protected
(TIP)
-0.3%
1.32%
v
Intermediate Treasury
(IEF)
-0.73%
1.03%
v
10-20Year Treasury
(TLH)
-1.28%
0.2%
v
MBS Bond
(MBB)
-1.71%
-1.8%
^
20+ Year Treasury
(TLT)
-2.28%
-1.93%
v
New York Muni
(NYF)
2.91%
-1.45%
v
National Muni
(MUB)
-3.5%
-1.81%
v
California Muni
(CMF)
-3.93%
-1.83%
v
click to enlarge images
Top Three indicators

Bottom Three Indicators

labels:investment,
Symbols:AGG,BND,BWX,CIU,CMF,CSJ,EMB,HYG,IEF,JNK,LQD,MBB,MUB,NYF,PCY,PHB,SHV,SHY,TIP,TLH,TLT,WIP,
- U.S. Stocks Strong; Other Bond Markets Continue to Slump
12/13/2010
Last week, we continued to observe major weakness in fixed income markets. From our Market View, one can see that most bond ETFs underwent 1-2% loss. Municipal bonds and intermediate term treasuries were the biggest losers. Municipal bonds were avoided due to the concerns on the dire financial situations of state and local governments, let alone the extreme low yields to begin with. Investors were also worried about longer term bonds, including treasuries and corporate bonds based on inflation outlook.
Based on the major asset price trends in the following table, other noticeable developments include:
- US Stocks were very strong, now placed in the third spot among all other major asset classes.
- US REITs continued their weakness, losing 1.3% last week and were out of top five spots.
- all fixed income asset classes were at the bottom of the ranking: the lower the perceived risks based on conventional wisdom, the lower their rankings were.
- Broad base commodities were relatively intact while gold continued its correction.
Assets Class Symbols 12/10
Trend
Score12/03
Trend
ScoreDirection Frontier Market Stks (FRN) 13.93% 13.33% ^ International REITs (RWX) 10.35% 10.73% v US Stocks (VTI) 10.21% 9.57% ^ Emerging Market Stks (VWO) 9.64% 11.67% v Gold (GLD) 9.46% 11.1% v Commodities (GSG) 8.74% 10.22% v US Equity REITs (VNQ) 7.67% 9.21% v International Developed Stks (EFA) 6.51% 6.94% v US High Yield Bonds (JNK) 4.33% 4.81% v Emerging Mkt Bonds (PCY) 2.82% 3.14% v US Credit Bonds (CFT) 0.72% 0.94% v International Treasury Bonds (BWX) 0.54% 0.98% v Treasury Bills (SHV) 0.03% 0.03% v Total US Bonds (BND) -0.19% 0.59% v Intermediate Treasuries (IEF) -0.73% 1.03% v Mortgage Back Bonds (MBB) -1.71% -1.8% ^ Municipal Bonds (MUB) -3.5% -1.81% v The takeaway is that investors continued their strong risk appetite. Among risk assets, US stocks stood out as worries in European debt markets and inflation pressure in emerging markets dampened demands on those assets.
labels:investment,
Symbols:AGG,BND,BWX,CFT,DBA,DBC,EEM,EFA,EMB,FRN,GLD,GSG,HYG,ICF,IEF,IWM,IYR,JNK,MBB,MDY,MUB,PCY,PHB,QQQQ,RWX,SHV,SLV,SPY,TLT,VEU,VNQ,VTI,VWO,
- Credit Market ETF Trends: Optimism as European Debt Concerns Fade
12/07/2010
- Major Asset Trends: Emerging Market Stocks Had a Bigger Drop while U.S. REIT Held Up Well
11/30/2010
- Fixed Income Trends: Credit Markets Largely Stabilized
11/30/2010
- ETF Based Bond Trend Indicators For The Week of November 22
11/23/2010
- Using Morningstar's Top Bond Manager to Build a Low Stress Portfolio
11/19/2010
- ETF Based Major Asset Class Trend Indicators For The Week of November 15
11/15/2010
- ETF Based Bond Trend Indicators For The Week of November 15
11/15/2010
- Retirement Income Portfolio Building Using ETFs and Asset Allocation Strategies
11/12/2010
- ETF Based Major Asset Class Trend Indicators For The Week of November 8
11/08/2010
- TD Ameritrade Commission Free ETF’s Empowers Both Strategic and Tactical Asset Allocation
10/19/2010
- Case Study: Hewlett Packard's 401K Plan
10/09/2010
- Google’s 401K Plan: Another Good Employee Benefit
09/26/2010
- Getting Most out of Your Retirement Plan: A Case Study on Hewlett Packard 401K Plan
09/16/2010


- TD Ameritrade Commission Free ETFs Report On 12/07/2010
12/07/2010
Retirement investing is an integral part of American personal finance. With $8.9 trillion parked in over 800 thousand retirement plans such as 401K, millions of Americans will increasingly rely on their 401K accounts to fund their future retirement needs. This article is part of a series of case studies we are conducting for various 401K plans. In this article, we will discuss how participants in TD Ameritrade Commission Free ETFs can achieve reasonable investment results using asset allocation strategies. We will also discuss how those portfolios are positioned in today’s market environment.
TD Ameritrade (Ticker: AMTD) offers 100+ commission free ETFs for its clients. The main restriction is that customers have to hold these ETFs for more than 30 days to make such trades eligible for commission free.
In this plan, the minimum holding period for each fund is set to be 1 month, which is equivalent to 30 days.
See the official TD Ameritrade offering for more details.
TD Ameritrade Commission Free ETFs's 401K plan consists of 101 funds. These funds enable participants to gain exposure to 6 major assets: US Equity , Foreign Equity , Commodity , Emerging Market Equity , REITs , Fixed Income . The list of minor asset classes covered:
Commodities Broad Basket: GSG , DBC
Conservative Allocation: AOK
Diversified Emerging Mkts: EEM , GMM , PXH , DEM , SCHE
Emerging Markets Bond: PCY
Equity: VTI , VT
Europe Stock: IEV , VGK , PEF , DEB
Foreign Large Blend: EFA , VEU , GWL , PFA
Foreign Large Growth: EFG
Foreign Large Value: EFV , PID , DWM
Foreign Small/mid Growth: IFSM , VSS , SCHC
Foreign Small/mid Value: SCZ
Global Real Estate: IFGL , RWX
High Yield Bond: HYG , JNK , PHB
Inflation-protected Bond: TIP
Intermediate Government: IEI , VGIT , ITE
Intermediate-term Bond: AGG , CIU , BIV , BND
Japan Stock: EWJ , JPP , PJO , DXJ
Large Blend: IVV , IYY , IWV , VTI , VV , SPY , DLN , RSP , SCHX
Large Growth: IVW , IWZ , JKE , VUG , ELG , QQQQ , RPG , SCHG
Large Value: IVE , IWW , JKF , VTV , ELV , PWV , RPV , SCHV
Latin America Stock: ILF , GML
Long Government: TLT , TLH , IEF , EDV , VGLT , TLO , PLW
Long-term Bond: CLY , LQD , BLV , VCLT
Mid-cap Blend: IJH , IWR , JKG , VO , MDY , EMM , PJG , DON , EZM , MVV
Mid-cap Growth: IJK , IWP , VOT , EMG , PWJ , RFG , UKW
Mid-cap Value: IJJ , IWS , JKI , VOE , EMV , PWP , RFV , UVU
Moderate Allocation: AOM
Multisector Bond: AGG , GBF , BND , LAG
Muni National Interm: ITM
Muni National Long: MUB , TFI , PZA , MLN
Muni National Short: SUB , SHM , PVI , SMB
Pacific/asia Ex-japan Stk: EPP , AAXJ , GMF , PAF , DND
Real Estate: IYR , ICF , VNQ
Short Government: SHY , SHV , VGSH , PLK , USY
Short-term Bond: CSJ , BSV , VCSH
Small Blend: IJR , IWM , JKJ , VB , DSC , PJM , DES , SAA , UWM , SCHA
Small Growth: IJT , IWO , JKK , VBK , DSG , PWT , RZG , UKK
Small Value: IJS , IWN , JKL , VBR , DSV , PWY , RZV , UVT
Specialty-real Estate: RWR , PSR , URE
World Allocation: AOR , AOA
World Bond: IGOV , BWX , WIP
World Stock: IOO , VT
As of Dec 3, 2010, this plan investment choice is rated as above average based on MyPlanIQ Plan Rating methodology that was designed to measure how effective a plan's available investment funds are . It has the following detailed ratings:
Diversification -- Rated as great (97%)
Fund Quality -- Rated as below average (21%)
Portfolio Building -- Rated as great (87%)
Overall Rating: above average (70%)The chart and table below show the historical performance of moderate model portfolios employing strategic and tactical asset allocation strategies ( SAA and TAA , both provided by MyPlanIQ). For comparison purpose, we also include the moderate model portfolios of a typical 6 asset SIB (Simpler Is Better) plan . This SIB plan has the following candidate index funds and their ETFs equivalent:
US Equity :( SPY or VTI )
Foreign Equity :( EFA or VEU )
Commodity :( DBC )
Emerging Market Equity :( EEM or VWO )
REITs :( IYR or VNQ or ICF )
Fixed Income :( AGG or BND )
Performance chart (as of Dec 3, 2010)Performance table (as of Dec 3, 2010)
Portfolio Name 1Yr AR 1Yr Sharpe 3Yr AR 3Yr Sharpe 5Yr AR 5Yr Sharpe TD Ameritrade Commission Free ETFs Tactical Asset Allocation Moderate 9% 68% 12% 78% 18% 115% TD Ameritrade Commission Free ETFs Strategic Asset Allocation Moderate 8% 71% -1% -8% 7% 36% Six Core Asset ETFs Tactical Asset Allocation Moderate 10% 67% 9% 69% 16% 105% Six Core Asset ETFs Strategic Asset Allocation Moderate 11% 87% 3% 12% 8% 37% Currently, asset classes in US Equity ( SPY , VTI ) and Emerging Market Equity ( EEM , VWO ) are doing relatively well. These asset classes are available to TD Ameritrade Commission Free ETFs participants.
To summarize, TD Ameritrade Commission Free ETFs plan participants can achieve reasonable investment returns by adopting asset allocation strategies that are tailored to their risk profiles. Currently, the tactical asset allocation strategy indicates overweighing on US Equity and Emerging Market Equity funds.
Disclosure:Symbols: , SPY , VTI , EFA , VEU , EEM , VWO , IYR , VNQ , ICF , AGG , BND , DBC , VT , HYG , JNK , PHB , AOM , AOK , CIU , BIV , ITM , SUB , SHM , PVI , SMB , AOR , AOA , MUB , TFI , PZA , MLN , EFG , GWL , PFA , IVE , IWW , JKF , VTV , ELV , PWV , RPV , SCHV , SCZ , EFV , PID , DWM , IFGL , RWX , IGOV , BWX , WIP , RWR , PSR , URE , IVV , IYY , IWV , VV , DLN , RSP , SCHX , IOO , SHY , SHV , VGSH , PLK , USY , TLT , TLH , IEF , EDV , VGLT , TLO , PLW , IEV , VGK , PEF , DEB , IVW , IWZ , JKE , VUG , ELG , QQQQ , RPG , SCHG , IJJ , IWS , JKI , VOE , EMV , PWP , RFV , UVU , IJH , IWR , JKG , VO , MDY , EMM , PJG , DON , EZM , MVV , IFSM , VSS , SCHC , IJS , IWN , JKL , VBR , DSV , PWY , RZV , UVT , IJR , IWM , JKJ , VB , DSC , PJM , DES , SAA , UWM , SCHA , GMM , PXH , DEM , SCHE , CLY , LQD , BLV , VCLT , GBF , LAG , PCY , CSJ , BSV , VCSH , IEI , VGIT , ITE , IJK , IWP , VOT , EMG , PWJ , RFG , UKW , ILF , GML , IJT , IWO , JKK , VBK , DSG , PWT , RZG , UKK , TIP , EPP , AAXJ , GMF , PAF , DND , EWJ , JPP , PJO , DXJ , GSG