
The Best Age (62, 67, or 70) to Claim Your Social Security Benefits
In this issue:
- Latest in Retirement Savings & Personal Finance: Social Security Benefit Tax in One Big Beautiful Bill, The Worst US Treasury Bond Returns in History!
- The Best Age (62, 67, or 70) to Claim Your Social Security Benefits
- Tools & Tips: Social Security Benefit Claim Age Calculator
- Market Overview
Latest in Retirement Savings & Personal Finance: Social Security Benefit Tax in One Big Beautiful Bill, The Worst US Treasury Bond Returns in History!
Social Security Tax in One Big Beautiful Bill
Unlike what President Trump and a few others have claimed, OBBB doesn’t include anything that cuts the federal tax on Social Security benefits. No phaseout, no relief for middle income retirees, not even a token inflation adjustment. It’s just not in there. People say otherwise, probably because the idea polls well. But the bill, as written, keeps the current taxation formula fully intact.
The way it works is, first, half of your Social Security benefits will be added to your adjusted gross income to decide whether you need to pay tax on the benefits at all. Once your combined income crosses a certain threshold, then a portion of your benefits becomes taxable. For some, that portion can go up to 85 percent. These thresholds were set in the 1980s and 1990s and never indexed for inflation, so over time more retirees get caught by them. It was supposed to be a limited tax for higher earners. Now it quietly affects a wide middle. And OBBB doesn’t change a word of it.
A Decade of Pain in Fixed Income
We have just witnessed the worst 10-year rolling nominal return for US Treasuries in history. Looking at 10-year Treasury notes rolling return chart below, the rolling return over the past decade has come in barely above zero, something around 0.4 percent annualized return, per Deutsche Bank. That includes both the years when rates were pinned near zero and the more recent collapse in bond prices as yields spiked. It’s not just bad in relative terms. It’s historically bad, worse than the stagflation era in the 1970s and even worse than the 1940s. In fact this is the worst since 1800!

The background to all this seems simple enough. After the financial crisis, the Fed kept rates near zero for almost a decade. Then came COVID, and things went even further. Bond yields were pushed down to emergency levels and stayed there far too long. So anyone holding long-dated Treasuries was locking in yields that barely beat inflation, with almost no upside. And then inflation hit hard, the Fed started hiking fast, and bond prices fell apart. What used to feel like the safest part of a portfolio suddenly was not.
But that is only part of the story. In reality, this is also the result of what our government and central bank have been doing for decades. Ultra loose fiscal spending, repeated bailouts, rate cuts that lasted too long, and no real political will to deal with debt or structural deficits. We just kept kicking the can, again and again. And now the market is forcing a kind of reckoning. What could not be solved by policy is being handled by price.
Yes, it is finally coming back to bite us.
Even worse, many fixed income fund investors did not just buy a 10-year Treasury and hold it to maturity. Instead, they owned intermediate or long duration bond funds. These funds constantly roll over bonds, so they felt the full brunt of rate hikes without the comfort of knowing they’ll be made whole at the end. The result is deep drawdowns and even underperformed just merely holding 10-year Treasury to maturity, which we know is already the worst in the history!
| Name | 3Yr AR | 5Yr AR | 10Yr AR | 15Yr AR | 20Yr AR |
|---|---|---|---|---|---|
| VBMFX (VANGUARD TOTAL BOND MARKET INDEX FUND INVESTOR SHARES) | 1.98% | -1.15% | 1.56% | 1.99% | 2.95% |
| Holding 10-Year Treasury Till Maturity | 2.98% | 0.66% | 2.36% | 3.21% | 4.05% |
So, holding a total bond market index fund like VBMFX, which many people do in their 401(k) accounts, has basically underperformed in every trailing period: 3, 5, 10, 15, and 20 years!
The Best Age (62, 67, or 70) to Claim Your Social Security Benefits
Choosing when to start your Social Security benefits is one of the most critical long-term choices in retirement planning. The monthly amount can vary a lot depending on the age you start. But it’s not just about the size of the check. It’s also about timing, investing, and life expectancy.
Claiming Early at Age 62
If your full retirement benefit is $2,000 per month at age 67, claiming early at 62 would reduce that to $1,400 per month. That is a 30 percent reduction, permanent for life. But you would receive five extra years of income, which adds up:
- $1,400 per month for 60 months equals $84,000 in total early payments
For someone who needs income right away, or is in poor health and not expecting to live far past 79, this might be a smart choice. Even if you don’t spend the income immediately, there’s a way to look at the math more strategically.
Let’s say you claim at 62, set aside that $84,000, and begin withdrawing $600 per month starting at age 67 (which is the monthly shortfall from claiming early). That amount lasts 12 years. So the break-even age is about 79. If you live longer than that, you would have been better off waiting until 67. If you do not, you come out ahead.
What if You Invest the Early Benefits?
If you don’t spend the benefit and instead invest it, your break-even age can stretch much further. Using that same $84,000 figure:
- At 6 percent annual return, the money would last 27 years if you withdraw $600 per month and the break-even age becomes 94
- At 5 percent return, the break-even age is 89
- At 4 percent return, break-even is 85
- At 3 percent return, break-even is 83
- At 0 percent return, break-even is still 79
So if you are confident you can invest at 4 percent or higher and live into your mid-80s, the early claim at 62 may still outperform. Especially if you are not relying on that income for living expenses.
Waiting Until Full Retirement at Age 67
Claiming at 67 gets you the full benefit with no reduction. If the benefit is $2,000 per month, there is no adjustment up or down. For someone with average life expectancy, this is often the neutral, risk-managed choice. You don’t take on investment risk and don’t face a long delay to receive benefits.
If you think you’ll live into your 80s and you don’t need the money urgently, waiting until 67 usually works better than claiming early and spending the income. But if you have strong investment options or are using the early benefit for planned investment, then it’s more of a coin toss.
Delaying Until Age 70
By waiting until 70, your benefit increases by 24 percent. So that $2,000 per month becomes $2,480. But you give up three years of income, which adds up to $72,000. If you claim at 67 and invest that $72,000, how long until you break even?
Here’s what the numbers say:
- At 6 percent return, break-even age is 94
- At 5 percent, it is 92
- At 4 percent, it is 89
- At 3 percent, it is 87
- At 0 percent, it is about 82.5
So for someone expecting to live past 90, waiting until 70 could be the better option. But the benefit comes late. If you don’t live into your 80s, the higher payout never makes up for the years of missed income.
Other Factors: Investment Risk and Real-World Fluctuations
All the examples above assume steady returns. But real investment returns go up and down. If your portfolio takes losses early on, the long-term outcome may fall short. On the other hand, strong early gains might pull your break-even forward. For most conservative investors:
- A steady return of 3 to 5 percent is realistic in a bond-heavy portfolio
- Higher returns are possible, but involve more volatility
- If returns are volatile, timing and sequence risk become more important
Someone relying on stocks should understand that a few bad years early in retirement could delay the break-even age or reduce the total accumulated benefit.
In a word, you should carefully go through your situation and decide what to do. See Maximizing Your Social Security: When to Claim Benefits for more detailed discussion. Also the following calculator could be helpful.
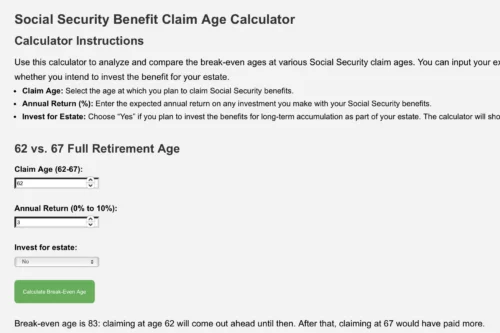
Tools & Tips: Social Security Benefit Claim Age Calculator
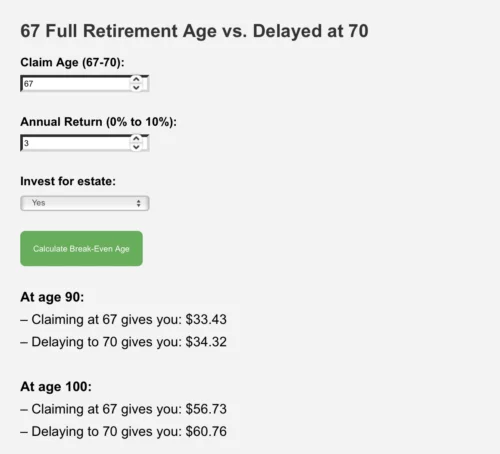
The Social Security Benefit Claim Age Calculator is designed to help you compare the benefits of claiming your social security benefit at different ages, specifically 62 (early retirement) vs. 67 (full retirement age) and 67 vs. 70 (delayed retirement age). In addition to entering various expected investment returns if the benefit is invested instead of consumed, it also allows you to see how much accrued benefits after investment if you don’t need the benefit for your retirement, instead, you want it to be invested and be part of your estate to leave to your heirs.
The 62 vs 67 break even age:
The 67 vs 70 accrued interests
Market Overview
Stocks continued to ascend, breaking historical highs again last week. Economy wise, the U.S. inflation rate accelerated to 2.7 percent in June 2025, up from 2.4 percent in May. This is the highest reading since February. However, core inflation (which excludes food and energy) edged up to 2.9 percent but still came in below forecasts. It remains to be seen whether the recent tariff-induced price increases will begin to show up more clearly in the future inflation data.
The following table shows the major asset price returns and their trend scores, as of last Friday:
| Asset Class | 1 Weeks | 4 Weeks | 13 Weeks | 26 Weeks | 52 Weeks | Trend Score |
|---|---|---|---|---|---|---|
| US Stocks | 0.6% | 4.7% | 22.6% | 5.8% | 14.7% | 9.7% |
| Foreign Stocks | 0.6% | 3.6% | 14.1% | 17.8% | 15.9% | 10.4% |
| US REITs | -0.1% | 0.0% | 7.2% | 2.6% | 4.4% | 2.8% |
| Emerging Market Stocks | 2.2% | 6.1% | 16.9% | 15.7% | 17.2% | 11.6% |
| Bonds | 0.3% | 0.3% | 2.0% | 3.4% | 4.3% | 2.1% |
More detailed returns and trend scores can be found on MyPlanIQ.com Market Overview.
Try to Find Your Old Retirement Accounts?
Find Tools and Calculators That Provide Quick Help