
Chasing Income with Those High Yield ETFs. Smart or Misleading?
In this issue:
- Latest in Retirement Savings & Personal Finance: Missed Car Loan at a Record Level, Employment Numbers Revised Down Sharply, 31% of Retirees Considering Returning to Work
- Chasing Income with Those High Yield ETFs. Smart or Misleading?
- Tools & Tips: ULTY or MSTY Dividend Calculators
- Market Overview
Latest in Retirement Savings & Personal Finance: Missed Car Loan at a Record Level, Employment Numbers Revised Down Sharply, 31% of Retirees Considering Returning to Work
Missed Car Loan Payments at a Record Level
Based on Axios, in early 2025, Americans reached a milestone: subprime auto borrowers were 60+ days past due on their payments at 6.56%, the highest level since Fitch Ratings began tracking it in 1994. That rate surpassed the previous peaks of the late 2024 surge. Prime borrowers, by contrast, remained far steadier: it has only 0.39% delinquent, up slightly from 0.35% a year earlier.
Meanwhile Q1 2025 data from the New York Fed shows 90‑day delinquency rate at 5.0%, up from its low but still below the worst levels seen in 2010 (~5.3%). Auto debt totalled about $1.64 trillion, making auto loans the second‑largest consumer debt category after mortgages . All signs are pointing to high interest, insurance increases, inflation and steep prices. They continue to strain subprime borrowers.

Employment Numbers Revised Down Sharply
U.S. job growth slow dramatically in July: just 73,000 non-farm jobs were added in July. This is well below forecasts of ~110,000 . More significantly, May and June payroll data were revised downward by a staggering 258,000 jobs combined. This is the largest non‑pandemic correction since 1979. The unemployment rate ticked up to 4.2%, from 4.1% in June .
Shortly after the report, President Trump fired BLS Commissioner Erika McEntarfer, accusing her of politicizing the data. However independent experts have emphasized that large revisions are routine if unusual, especially during volatile periods. The move raised alarm over politicization of economic institutions. The BLS has since named Acting Commissioner William Wiatrowski, and reassured the public of its non‑partisan data integrity. Either way, we are seeing lots of firework. Just hope these are good firework!
31% of Retirees Considering Returning to Work
Various surveys have shown older Americans are under pressure to maintain their financial well beings even beyond standard retirement ages. Surveys show that approximately one‑third of retirees in America are weighing a return to work. Nationwide’s Retirement Institute found 30% of people aged 61–65 are reconsidering retirement in light of financial pressures and concerns over Social Security sustainability. Half of them cited fear of running out of money as the top motivator.
Although not exactly 31%, other surveys confirm similar ranges: ResumeBuilder data from September 2024 indicated 13% of retired seniors were likely to work in 2025, with 79% of those returning planning part‑time jobs, and concerns about age bias common among them. These findings collectively point to a notable increase in “un‑retirement” driven by financial shortfalls, rising inflation and changing personal needs.
Chasing Income with Those High Yield ETFs. Smart or Misleading?
In recent years, option-based income funds have gained significant popularity among income-focused investors. We’ve received numerous inquiries from our subscribers about these funds, and we believe it’s worthwhile to examine them in greater detail.
The so-called option-based income funds utilize strategies such as covered call writing or put writing to generate income through options premiums. Using an underlying ETF, index, or even a single stock that’s highly volatile (thus high option premium), these funds often provide exceptionally high income yields. For instance, the trailing 12-month yield of the YieldMax TSLA Option Income Strategy ETF TSLY stands at an astounding 72%!
This type of income-generating fund has gained traction, particularly through YieldMax ETFs, which focus on high-tech and high-growth stocks such as Tesla, Coinbase, and Apple, among others.
However, if we look at the total returns (dividend reinvested) of these funds, compared with their underlying stocks, they lagged significantly. For example, as of 1/3/2025:
- TSLY: Over the last 12 months, it generated a total return of 16.6%, compared to Tesla’s 39.6%.
- MSTY: Delivered a total return of 91.5%, significantly trailing MSTR (Microstrategy) 142.5%.
- XOMO: Achieved a total return of -4.6%, still worse than -2.98% loss.
YieldMax ETFs have extremely high expense ratios too: most of them are 0.99%!
YieldMax also recently featured a new ultra option ETF ULTY that essentially does covered calls (selling call options on the underlying stocks) on several stocks it chooses dynamically (i.e. can change over times).
Here is the ULTY comparison with just a boring plain vanilla dividend ETF:
| Name | YTD Return | 1Yr AR | Since 2/29/2024 | 12-Month Yield |
|---|---|---|---|---|
| ULTY (YieldMax Ultra Option Income Strategy ETF) | 12.67% | 27.33% | 13.28% | 65.51% |
| VIG (Vanguard Dividend Appreciation ETF) | 5.17% | 10.53% | 17.53% | 1.87% |
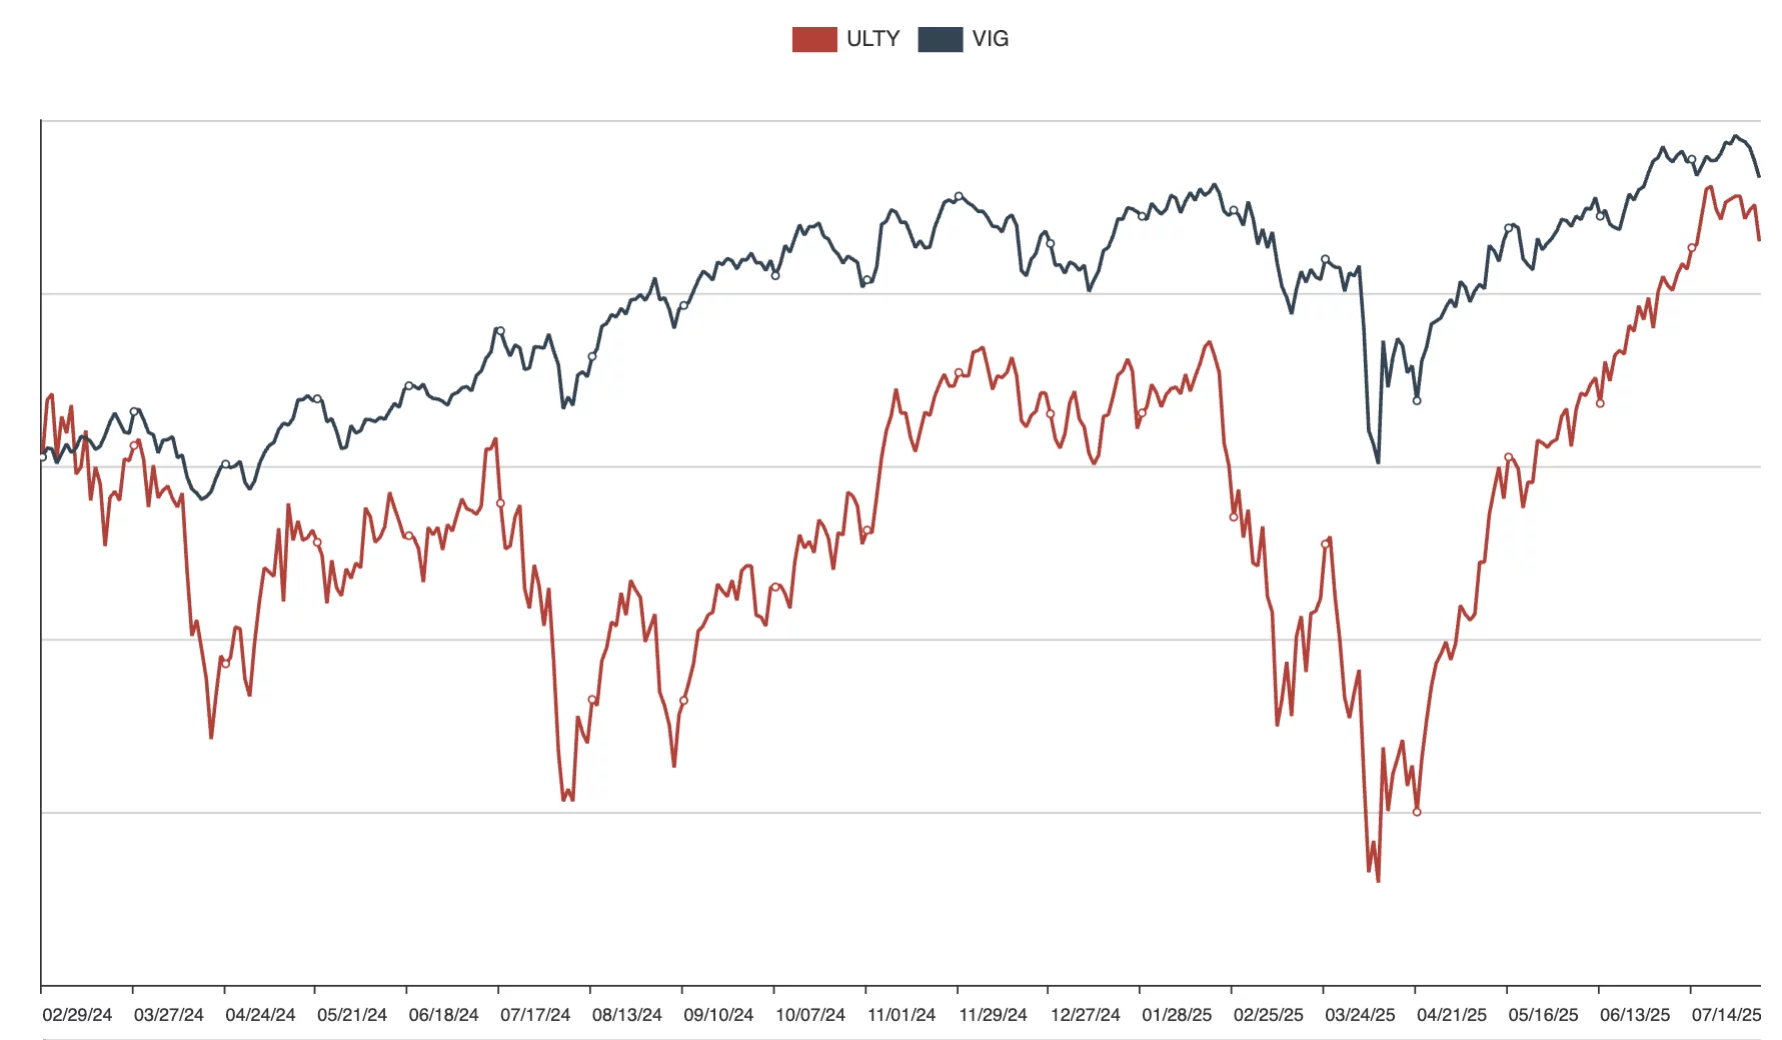
Even though with the astounding high yield, its total return, i.e. price appreciation + dividend reinvested, is actually less than VIG’s since ULTY went to market in 2/2024! Furthermore, from the above chart, one can see ULTY return is a lot more volatile than VIG! Talk about income investments that are supposed to be steady!
We have consistently advocated for a total return approach. This strategy emphasizes overall total returns rather than relying solely on income-producing assets like bonds or dividend-paying stocks or option-based income funds. In this approach, investors generate cash by selling shares from the underlying stock or ETF when income is needed.
While some investors might find the periodic selling of shares is a hassle, this can be mitigated by selling less frequently, such as quarterly or semi-annually instead of monthly. More importantly, this approach often delivers superior returns by avoiding the high expenses and capped upside potential associated with option-based income ETFs or similar methods. Additionally, it is more tax-efficient, as investors can sell shares held long-term, thereby classifying the income as long-term capital gains. This contrasts with option premiums, which are typically treated as short-term capital gains or taxed as ordinary income.
For more information, refer to Option-Based Income Funds: Pros and Cons and the up-to-date YieldMax ETFs Comparison return table.
Tools & Tips: ULTY or MSTY Dividend Calculators
Speaking of high yields, we think investor can utilize our dividend calculators to calculate the dividend yields of any ETF, mutual fund or stock for a given period (such as 10 years or last 1 year). You can either use The Dividend Calculator for Stocks, ETFs, and Mutual Funds or just simply get a quote on the ETF or stock you are interested such as this ULTY quote page. You’ll find the dividend calculator for ULTY on that page.
To use The Dividend Calculator for Stocks, ETFs, and Mutual Funds, you just simply enter the following:
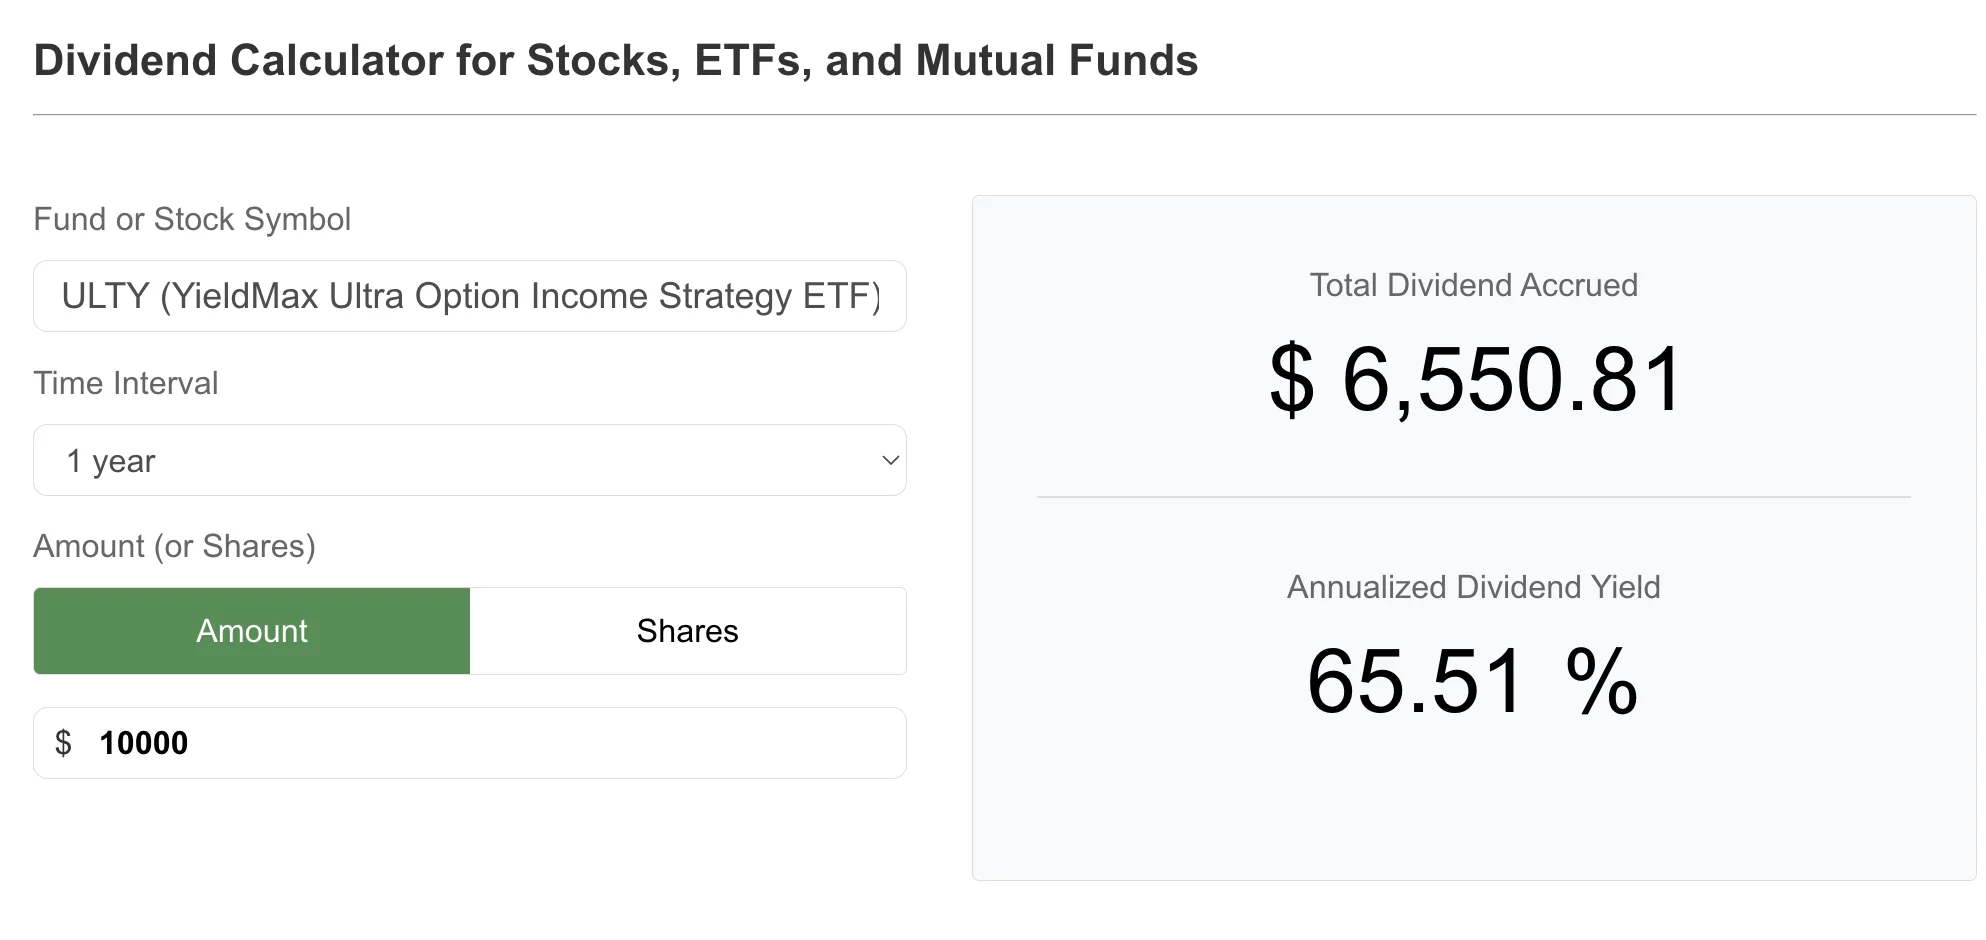
You can enter various Time Intervals. You also enter the amount or shares held at the beginning of the time interval. The calculator will then calculate the annualized dividend yield in that period. In the above, we can see ULTY has 65.51% of dividend yield in the past one year. Or you would have gotten $6,550 dividend distributed if you put down $10,000 one year ago.
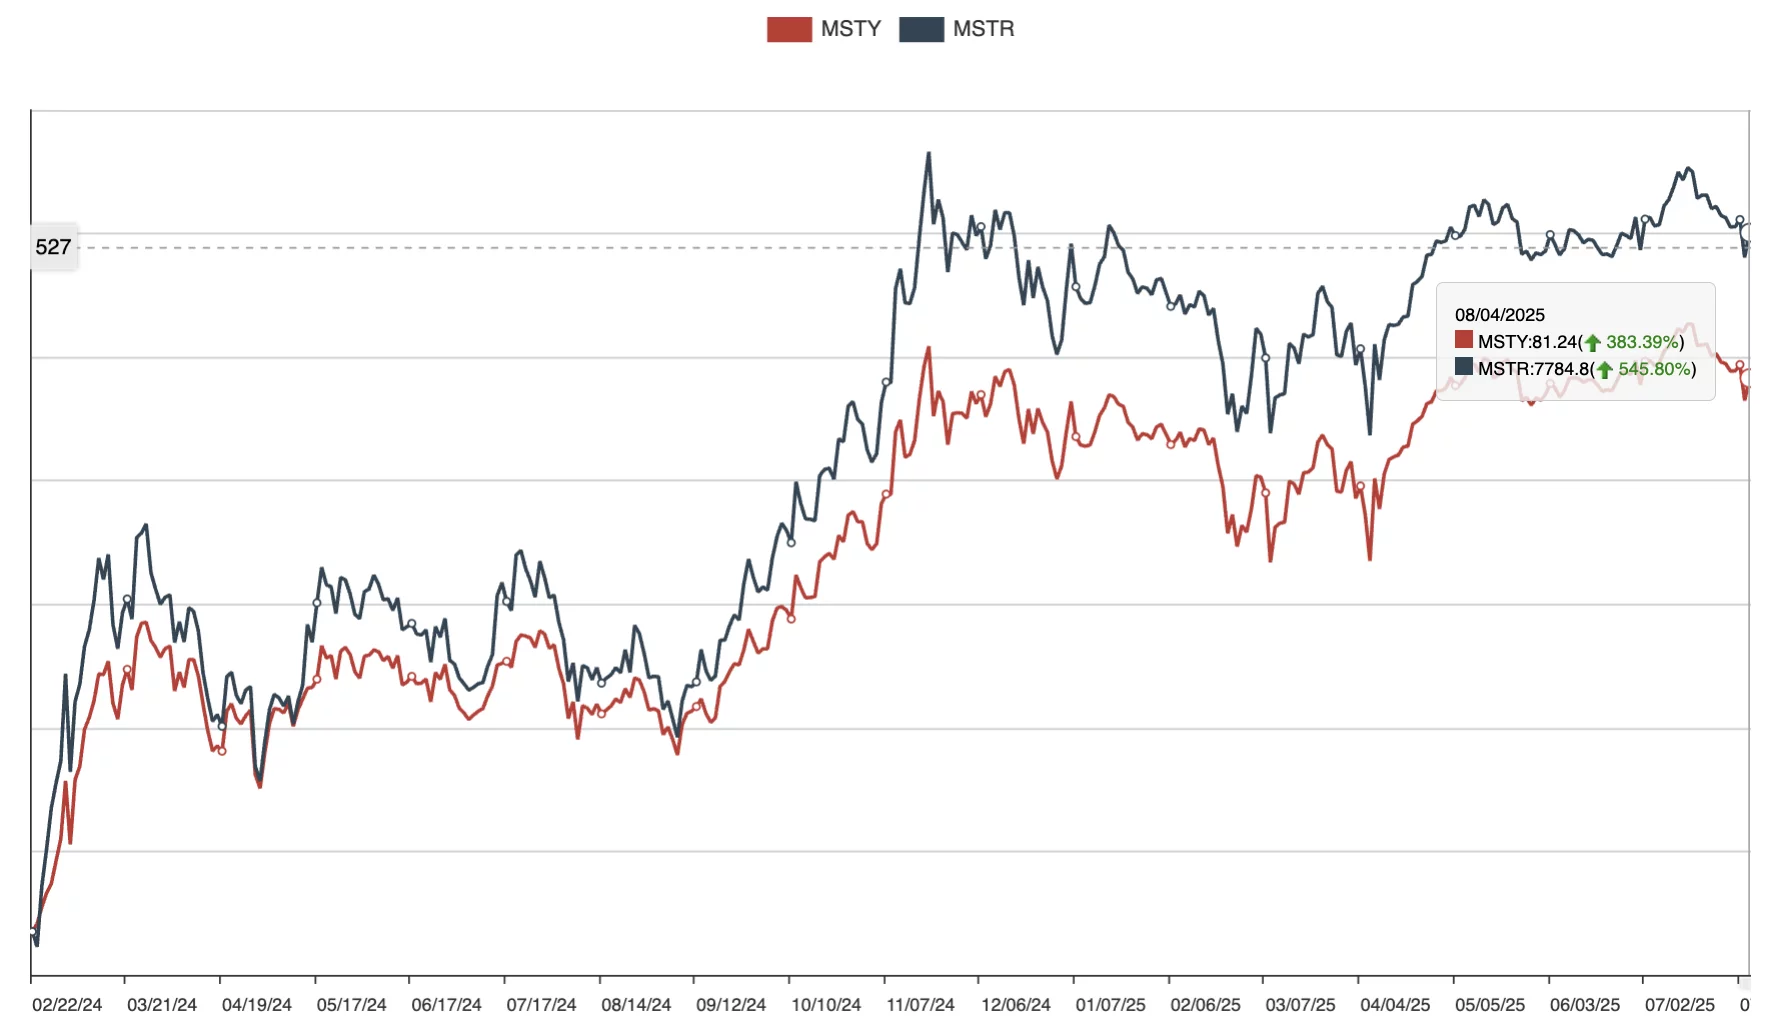
You can also visit MSTY fund page and scroll down to the dividend section to find the tab Dividend Calculator like in the following:

You might be surprised to see that $10,000 invested in MSTYon 2/24/2024 when MSTY was first available to trade resulted in $19,247 dividends! Of course, you wouldn’t be that surprised once you also know that MSTY’s total return since its inception on 2/24/2024 has grown to $513,252, compared with only $30,989! (use the Dollar Cost Average Calculator on the same fund page).
Take advantage of our dividend calculator, dollar cost average calculator, and retirement spending calculator on a fund page!
Market Overview
On the first day of August, stocks finally had encountered a meaningful correction. It’s a lot more healthy to have regular ups and downs than a parabolic non-stop rise!
The following table shows the major asset price returns and their trend scores, as of this Monday:
| Asset Class | 1 Weeks | 4 Weeks | 13 Weeks | 26 Weeks | 52 Weeks | Trend Score |
|---|---|---|---|---|---|---|
| US Stocks | -0.9% | 1.7% | 12.4% | 6.2% | 23.5% | 8.6% |
| Foreign Stocks | -0.7% | 0.6% | 7.1% | 15.7% | 22.7% | 9.1% |
| US REITs | -0.4% | 0.7% | 1.4% | 1.4% | 5.3% | 1.7% |
| Emerging Market Stocks | -0.9% | 1.2% | 8.3% | 13.8% | 22.0% | 8.9% |
| Bonds | 1.5% | 1.5% | 2.4% | 4.0% | 2.8% | 2.5% |
More detailed returns and trend scores can be found on MyPlanIQ.com Market Overview.
Try to Find Your Old Retirement Accounts?
Find Tools and Calculators That Provide Quick Help