 |
Vanguard ETF: |  |
7.4%* |
|
Diversified Core: | |
8.1%* |
|
Six Core Asset ETFs: | |
7.3%* |
Articles on ORCL
- Technology Companies Outshine Among Large Cap Growth Stocks
07/19/2011
Large technology companies such as those in Nasdaq 100 (QQQ) (COMP) have been doing exceptionally well in the past five years. They out performed large cap growth stocks. The following table shows the performance of large growth stock ETFs:
As of 7/15/2011
07/15/2011
Description Symbol 1 Yr 3 Yr 5 Yr Avg. Volume(K) 1 Yr Sharpe PowerShares QQQ QQQ 27.88% 10.04% 10.54% 52,975 177.47% Vanguard Growth ETF VUG 26.77% 5.52% 5.66% 373 200.76% iShares Russell 1000 Growth Index IWF 27.2% 5.95% 5.56% 2,268 204.37% iShares S&P 500 Growth Index IVW 25.99% 5.69% 4.89% 562 205.62% For information on more ETF performance, please refer to here. For various stock styles (such as large growth, mid cap, small value etc.), please refer to MyPlanIQ's stock style table.
Nasdaq 100 (QQQ) was the front runner in last 1, 3 and 5 year periods. These technology companies sidestepped the last financial crisis with pristine balance sheets and conservative growth plans, having learned a lesson from the technology bubble in 2001-2002. What is more interesting is that large U.S. technology companies have dramtically expanded their global reach and are now considered multi-national companies. In the past decade, they outsourced some of their development to emerging markets, gradually learned and developed local markets and now are in the perfect position to reap what they have sowed in these rapidly developing economies.
For example, Apple (AAPL) just released its latest quarter earnings report that stated its Chinese sales reached $3.8 billion, up almost sixfold from a year earlier. The company plans to open 30 stores in the September period, including in Hong Kong, broadening a retail chain that generated $3.5 billion in sales last quarter.
The following are the top holdings of QQQ, as of 7/18/2011
Name Symbol Weights (%) Apple (AAPL) 13.35% Microsoft (MSFT) 8.66% Oracle (ORCL) 6.16% Google (GOOG) 5.82% Intel (INTC) 4.56% Amazon (AMZN) 3.69% Qualcomm (QCOM) 3.57% Cisco (CSCO) 3.28% Amgen (AMGN) 1.96% Comcast (CMCSA) 1.93% In general, U.S. large growth companies are positioned well for the economic recovery. For a retirement portfolio, proper exposure into these high quality multi-national companies can be beneficial.
Symbols: COMP, QQQQ, AAPL, ORCL, MSFT, GOOG, INTC, CSCO, AMZN, QCOM, AMGN, CMSCA, ETFs
- High Quality Funds in Oracle 401K Plan Boost Portfolio Returns
06/13/2011
Retirement investing is a long term process. This report reviews Oracle Corporation 401(k) Savings and Investment Plan. We will discuss the investment choices and present the plan rating by MyPlanIQ. Current economic and market conditions are discussed in the context of the investment portfolios in the plan. We will then show how investors in Oracle Corporation 401(k) Savings and Investment Plan can achieve reasonable investment results using asset allocation strategies.
Plan Review and Rating
Oracle Corporation 401(k) Savings and Investment Plan consists of 30 funds. These funds enable participants to gain exposure to 4 major assets: US Equity, Foreign Equity, Emerging Market Equity, Fixed Income.
The plan has many high quality funds including Dodge & Cox stock (DODGX), Fidelity Contra (FCNTX), Lazard Emerign Markets (LZEMX), Fidelity Low Priced Stocks (FLPKX). Additionaly, Pimco's total return bond fund (PTTRX), managed by Bill Gross gives participants a solid choice in fixed income.
As of Jun 10, 2011, this plan investment choice is rated as above average based on MyPlanIQ Plan Rating methodology that measures the effectiveness of a plan's available investment funds. It has the following detailed ratings:
Diversification -- Rated as average (52%)
Fund Quality -- Rated as above average (75%)
Portfolio Building -- Rated as great (92%)
Overall Rating: above average (75%)Current Economic and Market Conditions
Last week marked the sixth week of losses in the U.S. stock market. Investors are now clearly in a risk off mode. Key observations include
- U.S. stock market index (Vanguard Total Stock Market Index (VTI)), for example, is now ranked below U.S. 7-10 long term treasury bonds (IEF) and just a notch above credit bond index (CFT) in our major trend table.
- For the time being, commodities (DBC) and Gold (GLD) are still holding first places, with international REITs (RWX) is still strong.
- On the fixed income side, long bonds (TLT) (LQD) are now trending higher while emerging market bonds (PCY) is still holding a higher place.
This shows investors' strong risk aversion but it is still not water shed flight to safety moment yet.
For more information on how these assets are ranked, please see here.
The following lists how major assets are ranked.
Major Asset Classes Trend
06/10/2011
Description Symbol 1 Week 4 Weeks 13 Weeks 26 Weeks 52 Weeks Trend Score US Stocks VTI -2.43% -5.02% -1.96% 4.63% 21.2% 3.28% International Developed Stks EFA -2.95% -2.44% -0.35% 3.57% 22.03% 3.97% Emerging Market Stks VWO -2.69% -0.43% 1.82% 3.41% 26.05% 5.63% Frontier Market Stks FRN 0.66% 1.19% 3.58% -5.35% 20.94% 4.21% US Equity REITs VNQ -4.25% -4.01% 1.18% 9.64% 20.52% 4.61% International REITs RWX -2.82% -0.55% 2.46% 6.52% 34.29% 7.98% Commodities DBC 0.1% 4.27% 2.68% 15.4% 37.95% 12.08% Gold GLD -0.65% 2.48% 7.97% 10.21% 24.36% 8.87% Total US Bonds BND 0.15% 1.01% 2.67% 4.0% 5.68% 2.7% International Treasury Bonds BWX -1.2% 1.93% 4.36% 10.12% 19.92% 7.03% Emerging Mkt Bonds PCY 0.18% 0.85% 4.25% 3.64% 12.83% 4.35% US Credit Bonds CFT 0.02% 0.37% 2.41% 4.69% 8.06% 3.11% US High Yield Bonds JNK -1.32% -2.13% -0.03% 6.5% 19.11% 4.43% Mortgage Back Bonds MBB -0.03% 0.78% 2.33% 3.48% 4.18% 2.15% Municipal Bonds MUB -0.51% 0.28% 4.31% 6.03% 2.98% 2.62% Intermediate Treasuries IEF 0.26% 2.14% 4.8% 5.55% 7.24% 4.0% Treasury Bills SHV -0.02% -0.04% 0.02% 0.07% 0.1% 0.03% Portfolio Discussions
The chart and table below show the historical performance of moderate model portfolios employing strategic and tactical asset allocation strategies. For comparison purpose, we also include the moderate model portfolios of a typical 4 asset SIB (Simpler Is Better) plan . This SIB plan has the following candidate index funds and their ETFs equivalent:
US Equity: SPY or VTI
Foreign Equity: EFA or VEU
Emerging Market Equity: EEM or VWO
Fixed Income: AGG or BND
Performance chart (as of Jun 10, 2011)Performance table (as of Jun 10, 2011)
Portfolio Name 1Yr AR 1Yr Sharpe 3Yr AR 3Yr Sharpe 5Yr AR 5Yr Sharpe Oracle Corporation 401(k) Savings and Investment Plan Tactical Asset Allocation Moderate 10% 121% 10% 109% 13% 121% Oracle Corporation 401(k) Savings and Investment Plan Strategic Asset Allocation Moderate 16% 202% 7% 47% 8% 60% Four Core Asset ETF (EM) Benchmark Tactical Asset Allocation Moderate 4% 44% 6% 53% 10% 69% Four Core Asset ETF (EM) Benchmark Strategic Asset Allocation Moderate 18% 151% 3% 12% 6% 26% From the above table, one can see that Oracle's plan does deliver extra returns over the simple four core asset ETF portfolios. It shows high quality funds can indeed add value.
To summarize, investors adopting Oracle Corporation 401(k) Savings and Investment Plan plan can achieve reasonable investment returns by adopting asset allocation strategies that are tailored to their risk profiles.
Symbols: ORCL, VTI, VEU, VWO, BND, FLPKX, DODGX, FCNKX, LZEMX, PTTRX
Exchange Tickers: (ORCL), (VTI), (VEU), (VWO), (BND), (VTIVX), (VFORX), (VTTHX), (VTHRX), (VTTVX), (VTWNX), (VTXVX), (VTENX), (VTOVX), (VTINX), (VFIFX), (FSIIX), (VIEIX), (VIIIX), (VBMPX), (FLPKX), (DODGX), (FGCKX), (FCNKX), (FWWFX), (DODFX), (ARTKX), (ARTVX), (LZEMX), (JMVAX), (TCMMX), (FBAKX), (PTTRX) - SmartMoney Magazine Best Idea Portfolio Compared with a Diversified ETF Portfolio
04/13/2011
SmartMoney magazine published its annual best stock ideas in the February issue titled Where to Invest in 2011. We look at a portfolio that consists of the 12 stocks suggested in the article and compare this with an ETF portfolio.
We construct the portfolio "P SmartMoney Magazine Where to Invest 2011 12 Stocks Since 2011" that had equal weights to each of 12 stocks on 12/31/2010. The following is the list of stocks recommended by SmartMoney Magazine and their weightings on 4/8/2011:
Asset Fund in this portfolio Price Percentage Asset1 LOW (Lowe's Companies Inc.) 26.82 6.33% Asset1 TJX (The TJX Companies, Inc.) 50.7 13.33% Asset1 YUM (Yum! Brands Inc.) 49.58 10.98% Asset1 CMCSA (Comcast Corporation) 24.68 6.35% Asset1 RSG (Republic Services) 29.91 7.08% Asset1 PEP (PepsiCo Inc) 65.73 7.36% Asset1 CSCO (Cisco Systems Inc) 17.65 4.57% Asset1 GOOG (Google Inc) 578.16 7.97% Asset1 ORCL (Oracle Corp.) 33.54 12.29% Asset1 UTX (United Technologies) 84.81 8.66% Asset1 MMM (3M Company) 93.22 7.79% Asset1 UPS (United Parcel Serv) 73.25 7.29% We further construct a portfolio P SmartMoney Magazine Where to Invest 2011 12 Stocks that was started on 1/2/2006.
Buying individual stocks and managing a portfolio with a dozen of stocks is not a small feat: one has to constantly monitor stocks in the portfolio and buy/sell them if it is necessary (such as a fundamental event for a company indicates this company is no longer satisfied with the criteria, or a stock becomes too expensive, or just simply because there is a better more compelling stock available, etc.). In fact, various studies have shown that most professional mutual funds can not even beat a stock index.
On the other hand, an investor can choose a simpler and safer portfolio strategy: asset allocation, especially tactical asset allocation strategy by investing in ETFs or mutual funds. In the case of a tactical asset allocation strategy, it dynamically adjusts the weights of assets represented by ETFs. For example, MyPlanIQ's Tactical Asset Allocation (TAA) strategy adjusts exposure to various assets based on price momentum as well as risk parameters (such as volatility and drawdown).
The following is the list of six assets that represent the major markets:
Asset Class Ticker Name LARGE BLEND VTI Vanguard Total Stock Market ETF Foreign Large Blend VEU Vanguard FTSE All-World ex-US ETF DIVERSIFIED EMERGING MKTS VWO Vanguard Emerging Markets Stock ETF REAL ESTATE VNQ Vanguard REIT Index ETF COMMODITIES BROAD BASKET DBC PowerShares DB Commodity Idx Trking Fund Intermediate-Term Bond BND Vanguard Total Bond Market ETF Other than the fixed income fund (BND), all other five assets are considered as risk assets.
The following compares the performance between P SmartMoney Magazine Where to Invest 2011 12 Stocks and a portfolio with risk profile 0 (i.e. can have 100% invested in the risk assets) Six Core Asset ETF Benchmark TAA Risk Profile 0.
Portfolio Performance Comparison
Portfolio Name 1Yr AR 1Yr Sharpe 3Yr AR 3Yr Sharpe 5Yr AR 5Yr Sharpe P SmartMoney Magazine Where to Invest 2011 12 Stocks 13% 75% 8% 28% 6% 20% Six Core Asset ETF Benchmark TAA Risk Profile 0 19% 91% 16% 81% 20% 95% The following chart illustrates the performance comparison:
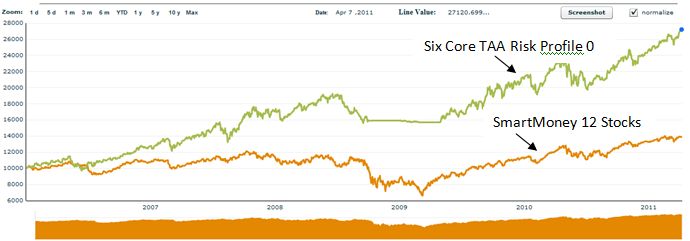
We make the following observations:
- The SmartMoney 12 stocks were recommended in Februrary 2011. The portfolio P SmartMoney Magazine Where to Invest 2011 12 Stocks was started on 1/2/2006. It is not exactly a fair comparison: most likely, these stocks were recommended based on their past performance and thus, the portfolio's performance could be more over-estimated.
- It is not exactly fair to compare an U.S. stock portfolio with a diversified portfolio that can invest in foreign stocks, emerging market stocks, REITs and even commodities. One reason behind this is that for most individual investors, they tend to focus on only domestic stocks. We will have a follow up article to compare this portfolio with an U.S. stock ETF portfolio.
- The above illustrates that there are simpler and better way to invest other than picking individual stocks. This is applicable to most average investors. Nevertheless, we acknowledge that few investors do have the possibility to achieve high returns with their systematic method and great insights. It is just for many average investors, they do not have time, means and discipline to do so. This is reflected that majority of professional investors under perform against a stock index such as S&P 500 (SPY).
Symbols: VTI, VEU, VNQ, VWO, DBC, BND, LOW, TJX, YUM, CMCSA, RSG, PEP, CSCO, GOOG, ORCL, UTX, MMM, UPS, EEM
- Oracle Corporation 401(k) Savings and Investment Plan Report On 06/13/2011
06/13/2011
Retirement investing is a long term process. This report reviews Oracle Corporation 401(k) Savings and Investment Plan. We will discuss the investment choices and present the plan rating by MyPlanIQ. Current economic and market conditions are discussed in the context of the investment portfolios in the plan. We will then show how investors in Oracle Corporation 401(k) Savings and Investment Plan can achieve reasonable investment results using asset allocation strategies.
Plan Review and Rating
Oracle Corporation 401(k) Savings and Investment Plan consists of 30 funds. These funds enable participants to gain exposure to 4 major assets: US Equity, Foreign Equity, Emerging Market Equity, Fixed Income.
The plan has many high quality funds including Dodge & Cox stock (DODGX), Fidelity Contra (FCNTX), Lazard Emerign Markets (LZEMX), Fidelity Low Priced Stocks (FLPKX). Additionaly, Pimco's total return bond fund (PTTRX), managed by Bill Gross gives participants a solid choice in fixed income.
As of Jun 10, 2011, this plan investment choice is rated as above average based on MyPlanIQ Plan Rating methodology that measures the effectiveness of a plan's available investment funds. It has the following detailed ratings:
Diversification -- Rated as average (52%)
Fund Quality -- Rated as above average (75%)
Portfolio Building -- Rated as great (92%)
Overall Rating: above average (75%)Current Economic and Market Conditions
Last week marked the sixth week of losses in the U.S. stock market. Investors are now clearly in a risk off mode. Key observations include
- U.S. stock market index (Vanguard Total Stock Market Index (VTI)), for example, is now ranked below U.S. 7-10 long term treasury bonds (IEF) and just a notch above credit bond index (CFT) in our major trend table.
- For the time being, commodities (DBC) and Gold (GLD) are still holding first places, with international REITs (RWX) is still strong.
- On the fixed income side, long bonds (TLT) (LQD) are now trending higher while emerging market bonds (PCY) is still holding a higher place.
This shows investors' strong risk aversion but it is still not water shed flight to safety moment yet.
For more information on how these assets are ranked, please see here.
The following lists how major assets are ranked.
Major Asset Classes Trend
06/10/2011
Description Symbol 1 Week 4 Weeks 13 Weeks 26 Weeks 52 Weeks Trend Score US Stocks VTI -2.43% -5.02% -1.96% 4.63% 21.2% 3.28% International Developed Stks EFA -2.95% -2.44% -0.35% 3.57% 22.03% 3.97% Emerging Market Stks VWO -2.69% -0.43% 1.82% 3.41% 26.05% 5.63% Frontier Market Stks FRN 0.66% 1.19% 3.58% -5.35% 20.94% 4.21% US Equity REITs VNQ -4.25% -4.01% 1.18% 9.64% 20.52% 4.61% International REITs RWX -2.82% -0.55% 2.46% 6.52% 34.29% 7.98% Commodities DBC 0.1% 4.27% 2.68% 15.4% 37.95% 12.08% Gold GLD -0.65% 2.48% 7.97% 10.21% 24.36% 8.87% Total US Bonds BND 0.15% 1.01% 2.67% 4.0% 5.68% 2.7% International Treasury Bonds BWX -1.2% 1.93% 4.36% 10.12% 19.92% 7.03% Emerging Mkt Bonds PCY 0.18% 0.85% 4.25% 3.64% 12.83% 4.35% US Credit Bonds CFT 0.02% 0.37% 2.41% 4.69% 8.06% 3.11% US High Yield Bonds JNK -1.32% -2.13% -0.03% 6.5% 19.11% 4.43% Mortgage Back Bonds MBB -0.03% 0.78% 2.33% 3.48% 4.18% 2.15% Municipal Bonds MUB -0.51% 0.28% 4.31% 6.03% 2.98% 2.62% Intermediate Treasuries IEF 0.26% 2.14% 4.8% 5.55% 7.24% 4.0% Treasury Bills SHV -0.02% -0.04% 0.02% 0.07% 0.1% 0.03% Portfolio Discussions
The chart and table below show the historical performance of moderate model portfolios employing strategic and tactical asset allocation strategies. For comparison purpose, we also include the moderate model portfolios of a typical 4 asset SIB (Simpler Is Better) plan . This SIB plan has the following candidate index funds and their ETFs equivalent:
US Equity: SPY or VTI
Foreign Equity: EFA or VEU
Emerging Market Equity: EEM or VWO
Fixed Income: AGG or BND
Performance chart (as of Jun 10, 2011)Performance table (as of Jun 10, 2011)
Portfolio Name 1Yr AR 1Yr Sharpe 3Yr AR 3Yr Sharpe 5Yr AR 5Yr Sharpe Oracle Corporation 401(k) Savings and Investment Plan Tactical Asset Allocation Moderate 10% 121% 10% 109% 13% 121% Oracle Corporation 401(k) Savings and Investment Plan Strategic Asset Allocation Moderate 16% 202% 7% 47% 8% 60% Four Core Asset ETF (EM) Benchmark Tactical Asset Allocation Moderate 4% 44% 6% 53% 10% 69% Four Core Asset ETF (EM) Benchmark Strategic Asset Allocation Moderate 18% 151% 3% 12% 6% 26% From the above table, one can see that Oracle's plan does deliver extra returns over the simple four core asset ETF portfolios. It shows high quality funds can indeed add value.
To summarize, investors adopting Oracle Corporation 401(k) Savings and Investment Plan plan can achieve reasonable investment returns by adopting asset allocation strategies that are tailored to their risk profiles.
Symbols: ORCL, VTI, VEU, VWO, BND, FLPKX, DODGX, FCNKX,LZEMX, PTTRX
Exchange Tickers: (ORCL), (VTI), (VEU), (VWO), (BND), (VTIVX), (VFORX), (VTTHX), (VTHRX), (VTTVX), (VTWNX), (VTXVX), (VTENX), (VTOVX), (VTINX), (VFIFX), (FSIIX), (VIEIX), (VIIIX), (VBMPX), (FLPKX), (DODGX), (FGCKX), (FCNKX), (FWWFX), (DODFX), (ARTKX), (ARTVX), (LZEMX), (JMVAX), (TCMMX), (FBAKX), (PTTRX)