 |
Vanguard ETF: |  |
7.4%* |
|
Diversified Core: | |
8.1%* |
|
Six Core Asset ETFs: | |
7.3%* |
Articles on IJK
- How Does Your Garden Grow?
09/16/2010
Jim Lowell edits MarketWatch's ETF Trader, an investment letter employing a momentum-based exchange-traded-fund strategy for long-term investors. Large/small stocks, proposed his Sower's Growth Portfolio. This is a diversified portfolio of exchange-traded funds. The view is that a growing economy tends to create a growing portfolio.This portfolio is heavily equity and US focused. It is a diversified portfolio of exchange-traded funds including Big-caps ETF (DIAIYYONEQ PWC), Midcaps ETF(MDY), Small-caps ETF (IWM) and foreign ETF(EFA).The fund selection for testing the strategy is listed below with the ETF alternatives:
US Equities- 10% in Diamonds Trust DIA (SPY)
- 15% in iShares DJ U.S. Total Market IYY (VTI, DVY)
- 7.5% in Fidelity NASDAQ Composite ONEQ (QCLN, QABA)
- 7.5% in Power Shares Dynamic Market PWC (VTV, VUG)
- 10% in iShares Russell 2000 IWM (IWO, IWW)
- 15% in Mid Cap SPDR Trust MDY (IJJ, VO)
International Equities
- 25% in iShares MSCI International EAFE EFA (VEA, EFV)
- 10% in iShares MSCI Emerging Markets EEM (VWO)
Things to note about the portfolio:- 100% in equities is an aggressive portfolio
- 65% in US equities is high in today’s market environment
- There is no real estate (IYR, VNQ, ICF) or fixed income which would likely result in improved performance today
- With three asset classes (US, international and emerging markets), this can be mapped against a 3 asset class SIB
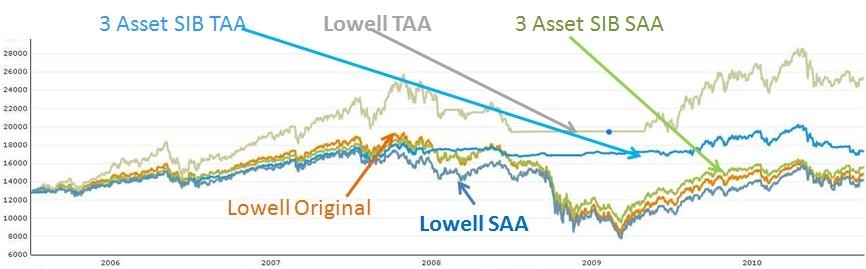
We will make a comparison of the performance of this portfolio against strategic asset allocation (equally spread assets), tactical asset allocation and against 3 asset class SIB portfolios we discussed in a previous article,The 3 asset class SIB breakdown- Large Blend VTSMX (ETF VTI)
- Foreign Large Blend VGTSX (ETF VEU)
- Intermediate-Term Bond VBMFX (ETF BND)
There are a number things to note about the comparisons:- The Lowell SAA and TAA were driven with a 100% in equities -- the TAA strategy will move to fixed income (cash) should the momentum drive it that way, the SAA strategy will not
- The 3 asset SIBs are using an aggressive model portfolio that still includes some fixed income
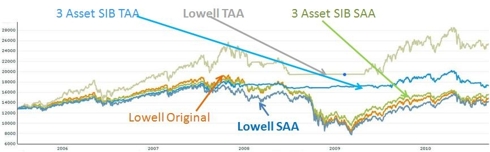
Summary Returns of Lowell's Portfolios Annual Returns 1 year 3 Year 5 Year Lowell Original 9.04 -5.38 2.25 Lowell SAA 13.14 -13.6 1.83 Lowell TAA 6.23 5.26 13.26 3 SIB SAA 7.03 -3.39 3.29 3 SIB TAA -4.23 0.63 5.76
The results are shown above. There are a number of interesting things to note :- The choice of funds, even if diversification enables reasonable returns
- Before the downturn, the original portfolio was outperforming everything except the dynamic allocation of the original strategy
- The strategy falls foul of the 2008/2009 downturn and tracks pretty closely with any buy and hold strategy
- The three asset SIBs have a fixed income fund that enables slightly better performance in choppier market conditions
- The Lowell choice of funds allows the tactical asset allocation strategy to outperform the three asset class SIB with TAA
- The 2008/2009 downturn shows the benefits of a tactical asset allocation – even if it means moving equities to cash
Takeaways:- The Sower’s growth portfolio is a low maintenance portfolio that is heavily weighted towards US equities. In the long term, there is still confidence in the US economy but following this portfolio and strategy will give you some heartache
- This portfolio was created when the sort of downturn we experienced in 2007/2008 was not envisioned -- it's hard to imagine that this portfolio would still be recommended today
- Migrating to a dynamic strategy with the same funds provides much higher returns. Given a dynamic strategy, it would make sense to add some fixed income such as AGG, BND, SHY, CSJ rather than just cash
- Conventional tactical asset allocation with the right number of asset classes (at least five) still provides the best performance
- ETF’s give you a good degree of choice a good vehicle for any portfolio and with increasing track record, it’s possible to demonstrate good historical performance
labels:investment,
Symbols:DIA,IYY,VTI,DVY,ONEQ,QCLN,QABA,PWC,VTV,VUG,IWM,IWO,IWW,MDY,IJJ,IJK,VO,AGG,BND,SHY,SPY,VBK,IJS,IWP,IWS,VEA,EFG,EFV,VWO,VEU,ETF,Asset,Allocation,Tactical,Asset,Allocation,
- Aflac Incorporated 401(k) Savings and Profit Sharing Plan Report On 12/03/2010
12/03/2010
This report reviews Aflac Incorporated 401(k) Savings and Profit Sharing Plan plan. We will discuss the investment choices and present the plan rating by MyPlanIQ. Current economic and market conditions are discussed in the context of the investment portfolios in the plan. We will then show how participants in Aflac Incorporated 401(k) Savings and Profit Sharing Plan can achieve reasonable investment results using asset allocation strategies.
Plan Review and Rating
AFLAC Inc (Ticker:AFL) has the "Aflac Incorporated 401(k) Savings and Profit Sharing Plan".
Aflac Incorporated 401(k) Savings and Profit Sharing Plan's 401K plan consists of 11 funds. These funds enable participants to gain exposure to 3 major assets: US Equity, Foreign Equity, Fixed Income. The list of minor asset classes covered:
Foreign Large Blend: EFA, VEU, GWL, PFA
Intermediate-term Bond: AGG, CIU, BIV, BND
Large Blend: IVV, IYY, IWV, VTI, VV, SPY, DLN, RSP, SCHX
Large Growth: IVW, IWZ, JKE, VUG, ELG, QQQQ, RPG, SCHG
Large Value: IVE, IWW, JKF, VTV, ELV, PWV, RPV, SCHV
Mid-cap Growth: IJK, IWP, VOT, EMG, PWJ, RFG, UKW
Moderate Allocation: AOM
Small Growth: IJT, IWO, JKK, VBK, DSG, PWT, RZG, UKK
As of Dec 2, 2010, this plan investment choice is rated as based on MyPlanIQ Plan Rating methodology that measures the effectiveness of a plan's available investment funds. It has the following detailed ratings:
Diversification -- Rated as (35%)
Fund Quality -- Rated as (33%)
Portfolio Building -- Rated as (36%)
Overall Rating: (35%)Current Economic and Market Conditions
We have experienced an uncertain 2010: plenty of worries on whether the US economy will climb out of the great recession and recover.
- The Federal Reserve embarked on Quantitative Easing II (QE2) to stimulate the economy.
- The housing market is still at its low but largely stabilized.
- The unemployment rate is stuck at 9%.
Americans continue to face an uncertain future, given (among others) the high unemployment rate, large federal and local government debts and global trade imbalance. With such an economic backdrop, the stock and debt markets are going to be volatile. Despite this, markets have been resilient and appear positioned to rebound.
In this market it is even more critical to properly diversify and respond market changes. MyPlanIQ offers two asset allocation strategies: strategic and tactical asset allocation strategies ( SAA and TAA for participants in Aflac Incorporated 401(k) Savings and Profit Sharing Plan).
Strategic Asset Allocation is based on well known modern portfolio theory and its key features include: diversification, proper fund selection and periodically re-balancing.
Tactical Asset Allocation works on a diversified array of assets provided by funds in a plan and adjusts asset mixes based on market conditions such as asset price momentum utilized by TAA.
Portfolio Discussions
The chart and table below show the historical performance of moderate model portfolios employing strategic and tactical asset allocation strategies. For comparison purpose, we also include the moderate model portfolios of a typical 3 asset SIB (Simpler Is Better) plan . This SIB plan has the following candidate index funds and their ETFs equivalent:
US Equity: (SPY or VTI)
Foreign Equity: (EFA or VEU)
Fixed Income: (AGG or BND)
Performance chart (as of Dec 2, 2010)Performance table (as of Dec 2, 2010)
Portfolio Name 1Yr AR 1Yr Sharpe 3Yr AR 3Yr Sharpe 5Yr AR 5Yr Sharpe Aflac Incorporated 401(k) Savings and Profit Sharing Plan Tactical Asset Allocation Moderate 4% 34% 5% 64% 8% 81% Aflac Incorporated 401(k) Savings and Profit Sharing Plan Strategic Asset Allocation Moderate 10% 100% 2% 8% 6% 31% Three Core Asset ETF Index Funds Tactical Asset Allocation Moderate -4% -35% 1% 9% 4% 27% Three Core Asset ETF Index Funds Strategic Asset Allocation Moderate 9% 60% -0% -3% 4% 13% Currently, asset classes in US Equity (SPY,VTI), Foreign Equity (EFA,VEU) and Fixed Income (AGG,BND) are doing relatively well. These asset classes are available to Aflac Incorporated 401(k) Savings and Profit Sharing Plan participants.
To summarize, Aflac Incorporated 401(k) Savings and Profit Sharing Plan plan participants can achieve reasonable investment returns by adopting asset allocation strategies that are tailored to their risk profiles.
Symbols: AFL , SPY , VTI , EFA , VEU , AGG , BND , AOM , CIU , BIV , GWL , PFA , IVE , IWW , JKF , VTV , ELV , PWV , RPV , SCHV , IVV , IYY , IWV , VV , DLN , RSP , SCHX , IVW , IWZ , JKE , VUG , ELG , QQQQ , RPG , SCHG , IJK , IWP , VOT , EMG , PWJ , RFG , UKW , IJT , IWO , JKK , VBK , DSG , PWT , RZG , UKK
- Apache Design Solutions 401K Report On 12/03/2010
12/03/2010
- ALLEGHENY ENERGY EMPLOYEE STOCK OWNERSHIP AND SAVINGS PLAN Report On 12/03/2010
12/03/2010
- BRISTOL-MYERS SQUIBB COMPANY SAVINGS AND INVESTMENT PROGRAM Report On 12/03/2010
12/03/2010
- Peabody Investments Corp.Employee Retirement Account Report On 12/03/2010
12/03/2010
- Capital Accumulation Plan of The Chubb Corporation Report On 12/03/2010
12/03/2010
- Danaher Corporation Subsidiaries Retirement and Savings Plan Report On 12/03/2010
12/03/2010
- Danaher Corporation Subsidiaries Savings Plan Report On 12/03/2010
12/03/2010
- EQT CORPORATION SAVINGS AND PROTECTION PLAN Report On 12/03/2010
12/03/2010
- TD Ameritrade Commission Free ETFs Report On 12/07/2010
12/07/2010
- Sprint Nextel 401K Plan Report On 03/21/2011
03/21/2011