 |
Vanguard ETF: |  |
7.4%* |
|
Diversified Core: | |
8.1%* |
|
Six Core Asset ETFs: | |
7.3%* |
Articles on PHB
- Appetite for US High Yield Bonds Remains High as Yields Tighten
05/11/2011
High yield bond ETFs concentrate on lower quality corporate bonds, which are considered riskier than higher-quality or more established companies. Because of this higher level of risk, high-yield bonds, also known as junk bonds, offer higher yields to investors. US high yield bond ETFs invest at least 65% of capital in binds that are not rated or are rated by S&P or Moody's at or below BB (considered speculative). Because of high returns and the potential for diversification across many markets, regions, and industries, high yield bonds are a major part of many investment strategies.
Trend score is the average of 1,4,13,26 and 52 week total returns (including dividend reinvested).Assets Class Symbols 05/06
Trend
Score04/29
Trend
ScoreDirection International Inflation Protected WIP 6.74% 9.22% v High Yield JNK 5.54% 5.68% v International Treasury BWX 5.1% 6.82% v Long Term Credit LQD 3.48% 2.87% ^ Emerging Mkt Bonds PCY 3.48% 2.21% ^ 20+ Year Treasury TLT 3.38% 1.63% ^ Inflation Protected TIP 3.09% 3.27% v 10-20Year Treasury TLH 2.88% 1.73% ^ Intermediate Term Credit CIU 2.43% 2.06% ^ Intermediate Treasury IEF 2.39% 1.65% ^ US Total Bond BND 2.1% 1.77% ^ MBS Bond MBB 1.92% 1.83% ^ California Muni CMF 1.74% 1.99% v National Muni MUB 1.57% 1.24% ^ Short Term Credit CSJ 1.0% 1.09% v New York Muni NYF 0.64% 0.51% ^ Short Term Treasury SHY 0.55% 0.53% ^ Treasury Bills SHV 0.08% 0.07% ^
You can get a no cost widget for any of these tables which will automatically update weekly.At the end of last week (5/6/2011), high yield bond ETFs, represented by the SPDR Barclays Capital High Yield (JNK), stood among the top of the Fixed Income Return Table. Yields in the sector have declined as risk premiums have tightend on stronger performance by companies with lower credit ratings. While returns on corporate bonds have declined slightly in recent periods, ETFs that track the market have continually offered strong returns relative to other fixed income securities.U.S. High Yield Bonds
05/06/2011Description Symbol 1 Yr 3 Yr 5 Yr Avg. Volume(K) 1 Yr Sharpe iShares iBoxx $ High Yield Corp HYG 17.67% 7.03% NA 1,247 270.24% SPDR Barclays Capital High Yield JNK 20.83% 8.41% NA 2,972 279.79% PowerShares Fundamental High Yield PHB 19.2% 0.79% NA 302 318.25% Among US High Yield Bond ETFs, the top performers include the SPDR Barclays Capital High Yield (JNK), the Powershares Fundamental High Yield ETF (PHB), and the iShares iBoxx $ High Yield Corporate ETF (HYG) returning 20.83%, 19.20%, 17.67% respectively in the past year.With the highest one-year return and the highest trading volume, the SPDR Barclays Capital High Yield ETF remains a srtong investment option. The ETF is well diversified, with no single bond comprising more than 4% of total assets and the top 10% of assets making up only 22.58% of the total.Going forward, yields on high yield corporate debt should continue to tighten as long as companies continue to generate strong performance. Still, high yield corporate bond ETFs should continue to offer attractive returns relative to other fixed income assets.Corporate bonds are an important component of diversified bond portfolios, as they offer greater returns and risks than government bonds. Due to their high level of interest paid, generally in the form of monthly distributions, corporate bond ETFs may be especially suitable for individuals approaching or already in retirement. As with any investment, it is important to make sure the risk and return levels match up with your personal investment goals.Symbols: AGG, BND, SHV, SHY, IEF, TLH, TLT, TIP, WIP, HYG, JNK, PHB, CSJ, CIU, LQD, BWX, CMF, NYF, MUB, MBB, PCY, EMB
Tickers: (NYSE: AGG), (NYSE: BND), (NYSE: SHV), (NYSE: SHY), (NYSE: IEF), (NYSE: TLH), (NYSE: TLT), (NYSE: TIP), (NYSE: WIP), (NYSE: HYG), (NYSE: JNK), (NYSE: PHB), (NYSE: CSJ), (NYSE: CIU), (NYSE: LQD), (NYSE: BWX), (NYSE: CMF), (NYSE: NYF), (NYSE: MUB), (NYSE: MBB), (NYSE: PCY), (NYSE: EMB)Disclosure:
MyPlanIQ does not have any business relationship with the company or companies mentioned in this article. It does not set up their retirement plans. The performance data of portfolios mentioned above are obtained through historical simulation and are hypothetical. - JNK Beats WIP At the Top of The Fixed Income Table
05/10/2011
In order to reach your financial objectives, you must diversify. There are a range of investment alternatives that vary greatly in the degree and type of risk and potential return. The key to developing a sound portfolio is to strike the right balance between potential reward and risk, based on your financial objectives, financial situation and investment style.
Fixed Income refers to assets that provide their owners with a fixed stream of income. Fixed income assets can be broken down into five sub-classes:
- Government-issued securities
- Corporate-issued securities
- Inflation-protected securities (IPS)
- Mortgage-backed securities (MBS)
- Asset-backed securities (ABS)
An enormous amount of innovation continues within the world of fixed income. For the retail investor, IPS, MBS, and ABS are all relatively new additions. The U.S. leads the world in the range and depth of fixed-income offerings--particularly with MBS and ABS. Other countries are developing their MBS and ABS markets.
Although the fixed income stream ETFs provide the best hedge against equity volatility, the returns are not high as equity and other assets. WIP, JNK & BWX are the best performers in terms of returns but the last week showed a decline.
There is a mixed trend within the fixed asset type ETFs but overall more sub-classes are up than down. We are expecting a shift in ETF’s towards international fixed income as the dollar weakens and interest rates are raised overseas
WIP fund total Net assets value is 1.362 billion with a one year return of 16.95% and a three year return is of 4.01%. The gross expense ratio is 0.50%. The total sector allocation is broken down into the following composition: Treasury 99.83% & Cash 0.16%.
JNK fund total Net assets value is 7.3 billion with a one year return of 12.82% and a three year return is of 8.21%. The gross expense ratio is 0.40% for the sector allocations please see the graph below:

Although the one year returns of WIP i.e. 16.95% are greater than JNK i.e. 12.82%, we prefer the longevity from JNK i.e. 8.21% within the 3 years double the time of WIP return and it is performing well in the short term too.
We track asset class movement and you can see here the fixed income table which is updated weekly.
Assets Class
Symbols
05/06
Trend
Score04/29
Trend
ScoreDirection
International Inflation Protected
WIP
6.74%
9.22%
v
High Yield
JNK
5.54%
5.68%
v
International Treasury
BWX
5.1%
6.82%
v
Long Term Credit
LQD
3.48%
2.87%
^
Emerging Mkt Bonds
PCY
3.48%
2.21%
^
20+ Year Treasury
TLT
3.38%
1.63%
^
Inflation Protected
TIP
3.09%
3.27%
v
10-20Year Treasury
TLH
2.88%
1.73%
^
Intermediate Term Credit
CIU
2.43%
2.06%
^
Intermediate Treasury
IEF
2.39%
1.65%
^
US Total Bond
BND
2.1%
1.77%
^
MBS Bond
MBB
1.92%
1.83%
^
California Muni
CMF
1.74%
1.99%
v
National Muni
MUB
1.57%
1.24%
^
Short Term Credit
CSJ
1.0%
1.09%
v
New York Muni
NYF
0.64%
0.51%
^
Short Term Treasury
SHY
0.55%
0.53%
^
Treasury Bills
SHV
0.08%
0.07%
^
Trend score is the average of 1,4,13,26 and 52 week total returns (including dividend reinvested).
You can get a no cost widget for any of these tables which will automatically update weekly.If you are planning to shift part of your portfolio into fixed-income investments to help manage risk, you may also want to consider "laddering" these securities. This means you spread the total dollar amount of your investment among fixed-income securities with different maturities.
Symbols: AGG, BND, SHV, SHY, IEF, TLH, TLT, TIP, WIP, HYG, JNK, PHB, CSJ, CIU, LQD, BWX, CMF, NYF, MUB, MBB, PCY, EMB
Disclosure:
MyPlanIQ does not have any business relationship with the company or companies mentioned in this article. It does not set up their retirement plans. The performance data of portfolios mentioned above are obtained through historical simulation and are hypothetical.
- UNK -- Clear Leader in High Yield Bonds
05/03/2011
Bonds are one of the major fundamentals of any investment portfolio. Due to the recent global crisis bonds have been under pressure and finding the right mix of fixed income is a key component to a successful portfolio. Bonds are debt securities issued by organizations to raise capital for various purposes. The bond holder lends money to the entity that issues it, in return the lender (the issuer) agrees to pay interest and to return the face value (principal) when the bond matures or at a specified date in the future known (maturity date or call date).
High-yield bonds are issued by organizations that do not qualify for “investment-grade” ratings by one of the leading credit rating agencies—Moody’s Investors Service, Standard & Poor’s Ratings Services and Fitch Ratings. Since the high yield bonds do not qualify for the investment grade rating, high yield bonds interest rates are kept high than to induce the investor to invest.
Please find below the graph of returns of US high yield bonds.
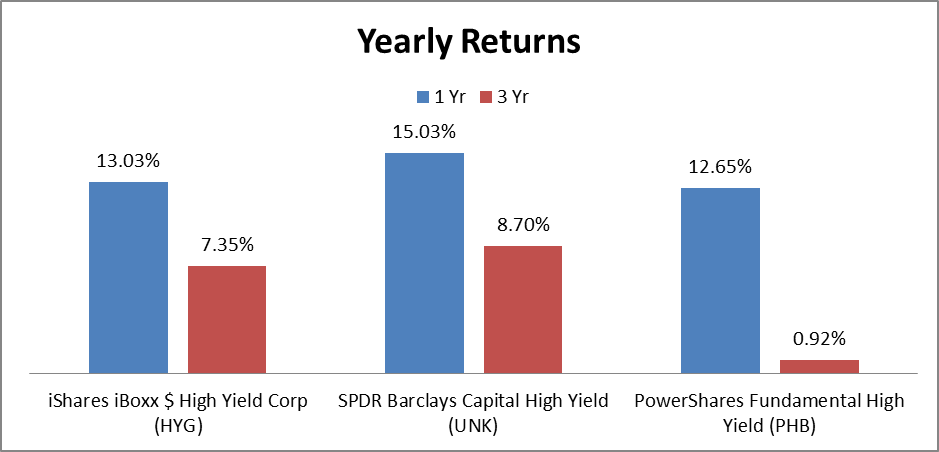
The graph clearly shows the UNK is the winner with 8.70% returns in the three years. The runner up is HYG. The one year returns are also very good of both the above mentioned ETF’s. Please find below the graph of volumes.
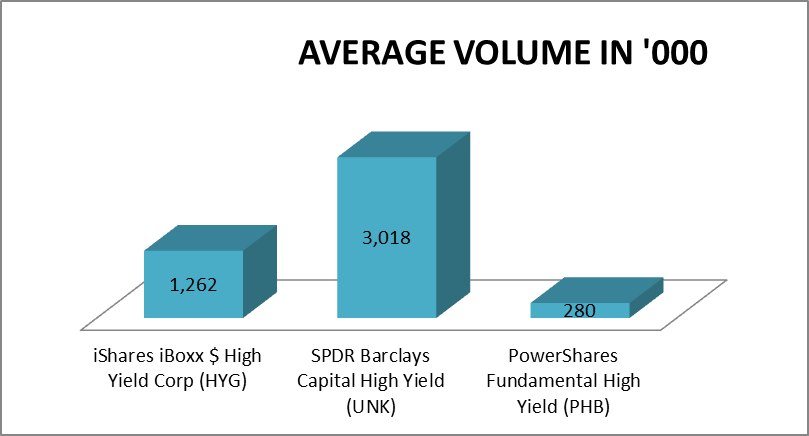
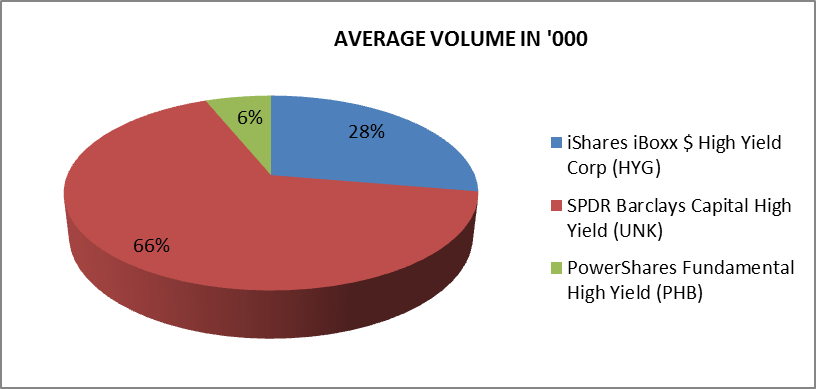 UNK represents 66% of the average market volumes making it the leader in terms of yields and volumes in this segment. The higher returns are in line with the characteristics of High yield bond. All the above mentioned bonds one year returns are above 10% making it a good streams of fixed income.
High-yield bonds do not correlate exactly with either investment-grade bonds or stocks. Because their yields are higher than investment-grade bonds, they're less vulnerable to interest rate shifts, especially at lower levels of credit
The high yield bond has its own risk as they are below the investment grade credit rating. Investors must consider higher volatility and the risk of default. Default rates are around 2% (as of Aug 2005), which is near historic lows.
The high yield bond has its pros and cons but careful deployment of high yield bonds can provide reasonable returns and an effective hedge in the event of the volatility.
MyPlanIQ does not have any business relationship with the company or companies mentioned in this article. It does not set up their retirement plans. The performance data of portfolios mentioned above are obtained through historical simulation and are hypothetical.
- Schwab Mutual Funds Beat out ETFs
04/06/2011
l
Retirement investing is a "hair on fire" problem -- especially for baby boomers for whom retirement is a near and present danger. There is a real lack of consistent, unbiased information that a retiree can use to help improve risk adjusted returns. Blogger Jenny Hollingworth has been teaching herself about investing and has come to the point where she is going to choose a plan and make her first investments.
In her recent post New Steps she sorted through a list of alternatives and chose the Schwab OneSource Select List Funds.
The reason for her choice was:
- The highest possible rating for each plan is 5 stars. So I bypassed anything that didn’t have 5 (because really, why go for less?)
- Picked out a name I knew: Schwab. Specifically: Schwab OneSource Select List Funds. I selected it.
- This is an application to Charles Schwab's OneSource Select List mutual funds. These funds are No Load and No Transaction Fee (NTF) mutual funds. Based on Schwab's policy, the no load NTF funds have 90 days redemption fee period. As of 1/1/2010, there are total 140 OneSource Select List funds available from Schwab.
We are going to review the Schwab OneSource Select List Funds to see whether she chose a good plan. The plan consists of 137 funds. These funds enable participants to gain exposure to 6 major assets: US Equity, Commodity, Foreign Equity, REITs, Emerging Market Equity, Fixed Income.
Asset Class Ticker Name LARGE VALUE AAGPX American Beacon Lg Cap Value Inv Foreign Large Value AAIPX American Beacon Intl Equity Inv Retirement Income AANPX American Beacon Retire Inc & Apprec Inv High Yield Muni ABHYX American Century High-Yield Muni Inv Inflation-Protected Bond ACITX American Century Infl-Adj Bond Inv Muni National Long ACLVX American Century Long-Term Tax-Free Inv MID-CAP VALUE ACMVX American Century Mid Cap Value Inv Conservative Allocation AONIX American Century One Choice: Vry Cnsrv I MID-CAP VALUE ARDEX Aston/River Road Dividend All Cap Val N Target Date 2011-2015 ARFIX American Century LIVESTRONG 2015 Inv Retirement Income ARTOX American Century LIVESTRONG Inc Inv Target Date 2021-2025 ARWIX American Century LIVESTRONG 2025 Inv Target Date 2031-2035 ARYIX American Century LIVESTRONG 2035 Inv SMALL VALUE AVPAX American Beacon Small Cp Val Inv EUROPE STOCK AXEAX Threadneedle European Equity A Muni National Interm BMBSX Baird Intermediate Muni Bd Inv Technology BOGSX Black Oak Emerging Technology Small Growth BSCFX Baron Small Cap Moderate Allocation BUFBX Buffalo Balanced Technology BUFTX Buffalo Science & Technology DIVERSIFIED EMERGING MKTS CEMVX Causeway Emerging Markets Investor MID-CAP BLEND CHTTX Aston/Optimum Mid Cap N Intermediate Government CPTNX American Century Government Bond Inv Small Growth CSMVX Century Small Cap Select Inv REAL ESTATE CSRSX Cohen & Steers Realty Shares Long-Short CVSIX Calamos Market Neutral Income A SMALL BLEND DISSX Dreyfus Small Cap Stock Index Bank Loan EABLX Eaton Vance Floating Rate Adv Conservative Allocation EXDAX Manning & Napier Pro-Blend Cnsrv Term S Foreign Large Blend EXWAX Manning & Napier World Opportunities A Moderate Allocation FAGSX First American Strat Growth Allc A Financial FBRSX FBR Small Cap Financial ULTRASHORT BOND FEUGX Federated Adjustable Rate Secs Instl Intermediate Government FICMX Federated Income Instl Muni National Interm FIMTX Federated Intermediate Municipal Instl LARGE BLEND FMIHX FMI Large Cap Long-Short FMLSX Wasatch-1st Source Long/Short SHORT GOVERNMENT FSGVX Federated US Govt 1-3 Yr Instl Muni Short FSHIX Federated Shrt-Interm Dur Muni Instl Short-Term Bond FSTIX Federated Short-Term Income Instl Intermediate-Term Bond FTRFX Federated Total Return Bond Instl Svc SMALL BLEND GABSX Gabelli Small Cap Growth AAA Communications GABTX GAMCO Global Telecommunications AAA LARGE GROWTH HCAIX Harbor Capital Appreciation Inv Foreign Large Blend HIINX Harbor International Inv WORLD STOCK HLMGX Harding Loevner Global Equity Advisor Foreign Large Growth HLMNX Harding Loevner International Equity Inv Equity Energy ICENX ICON Energy S China Region ICHKX Guinness Atkinson China & Hong Kong LARGE VALUE INDZX RiverSource Diversified Equity Inc A Moderate Allocation JABAX Janus Balanced T Health JAGLX Janus Global Life Sciences T LARGE GROWTH JAMRX Janus Research T Small Growth JATTX Janus Triton T Foreign Large Blend JETAX Artio International Equity II A Target Date 2021-2025 JNSAX JPMorgan SmartRetirement 2025 A LARGE BLEND JRMSX INTECH Risk-Managed Core T Target Date 2011-2015 JSFAX JPMorgan SmartRetirement 2015 A Target Date 2026-2030 JSMAX JPMorgan SmartRetirement 2030 A Target Date 2016-2020 JTTAX JPMorgan SmartRetirement 2020 A LARGE BLEND JUEAX JPMorgan US Equity A LARGE VALUE JVLAX JHancock3 Disciplined Value A Small Growth KGSCX Kalmar Growth-with-Value Small Cap LARGE GROWTH LGILX Laudus Growth Investors US Large Cap Gr WORLD BOND LIFNX Laudus Mondrian Intl Fixed Income Foreign Large Blend LISOX Lazard Intl Strategic Equity Open Multisector Bond LSBRX Loomis Sayles Bond Retail DIVERSIFIED PACIFIC/ASIA MAPIX Matthews Asia Pacific Equity Income PACIFIC/ASIA EX-JAPAN STK MAPTX Matthews Pacific Tiger Investor China Region MCHFX Matthews China Investor Muni National Interm MITFX Marshall Intermediate Tax-Free Inv JAPAN STOCK MJFOX Matthews Japan Investor Foreign Large Blend MKIEX McKee International Equity Instl DIVERSIFIED PACIFIC/ASIA MPACX Matthews Asia Pacific Investor High Yield Bond MWHYX Metropolitan West High Yield Bond M Short-Term Bond MWLDX Metropolitan West Low Duration Bond M Intermediate-Term Bond MWTRX Metropolitan West Total Return Bond M MID-CAP BLEND NMMCX Northern Multi-Manager Mid Cap SMALL VALUE NOSGX Northern Small Cap Value Muni National Long NOTEX Northern Tax-Exempt Small Growth NSPAX ING Small Cap Opportunities A Foreign Small/Mid Value OAKEX Oakmark International Small Cap I WORLD STOCK OAKGX Oakmark Global I COMMODITIES BROAD BASKET PCRDX PIMCO Commodity Real Ret Strat D Emerging Markets Bond PEMDX PIMCO Emerging Markets Bond D LARGE BLEND PEOPX Dreyfus S&P 500 Index WORLD BOND PFODX PIMCO Foreign Bond (USD-Hedged) D Intermediate-Term Bond PGBOX JPMorgan Core Bond A Multisector Bond PONDX PIMCO Income D LARGE BLEND PRBLX Parnassus Equity Income - Inv Inflation-Protected Bond PRRDX PIMCO Real Return D SMALL VALUE PSOAX JPMorgan Small Cap Value A Intermediate-Term Bond PTTDX PIMCO Total Return D SMALL BLEND RYTFX Royce Total Return Svc Intermediate-Term Bond SAMIX RidgeWorth Intermediate Bond I Foreign Large Blend SICNX Schwab International Core Equity Inst Foreign Large Blend SIEIX RidgeWorth Intl Equity Index I ULTRASHORT BOND SIGVX RidgeWorth US Gov Sec Ultra-Short Bd I Target Date 2031-2035 SRJAX JPMorgan SmartRetirement 2035 A DIVERSIFIED EMERGING MKTS SSEMX SSgA Emerging Markets Instl High Yield Bond STHTX RidgeWorth High Income I Muni National Interm STTBX RidgeWorth Investment Grade T/E Bond I LARGE BLEND SWANX Schwab Core Equity Inv Global Real Estate SWASX Schwab Global Real Estate Select Target Date 2026-2030 SWDRX Schwab Target 2030 LARGE VALUE SWDSX Schwab Dividend Equity Financial SWFFX Schwab Financial Services Target Date 2011-2015 SWGRX Schwab Target 2015 Intermediate Government SWGSX Schwab GNMA Long-Short SWHEX Schwab Hedged Equity Health SWHFX Schwab Health Care Target Date 2021-2025 SWHRX Schwab Target 2025 Intermediate-Term Bond SWIIX Schwab Premier Income Instl Foreign Large Blend SWISX Schwab International Index Retirement Income SWKRX Schwab Monthly Income Enh Payout Retirement Income SWLRX Schwab Monthly Income Max Payout LARGE GROWTH SWLSX Schwab Large-Cap Growth Foreign Large Growth SWMIX Laudus International MarketMasters Sel Small Growth SWMSX Laudus Small-Cap MarketMasters Select Muni National Interm SWNTX Schwab Tax-Free Bond Moderate Allocation SWOBX Schwab Balanced Inv LARGE BLEND SWPPX Schwab S&P 500 Index SMALL BLEND SWSSX Schwab Small Cap Index LARGE GROWTH TGCNX TCW Select Equities N Mid-Cap Growth TGDNX TCW Growth Equities N EQUITY PRECIOUS METALS TGLDX Tocqueville Gold LARGE BLEND TICRX TIAA-CREF Social Choice Eq Retail LARGE GROWTH TIRTX TIAA-CREF Large-Cap Growth Retail LARGE GROWTH TWCGX American Century Growth Inv Muni National Interm TWTIX American Century Interm-T Tx-Fr Bd Inv SHORT GOVERNMENT TWUSX American Century Short-Term Govt Inv LARGE VALUE TWVLX American Century Value Inv Foreign Large Value TWWDX Thomas White International Foreign Large Growth UMBWX Scout International SMALL VALUE VSFAX Federated Clover Small Value A Mid-Cap Growth WTMGX Westcore MIDCO Growth LARGE VALUE YAFFX Yacktman Focused Asset Class Number of funds Balanced Fund 21 REITs 2 Fixed Income 34 Commodity 1 Sector Fund 9 Foreign Equity 18 Emerging Market Equity 7 US Equity 41 Other 4 Total 137
As of Apr 5, 2011, this plan investment choice is rated as above average based on MyPlanIQ Plan Rating methodology that was designed to measure how effective a plan's available investment funds are . It has the following detailed ratings:Diversification -- Rated as great (98%)
Fund Quality -- Rated as average (54%)
Portfolio Building -- Rated as great (86%)
Overall Rating: above average (80%)Portfolio Discussions
The chart and table below show the historical performance of moderate model portfolios employing strategic and tactical asset allocation strategies. For comparison purpose, we also include the moderate model portfolios of a typical 6 asset SIB (Simpler Is Better) plan . This SIB plan has the following candidate index funds and their ETFs equivalent:
US Equity: SPY or VTI
Commodity: DBC
Foreign Equity: EFA or VEU
REITs: IYR or VNQ or ICF
Emerging Market Equity: EEM or VWO
Fixed Income: AGG or BND
Performance chart (as of Apr 5, 2011)Performance table (as of Apr 5, 2011)
Portfolio Name 1Yr AR 1Yr Sharpe 3Yr AR 3Yr Sharpe 5Yr AR 5Yr Sharpe Schwab OneSource Select List Funds Tactical Asset Allocation Moderate 13% 106% 10% 91% 13% 110% Schwab OneSource Select List Funds Strategic Asset Allocation Moderate 12% 152% 4% 32% 7% 52% Six Core Asset ETF Benchmark Tactical Asset Allocation Moderate 10% 81% 9% 82% 13% 89% Six Core Asset ETF Benchmark Strategic Asset Allocation Moderate 14% 121% 4% 20% 7% 34% With six asset classes and a wide number of funds, the returns beat the six asset class benchmark. With high scores in all categories, this plan delivers portfolios that have produced strong historical returns.
Symbols: SPY, VTI, EFA, VEU, EEM, VWO, IYR, VNQ, ICF, AGG, BND, DBC, HYG, JNK, PHB, AOM, AOK, CIU, BIV, ITM, MUB, TFI, PZA, MLN, IYH, IXJ, VHT, XBI, PBE, DBR, RYH, EFG, IXP, PTE, DGG, LTL, MTK, PTF, DBT, RYT, ROM, GWL, PFA, IVE, IWW, JKF, VTV, ELV, PWV, RPV, SCHV, SCZ, EFV, PID, DWM, IYF, VFH, IPF, PFI, DRF, RYF, IFGL, RWX, TZE, TZG, TZI, TZO, TZL, IGOV, BWX, WIP, IVV, IYY, IWV, VV, DLN, RSP, SCHX, IOO, VT, SHY, SHV, VGSH, PLK, USY, IEV, VGK, PEF, DEB, IVW, IWZ, JKE, VUG, ELG, QQQQ, RPG, SCHG, IJJ, IWS, JKI, VOE, EMV, PWP, RFV, UVU, IJH, IWR, JKG, VO, MDY, EMM, PJG, DON, EZM, MVV, IJS, IWN, JKL, VBR, DSV, PWY, RZV, UVT, IJR, IWM, JKJ, VB, DSC, PJM, DES, SAA, UWM, SCHA, GMM, PXH, DEM, SCHE, GBF, LAG, PCY, CSJ, BSV, VCSH, ITE, IXC, IPW, DBE, RYE, DKA, IEI, VGIT, IJK, IWP, VOT, EMG, PWJ, RFG, UKW, IJT, IWO, JKK, VBK, DSG, PWT, RZG, UKK, TIP, DBP, EPP, VPL, GMF, PAF, AAXJ, DND, EWJ, JPP, PJO, DXJ, GSG, BIL
Disclosure:
MyPlanIQ does not have any business relationship with the company or companies mentioned in this article. It does not set up their retirement plans. The performance data of portfolios mentioned above are obtained through historical simulation and are hypothetical.
Originally from the UK, Jenny Hollingworth lives with her husband and two sons in Northern California. She is a wife, mother, writer, theatre director, coffee drinker, avid reader, keen walker, movie watcher, Jane Austen lover and observer of life, in no particular order. MyPlanIQ has no formal relationship with Jenny Hollingworth.
- Schwab Select ETF Plan Has Bright Prospects
04/06/2011
Schwab ETF Plan Has Good Pedigree and Bright Prospects Retirement is now a "hair on fire" problem. There is much talk of working longer, downsizing, living on less. However, there is something you can do to help improve your risk adjusted returns. Look at your portfolios and plans to build a diversified portfolio with a systematic investment strategy.
This is not as hard as you might think -- to highlight this point, we feature a plan created by a non professional that matches up well with any of the other plans. Kevin Carr. is an individual investor who employs a long term strategy. He manages an individual common stock portfolio as well as many plans on MyPlan IQ. If you have any questions regarding this plan please contact him.
This plan provides you with Schwab's experts’ top picks of low-cost ETFs representing approximately 50 ETFs, based on rigorous criteria including expenses, tracking error, trading volume, and more. Schwab ETFs trade commission free. There are no redemption periods so you can start today and not worry about holding periods.We report on this Schwab ETF Select List which consists of 49 funds. These funds give exposure to 6 major assets: US Equity, Commodity, Foreign Equity, REITs, Emerging Market Equity, Fixed Income.
Asset Class Ticker Name LARGE BLEND SCHX Schwab U.S. Large-Cap ETF LARGE GROWTH SCHG Schwab U.S. Large-Cap Growth ETF LARGE VALUE SCHV Schwab U.S. Large-Cap Value ETF MID-CAP BLEND VO Vanguard Mid-Cap ETF Mid-Cap Growth VOT Vanguard Mid-Cap Growth ETF MID-CAP VALUE VOE Vanguard Mid-Cap Value ETF SMALL BLEND SCHA Schwab U.S. Small-Cap ETF Small Growth VBK Vanguard Small Cap Growth ETF SMALL VALUE VBR Vanguard Small Cap Value ETF LARGE BLEND SCHB Schwab U.S. Broad Market ETF LARGE VALUE VYM Vanguard High Dividend Yield Indx ETF Foreign Large Blend SCHF Schwab International Equity ETF Foreign Large Growth EFG iShares MSCI EAFE Growth Index Foreign Large Value EFV iShares MSCI EAFE Value Index FOREIGN SMALL/MID GROWTH SCHC Schwab International Small-Cap Eq ETF DIVERSIFIED EMERGING MKTS SCHE Schwab Emerging Markets Equity ETF Foreign Large Blend VEU Vanguard FTSE All-World ex-US ETF WORLD STOCK VT Vanguard Total World Stock Index ETF EUROPE STOCK VGK Vanguard European ETF DIVERSIFIED PACIFIC/ASIA VPL Vanguard Pacific Stock ETF JAPAN STOCK EWJ iShares MSCI Japan Index China Region GXC SPDR S&P China Intermediate-Term Bond BND Vanguard Total Bond Market ETF SHORT GOVERNMENT SCHO Schwab Short-Term U.S. Treasury ETF Intermediate Government SCHR Schwab Intermediate-Term U.S. Trsy ETF LONG GOVERNMENT TLH iShares Barclays 10-20 Year Treasury Bd Inflation-Protected Bond SCHP Schwab U.S. TIPS ETF Intermediate-Term Bond CIU iShares Barclays Intermediate Credit Bd High Yield Bond JNK SPDR Barclays Capital High Yield Bond WORLD BOND BWX SPDR Barclays Capital Intl Treasury Bond Muni National Long MUB iShares S&P National AMT-Free Muni Bd Consumer Discretionary XLY Consumer Discret Select Sector SPDR Consumer Staples XLP Consumer Staples Select Sector SPDR Equity Energy XLE Energy Select Sector SPDR Financial XLF Financial Select Sector SPDR Health XLV Health Care Select Sector SPDR Industrials XLI Industrial Select Sector SPDR Natural Resources XLB Materials Select Sector SPDR Technology XLK Technology Select Sector SPDR Communications IYZ iShares Dow Jones US Telecom Utilities XLU Utilities Select Sector SPDR COMMODITIES BROAD BASKET DBC PowerShares DB Commodity Index Tracking Commodities Agriculture DBA PowerShares DB Agriculture Commodities Precious Metals IAU iShares Gold Trust Commodities Industrial Metals DBB PowerShares DB Base Metals Commodities Energy USL United States 12 Month Oil MISCELLANEOUS SECTOR PFF iShares S&P U.S. Preferred Stock Index REAL ESTATE VNQ Vanguard REIT Index ETF Asset Class Number of funds Balanced Fund 0 REITs 1 Fixed Income 9 Commodity 5 Sector Fund 11 Foreign Equity 8 Emerging Market Equity 3 US Equity 11 Other 1 Total 49 Many are looking for access to a well rounded ETF plan through Schwab. This fills this hole and as Schwab makes more of their own funds available, it will be possible to move them into the plan. On this review, the only comment would be to add another REIT choice. The other asset classes have a good number of selections without being overwhelming.
As of Apr 4, 2011, this plan investment choice is rated as above average based on MyPlanIQ Plan Rating methodology that was designed to measure how effective a plan's available investment funds are . It has the following detailed ratings:
Diversification -- Rated as great (99%)
Fund Quality -- Rated as average (47%)
Portfolio Building -- Rated as average (56%)
Overall Rating: above average (66%)
Thehigh diversification score means that all the major and minor asset classes have been ticked. Fund quality is lower because some of the ETF's don't have a long history but that shouldn't impede the ability for the future.
Portfolio Discussions
The chart and table below show the historical performance of moderate model portfolios employing strategic and tactical asset allocation strategies. For comparison purpose, we also include the moderate model portfolios of a typical 6 asset SIB (Simpler Is Better) plan . This SIB plan has the following candidate index funds and their ETFs equivalent:
US Equity: SPY or VTI
Commodity: DBC
Foreign Equity: EFA or VEU
REITs: IYR or VNQ or ICF
Emerging Market Equity: EEM or VWO
Fixed Income: AGG or BND
Performance chart (as of Apr 4, 2011)Performance table (as of Apr 4, 2011)
Portfolio Name 1Yr AR 1Yr Sharpe 3Yr AR 3Yr Sharpe 5Yr AR 5Yr Sharpe Schwab ETF Select List Tactical Asset Allocation Moderate 9% 82% 8% 72% 12% 89% Schwab ETF Select List Strategic Asset Allocation Moderate 14% 118% 3% 15% 4% 20% Six Core Asset ETF Benchmark Tactical Asset Allocation Moderate 9% 81% 10% 82% 13% 89% Six Core Asset ETF Benchmark Strategic Asset Allocation Moderate 14% 121% 4% 20% 7% 34%
This portfolio performs well against the six asset ETF benchmark- SAA provides lower volatility while albeit delivering lower historical returns but as more of the newer funds are applied to the portfolio, there will be more opportunity for closing the gap
- The TAA portfolios run neck and neck over the five year period
In a future article, we will review performance over the last three months to see how the plan has performed in the light of recent events.
Kay Takeaways- Building a plan of funds is not the preserve of the few -- anybody who has the interest and application to research can provide well constructed plans
- It is possible to benefit from those individuals while still having transparency and not being captive to any particular broker
Symbols: SPY, VTI, EFA, VEU, EEM, VWO, IYR, VNQ, ICF, AGG, BND, DBC, HYG, JNK, PHB, CIU, BIV, MUB, TFI, PZA, MLN, GII, PUI, DBU, RYU, UPW, IYH, IXJ, VHT, XBI, PBE, DBR, RYH, EFG, IXP, PTE, DGG, LTL, IYM, IGE, VAW, XLB, XME, PYZ, DBN, RTM, UYM, MTK, PTF, DBT, RYT, ROM, GWL, PFA, IVE, IWW, JKF, VTV, ELV, PWV, RPV, SCHV, EFV, PID, DWM, IYF, VFH, IPF, PFI, DRF, RYF, KXI, VDC, PSL, DPN, RHS, RXI, VCR, IYJ, EXI, VIS, IGOV, BWX, WIP, IVV, IYY, IWV, VV, DLN, RSP, SCHX, IOO, VT, SHY, SHV, VGSH, PLK, USY, TLT, TLH, IEF, EDV, VGLT, TLO, PLW, IEV, VGK, PEF, DEB, IVW, IWZ, JKE, VUG, ELG, QQQQ, RPG, SCHG, IJJ, IWS, JKI, VOE, EMV, PWP, RFV, UVU, IJH, IWR, JKG, VO, MDY, EMM, PJG, DON, EZM, MVV, IFSM, VSS, SCHC, IJS, IWN, JKL, VBR, DSV, PWY, RZV, UVT, IJR, IWM, JKJ, VB, DSC, PJM, DES, SAA, UWM, SCHA, GMM, PXH, DEM, SCHE, ITE, IXC, IPW, DBE, RYE, DKA, IEI, VGIT, IJK, IWP, VOT, EMG, PWJ, RFG, UKW, IJT, IWO, JKK, VBK, DSG, PWT, RZG, UKK, TIP, EPP, VPL, GMF, PAF, EWJ, JPP, PJO, DXJ, GSG
Disclosure:
MyPlanIQ does not have any business relationship with the company or companies mentioned in this article. It does not set up their retirement plans. The performance data of portfolios mentioned above are obtained through historical simulation and are hypothetical.
- Caterpillar's 401K Retirement Plan: Reasonable Investment Choices But Could Be More Systematic
03/28/2011
- Employees in Sprint Nextel Dial up An Average 401K Retirement Plan
03/22/2011
- Commodities Withstood the Recent Market Selloff
03/21/2011
- Earthquakes and Wars Call for Diversification and Tactical Asset Allocation in Investing
03/20/2011
- 'Safe' Assets' Trends Back to Positive: Risk Aversion Began?
03/14/2011
- Major Assets: Risk Assets Strong While Safe Assets Have Negative Trends
03/07/2011
- Commodities Showed Their Hedge Amid Equity Weakness
02/28/2011
- Shell Versus Morningstar -- More is Better
02/27/2011
- Energy Commodities and Gold Strong: Gold's Role in Asset Allocation
02/26/2011
- Major Asset Trends: U.S. Stocks and REITs Strong, International Bonds Worth Considering
02/22/2011
- Commodity ETF Trends: Silver Breaks Out, Gold Steady Amid Commodity Strength
02/20/2011
- E-Trade ETF Plan Hits Most of the High Notes
02/16/2011
- Major Asset Trends: Divergence of U.S. Stocks and Emerging Market Stocks Continues
02/14/2011
- Beware of Divergence Among Energy Commodity ETFs
02/14/2011
- Rising Energy Costs: Casting a Cloud over Energy-Dependent Sector ETFs
01/15/2011
- Peabody Investments Corp.Employee Retirement Account Report On 12/03/2010
12/03/2010
This report reviews Peabody Investments Corp.Employee Retirement Account plan. We will discuss the investment choices and present the plan rating by MyPlanIQ. Current economic and market conditions are discussed in the context of the investment portfolios in the plan. We will then show how participants in Peabody Investments Corp.Employee Retirement Account can achieve reasonable investment results using asset allocation strategies.
Plan Review and Rating
Peabody Energy Corporation, through its subsidiaries, engages in the exploration, mining, and production of coal worldwide.
Peabody Investments Corp.Employee Retirement Account's 401K plan consists of 37 funds. These funds enable participants to gain exposure to 5 major assets: US Equity, Foreign Equity, Emerging Market Equity, REITs, Fixed Income. The list of minor asset classes covered:
Diversified Emerging Mkts: EEM, GMM, PXH, DEM, SCHE
Foreign Large Blend: EFA, VEU, GWL, PFA
Foreign Large Value: EFV, PID, DWM
High Yield Bond: HYG, JNK, PHB
Intermediate Government: IEI, VGIT, ITE
Intermediate-term Bond: AGG, CIU, BIV, BND
Large Blend: IVV, IYY, IWV, VTI, VV, SPY, DLN, RSP, SCHX
Large Growth: IVW, IWZ, JKE, VUG, ELG, QQQQ, RPG, SCHG
Large Value: IVE, IWW, JKF, VTV, ELV, PWV, RPV, SCHV
Long Government: TLT, TLH, IEF, EDV, VGLT, TLO, PLW
Long-term Bond: CLY, LQD, BLV, VCLT
Mid-cap Blend: IJH, IWR, JKG, VO, MDY, EMM, PJG, DON, EZM, MVV
Mid-cap Growth: IJK, IWP, VOT, EMG, PWJ, RFG, UKW
Real Estate: IYR, ICF, VNQ
Retirement Income:
Small Blend: IJR, IWM, JKJ, VB, DSC, PJM, DES, SAA, UWM, SCHA
Small Growth: IJT, IWO, JKK, VBK, DSG, PWT, RZG, UKK
Target Date 2000-2010: TZD
Target Date 2011-2015: TZE
Target Date 2016-2020: TZG
Target Date 2021-2025: TZI
Target Date 2026-2030: TZL
Target Date 2031-2035: TZO
Target Date 2036-2040: TZV
Target Date 2041-2045:
Target Date 2050+:
As of Dec 2, 2010, this plan investment choice is rated as based on MyPlanIQ Plan Rating methodology that measures the effectiveness of a plan's available investment funds. It has the following detailed ratings:
Diversification -- Rated as (89%)
Fund Quality -- Rated as (63%)
Portfolio Building -- Rated as (94%)
Overall Rating: (83%)Current Economic and Market Conditions
We have experienced an uncertain 2010: plenty of worries on whether the US economy will climb out of the great recession and recover.
- The Federal Reserve embarked on Quantitative Easing II (QE2) to stimulate the economy.
- The housing market is still at its low but largely stabilized.
- The unemployment rate is stuck at 9%.
Americans continue to face an uncertain future, given (among others) the high unemployment rate, large federal and local government debts and global trade imbalance. With such an economic backdrop, the stock and debt markets are going to be volatile. Despite this, markets have been resilient and appear positioned to rebound.
In this market it is even more critical to properly diversify and respond market changes. MyPlanIQ offers two asset allocation strategies: strategic and tactical asset allocation strategies ( SAA and TAA for participants in Peabody Investments Corp.Employee Retirement Account).
Strategic Asset Allocation is based on well known modern portfolio theory and its key features include: diversification, proper fund selection and periodically re-balancing.
Tactical Asset Allocation works on a diversified array of assets provided by funds in a plan and adjusts asset mixes based on market conditions such as asset price momentum utilized by TAA.
Portfolio Discussions
The chart and table below show the historical performance of moderate model portfolios employing strategic and tactical asset allocation strategies. For comparison purpose, we also include the moderate model portfolios of a typical 5 asset SIB (Simpler Is Better) plan . This SIB plan has the following candidate index funds and their ETFs equivalent:
US Equity: (SPY or VTI)
Foreign Equity: (EFA or VEU)
Emerging Market Equity: (EEM or VWO)
REITs: (IYR or VNQ or ICF)
Fixed Income: (AGG or BND)
Performance chart (as of Dec 2, 2010)Performance table (as of Dec 2, 2010)
Portfolio Name 1Yr AR 1Yr Sharpe 3Yr AR 3Yr Sharpe 5Yr AR 5Yr Sharpe Peabody Investments Corp.Employee Retirement Account Tactical Asset Allocation Moderate 13% 103% 8% 75% 13% 102% Peabody Investments Corp.Employee Retirement Account Strategic Asset Allocation Moderate 13% 141% 3% 18% 7% 41% Five Core Asset Index ETF Funds Tactical Asset Allocation Moderate 9% 59% 7% 57% 14% 94% Five Core Asset Index ETF Funds Strategic Asset Allocation Moderate 12% 95% 4% 14% 8% 35% Currently, asset classes in US Equity (SPY,VTI), Emerging Market Equity (EEM,VWO) and Fixed Income (AGG,BND) are doing relatively well. These asset classes are available to Peabody Investments Corp.Employee Retirement Account participants.
To summarize, Peabody Investments Corp.Employee Retirement Account plan participants can achieve reasonable investment returns by adopting asset allocation strategies that are tailored to their risk profiles.
Symbols: BTU , SPY , VTI , EFA , VEU , EEM , VWO , IYR , VNQ , ICF , AGG , BND , HYG , JNK , PHB , CIU , BIV , GWL , PFA , IVE , IWW , JKF , VTV , ELV , PWV , RPV , SCHV , EFV , PID , DWM , TZD , TZE , TZG , TZI , TZO , TZL , TZV , IVV , IYY , IWV , VV , DLN , RSP , SCHX , TLT , TLH , IEF , EDV , VGLT , TLO , PLW , IVW , IWZ , JKE , VUG , ELG , QQQQ , RPG , SCHG , IJH , IWR , JKG , VO , MDY , EMM , PJG , DON , EZM , MVV , IJR , IWM , JKJ , VB , DSC , PJM , DES , SAA , UWM , SCHA , GMM , PXH , DEM , SCHE , CLY , LQD , BLV , VCLT , IEI , VGIT , ITE , IJK , IWP , VOT , EMG , PWJ , RFG , UKW , IJT , IWO , JKK , VBK , DSG , PWT , RZG , UKK
- Capital Accumulation Plan of The Chubb Corporation Report On 12/03/2010
12/03/2010
- EQT CORPORATION SAVINGS AND PROTECTION PLAN Report On 12/03/2010
12/03/2010
- Vanguard Variable Annuity Report On 12/06/2010
12/06/2010
- TD Ameritrade Commission Free ETFs Report On 12/07/2010
12/07/2010
- Vanguard-VA-Clone Report On 12/07/2010
12/07/2010
- Sprint Nextel 401K Plan Report On 03/21/2011
03/21/2011