 |
Vanguard ETF: |  |
7.4%* |
|
Diversified Core: | |
8.1%* |
|
Six Core Asset ETFs: | |
7.3%* |
Articles on IEF
- Retirement Income ETFs vs. Income Mutual Funds: An Update
09/11/2011
We first compared asset allocation portfolios using dividend ETFs (and bond ETFs) and those using income mutual funds on SeekingAlpha.com Retirement Income Investing: ETFs vs. Mutual Funds more than two months ago. Let's review these two plans: Retirement Income ETFs and Schwab Income Mutual Fund Select List.
Here are the asset classes covered by the two plans:
The list of minor asset classes covered by Retirement Income ETFs The list of minor asset classes covered by Schwab Income Mutual Fund Select List Diversified Emerging Mkts: EEM, VWO, DEM
Emerging Markets Bond: EMB, PCY
Equity Energy: AMJ
Foreign Large Value: PID, IDV
Global Real Estate: RWX
High Yield Bond: HYG
Inflation-protected Bond: TIP
Intermediate Government: IEI
Intermediate-term Bond: CIU, CORP, MBB
Large Blend: VIG
Large Value: DVY, SDY, VYM, FVD
Long Government: IEF, TLT
Long-term Bond: LQD, VCLT
Mid-cap Value: PEY
Miscellaneous Sector: PFF
Muni National Long: MUB
Muni Short: SHM
Real Estate: IYR, ICF, VNQ
Short Government: SHY
Short-term Bond: CSJ, VCSH
World Bond: BWX, WIPEmerging Markets Bond: TGINX
Foreign Large Blend: SICNX, LISOX
Foreign Large Value: AAIPX
High Yield Bond: STHTX, MWHYX
Inflation-protected Bond: ACITX
Intermediate Government: SWGSX, CPTNX
Intermediate-term Bond: SWIIX, SAMFX, PTTDX, PGBOX, MWTRX, FTRFX
Large Blend: SWANX, TICRX, PRBLX
Large Growth: SWLSX, JENSX
Large Value: TWEIX, PQIAX
Mid-cap Blend: NMMCX
Mid-cap Value: ARDEX
Multisector Bond: PONDX
Muni National Interm: SWNTX, TWTIX, STTBX
Muni National Long: NOTEX, ACLVX
Muni Short: FSHIX
Real Estate: CSRSX
Short Government: FIGTX
Short-term Bond: FSTIX, ACSNX
Ultrashort Bond: SIGVX
World Bond: PFODXAsset Class Retirement Income ETFs Schwab Income Mutual Fund Select List REITs 4 1 Fixed Income 19 24 Sector Fund 2 0 Foreign Equity 2 3 Emerging Market Equity 3 0 US Equity 6 9 Other 0 0 Total 36 37 Little in the two plans' investment choice ratings has changed since then. As of Sep 9, 2011, Retirement Income ETFs investment choice is rated as average and Schwab Income Mutual Fund Select List investment choice is rated as above average based on MyPlanIQ Plan Rating methodology that was designed to measure how effective a plan's available investment funds are . It has the following detailed ratings:
Attribute Retirement Income ETFs Schwab Income Mutual Fund Select List Diversification great (95%) great (85%) Fund Quality below average (29%) great (85%) Portfolio Building above average (67%) above average (71%) Overall Rating average (64%) above average (80%)
Performance chart (as of Sep 9, 2011)Performance table (as of Sep 9, 2011)
Portfolio Name 2011 YTD 1Yr AR 1Yr Sharpe 3Yr AR 3Yr Sharpe 5Yr AR 5Yr Sharpe Retirement Income ETFs Tactical Asset Allocation Moderate 2.49% 8% 80% 11% 84% 10% 71% Retirement Income ETFs Strategic Asset Allocation Moderate -1.16% 5% 42% 5% 23% 3% 14% Schwab Income Mutual Fund Select List Tactical Asset Allocation Moderate 3% 9% 84% 11% 101% 10% 92% Schwab Income Mutual Fund Select List Strategic Asset Allocation Moderate -2.11% 4% 35% 4% 27% 3% 16% Refer to detailed portfolio comparison.
Again, we are seeing income ETFs can still rival the well selected income mutual funds. This is a good news for income investors in their IRA investments or taxable account investments. ETFs have more flexibility and have a well defined and simple indexing strategy (isn't this what MyPlanIQ is also doing?).
Disclosure:MyPlanIQ does not have any business relationship with the company or companies mentioned in this article. It does not set up their retirement plans. The performance data of portfolios mentioned above are obtained through historical simulation and are hypothetical.
Symbols: SPX, VIG, DVY, SDY, ICF, RWX, HYG, LQD, IEF, TLT, TIP, AMJ, TWEIX, LISOX, CSRSX, PTTDX, Retirement Investments, IRAs, ETF Portfolios, Portfolio Management, Risk Management, Dividend ETFs
- The Implication of The Unthinkable U.S. Default: How Will It Affect Safe Haven Treasury Status
07/26/2011
The suqabble among our elected leaders on the government's debt ceiling plan as well as the ongoing debt load has started to make people wonder the once unthinkable event: the default of U.S. debt obligation. The probability for the U.S. to lose its AAA rating is growing higher and higher.
Sometimes, a sequence of events lead to a pointing point that can fundamentally change assumptions built in a working model, being a scientific or economic model. The U.S. losing AAA rating is an event that entails investors to re-examine some once unthinkable assumptions. These include the safe haven status of treasury bills and bonds.
Several excellent portfolios have this assumption built in. These include
Both of these plans use long term treasury bonds (IEF or TLT) as flight to safety insurance for a period of market stress such as when stock market (SPY) (SPX). However, if treasury bonds are indeed no longer the last resort of investments, one would need to at least question its role in a portfolio.
Fortunately, up to now, there isn't anything that can replace U.S. credit worthiness, at least not in a large scale. Though it is no longer the risk free, the treasury bonds are still the safest (again on a large scale excluding small sovereign debts). So in a global economic and/or market stress, it is hard to imagine what other country's debts can replace the treasuries for now.
On the other hand, we certainly need to monitor the development closely on any more substantial changes in the future.
Symbols: TLT, IEF, SPY, SPX, Portfolio Strategy
- First Pacific Advisors (FPA) Bob Rodriguez: Another Crash Coming
06/08/2011
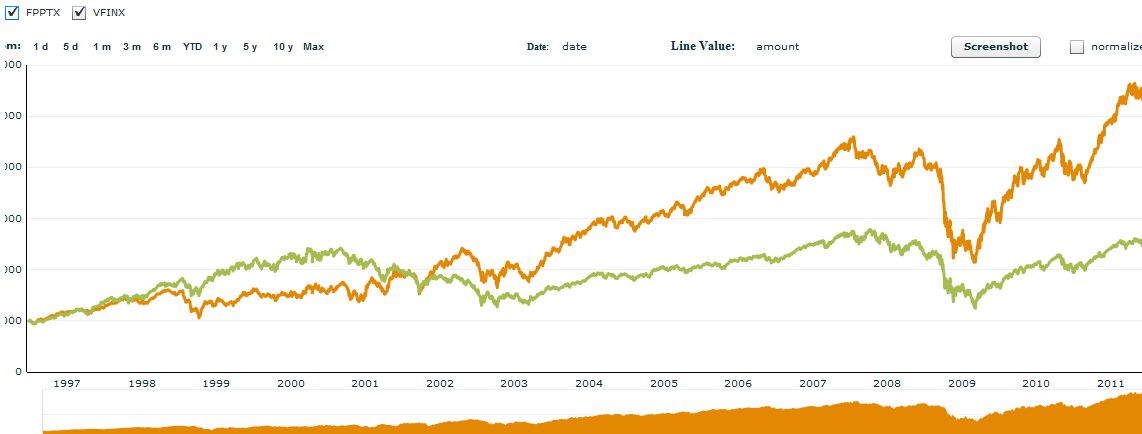
Robert Rodriguez is the CEO of First Pacific Advisors (FPA). He managed the famed FPA Capital (FPPTX) and FPA New Income (FPNIX). He was twice named Morningstar's fixed-income manager of the year (2001 & 2008).
After taking a one year sabbatical in 2010, he came back to find that the world was still the same: problems that caused the financial crisis in 2008 had not been resolved. Here are some key points he made in a recent Fortune Magazine's article on Rodriguez:
- U.S. debt as a percentage of GDP ratio (currently 64%) is massively underreported because it doesn't count off-balance-sheet entitlements such as Medicare, and debt owed by Fannie and Freddie. If you factor in those liabilities, the ratio will be over 500%!
- The situation isn't irreparable: both parties are not willing to take drastic measures, let alone we are approaching to the election year.
- FPA Capital (FPPTX) is now 30% in cash (he had that before 2008) and 38% in energy sector (XLE). He refused to buy other sectors and even long term or intermediate term bonds (LQD) (TLT), (IEF).
At the end, as what the article stated: " A former Republican, he describes himself as a "fiscal conservative but social moderate" who has grown disgusted with both parties: "I say, 'A pox on both their houses.'""
The following is the chart of FPPTX vs. VFINX (Vanguard 500 Index):
The following is the performance comparison between FPPTX and Six Core Asset ETFs Tactical Asset Allocation Moderate.
Portfolio Performance Comparison
Portfolio/Fund Name 1Yr AR 1Yr Sharpe 3Yr AR 3Yr Sharpe 5Yr AR 5Yr Sharpe FPPTX 39% 198% 8% 31% 7% 27% Six Core Asset ETFs Tactical Asset Allocation Moderate 16% 128% 9% 79% 15% 104%
See Here for more detailed comparison.See Here for another fund FPA Crecent's recent asset allocation analysis.
Symbols: SPY, TLT, XLE, IEF, FPPTX, FPNIX, VFINX
Exchange Tickers: (SPY), (TLT), (XLE), (IEF), (FPPTX), (FPNIX), (VFINX)
- Appetite for US High Yield Bonds Remains High as Yields Tighten
05/11/2011
High yield bond ETFs concentrate on lower quality corporate bonds, which are considered riskier than higher-quality or more established companies. Because of this higher level of risk, high-yield bonds, also known as junk bonds, offer higher yields to investors. US high yield bond ETFs invest at least 65% of capital in binds that are not rated or are rated by S&P or Moody's at or below BB (considered speculative). Because of high returns and the potential for diversification across many markets, regions, and industries, high yield bonds are a major part of many investment strategies.
Trend score is the average of 1,4,13,26 and 52 week total returns (including dividend reinvested).Assets Class Symbols 05/06
Trend
Score04/29
Trend
ScoreDirection International Inflation Protected WIP 6.74% 9.22% v High Yield JNK 5.54% 5.68% v International Treasury BWX 5.1% 6.82% v Long Term Credit LQD 3.48% 2.87% ^ Emerging Mkt Bonds PCY 3.48% 2.21% ^ 20+ Year Treasury TLT 3.38% 1.63% ^ Inflation Protected TIP 3.09% 3.27% v 10-20Year Treasury TLH 2.88% 1.73% ^ Intermediate Term Credit CIU 2.43% 2.06% ^ Intermediate Treasury IEF 2.39% 1.65% ^ US Total Bond BND 2.1% 1.77% ^ MBS Bond MBB 1.92% 1.83% ^ California Muni CMF 1.74% 1.99% v National Muni MUB 1.57% 1.24% ^ Short Term Credit CSJ 1.0% 1.09% v New York Muni NYF 0.64% 0.51% ^ Short Term Treasury SHY 0.55% 0.53% ^ Treasury Bills SHV 0.08% 0.07% ^
You can get a no cost widget for any of these tables which will automatically update weekly.At the end of last week (5/6/2011), high yield bond ETFs, represented by the SPDR Barclays Capital High Yield (JNK), stood among the top of the Fixed Income Return Table. Yields in the sector have declined as risk premiums have tightend on stronger performance by companies with lower credit ratings. While returns on corporate bonds have declined slightly in recent periods, ETFs that track the market have continually offered strong returns relative to other fixed income securities.U.S. High Yield Bonds
05/06/2011Description Symbol 1 Yr 3 Yr 5 Yr Avg. Volume(K) 1 Yr Sharpe iShares iBoxx $ High Yield Corp HYG 17.67% 7.03% NA 1,247 270.24% SPDR Barclays Capital High Yield JNK 20.83% 8.41% NA 2,972 279.79% PowerShares Fundamental High Yield PHB 19.2% 0.79% NA 302 318.25% Among US High Yield Bond ETFs, the top performers include the SPDR Barclays Capital High Yield (JNK), the Powershares Fundamental High Yield ETF (PHB), and the iShares iBoxx $ High Yield Corporate ETF (HYG) returning 20.83%, 19.20%, 17.67% respectively in the past year.With the highest one-year return and the highest trading volume, the SPDR Barclays Capital High Yield ETF remains a srtong investment option. The ETF is well diversified, with no single bond comprising more than 4% of total assets and the top 10% of assets making up only 22.58% of the total.Going forward, yields on high yield corporate debt should continue to tighten as long as companies continue to generate strong performance. Still, high yield corporate bond ETFs should continue to offer attractive returns relative to other fixed income assets.Corporate bonds are an important component of diversified bond portfolios, as they offer greater returns and risks than government bonds. Due to their high level of interest paid, generally in the form of monthly distributions, corporate bond ETFs may be especially suitable for individuals approaching or already in retirement. As with any investment, it is important to make sure the risk and return levels match up with your personal investment goals.Symbols: AGG, BND, SHV, SHY, IEF, TLH, TLT, TIP, WIP, HYG, JNK, PHB, CSJ, CIU, LQD, BWX, CMF, NYF, MUB, MBB, PCY, EMB
Tickers: (NYSE: AGG), (NYSE: BND), (NYSE: SHV), (NYSE: SHY), (NYSE: IEF), (NYSE: TLH), (NYSE: TLT), (NYSE: TIP), (NYSE: WIP), (NYSE: HYG), (NYSE: JNK), (NYSE: PHB), (NYSE: CSJ), (NYSE: CIU), (NYSE: LQD), (NYSE: BWX), (NYSE: CMF), (NYSE: NYF), (NYSE: MUB), (NYSE: MBB), (NYSE: PCY), (NYSE: EMB)Disclosure:
MyPlanIQ does not have any business relationship with the company or companies mentioned in this article. It does not set up their retirement plans. The performance data of portfolios mentioned above are obtained through historical simulation and are hypothetical. - JNK Beats WIP At the Top of The Fixed Income Table
05/10/2011
In order to reach your financial objectives, you must diversify. There are a range of investment alternatives that vary greatly in the degree and type of risk and potential return. The key to developing a sound portfolio is to strike the right balance between potential reward and risk, based on your financial objectives, financial situation and investment style.
Fixed Income refers to assets that provide their owners with a fixed stream of income. Fixed income assets can be broken down into five sub-classes:
- Government-issued securities
- Corporate-issued securities
- Inflation-protected securities (IPS)
- Mortgage-backed securities (MBS)
- Asset-backed securities (ABS)
An enormous amount of innovation continues within the world of fixed income. For the retail investor, IPS, MBS, and ABS are all relatively new additions. The U.S. leads the world in the range and depth of fixed-income offerings--particularly with MBS and ABS. Other countries are developing their MBS and ABS markets.
Although the fixed income stream ETFs provide the best hedge against equity volatility, the returns are not high as equity and other assets. WIP, JNK & BWX are the best performers in terms of returns but the last week showed a decline.
There is a mixed trend within the fixed asset type ETFs but overall more sub-classes are up than down. We are expecting a shift in ETF’s towards international fixed income as the dollar weakens and interest rates are raised overseas
WIP fund total Net assets value is 1.362 billion with a one year return of 16.95% and a three year return is of 4.01%. The gross expense ratio is 0.50%. The total sector allocation is broken down into the following composition: Treasury 99.83% & Cash 0.16%.
JNK fund total Net assets value is 7.3 billion with a one year return of 12.82% and a three year return is of 8.21%. The gross expense ratio is 0.40% for the sector allocations please see the graph below:

Although the one year returns of WIP i.e. 16.95% are greater than JNK i.e. 12.82%, we prefer the longevity from JNK i.e. 8.21% within the 3 years double the time of WIP return and it is performing well in the short term too.
We track asset class movement and you can see here the fixed income table which is updated weekly.
Assets Class
Symbols
05/06
Trend
Score04/29
Trend
ScoreDirection
International Inflation Protected
WIP
6.74%
9.22%
v
High Yield
JNK
5.54%
5.68%
v
International Treasury
BWX
5.1%
6.82%
v
Long Term Credit
LQD
3.48%
2.87%
^
Emerging Mkt Bonds
PCY
3.48%
2.21%
^
20+ Year Treasury
TLT
3.38%
1.63%
^
Inflation Protected
TIP
3.09%
3.27%
v
10-20Year Treasury
TLH
2.88%
1.73%
^
Intermediate Term Credit
CIU
2.43%
2.06%
^
Intermediate Treasury
IEF
2.39%
1.65%
^
US Total Bond
BND
2.1%
1.77%
^
MBS Bond
MBB
1.92%
1.83%
^
California Muni
CMF
1.74%
1.99%
v
National Muni
MUB
1.57%
1.24%
^
Short Term Credit
CSJ
1.0%
1.09%
v
New York Muni
NYF
0.64%
0.51%
^
Short Term Treasury
SHY
0.55%
0.53%
^
Treasury Bills
SHV
0.08%
0.07%
^
Trend score is the average of 1,4,13,26 and 52 week total returns (including dividend reinvested).
You can get a no cost widget for any of these tables which will automatically update weekly.If you are planning to shift part of your portfolio into fixed-income investments to help manage risk, you may also want to consider "laddering" these securities. This means you spread the total dollar amount of your investment among fixed-income securities with different maturities.
Symbols: AGG, BND, SHV, SHY, IEF, TLH, TLT, TIP, WIP, HYG, JNK, PHB, CSJ, CIU, LQD, BWX, CMF, NYF, MUB, MBB, PCY, EMB
Disclosure:
MyPlanIQ does not have any business relationship with the company or companies mentioned in this article. It does not set up their retirement plans. The performance data of portfolios mentioned above are obtained through historical simulation and are hypothetical.
- Emerging Market Bonds Become Important Parts of Many Portfolios
05/04/2011
- How Are Morningstar's Best Bond Fund Managers Faring in These Trying Times
04/29/2011
- GMO’s Lean Investment Outlook
04/08/2011
- Schwab Select ETF Plan Has Bright Prospects
04/06/2011
- Smart U.S. Money Managers Dumped Long Term Treasury Bonds, Who Are Holding The Bag?
04/04/2011
- Tactically Manage An Income Producing Portfolio With Commodity Exposure
03/25/2011
- Commodities Withstood the Recent Market Selloff
03/21/2011
- Earthquakes and Wars Call for Diversification and Tactical Asset Allocation in Investing
03/20/2011
- 'Safe' Assets' Trends Back to Positive: Risk Aversion Began?
03/14/2011
- Major Assets: Risk Assets Strong While Safe Assets Have Negative Trends
03/07/2011
- Commodities Showed Their Hedge Amid Equity Weakness
02/28/2011
- Energy Commodities and Gold Strong: Gold's Role in Asset Allocation
02/26/2011
- Major Asset Trends: U.S. Stocks and REITs Strong, International Bonds Worth Considering
02/22/2011
- Commodity ETF Trends: Silver Breaks Out, Gold Steady Amid Commodity Strength
02/20/2011
- E-Trade ETF Plan Hits Most of the High Notes
02/16/2011
- Allegheny Ludlum Corporation Personal Retirement and 401(k) Savings Account Plan Report On 12/03/2010
12/03/2010
This report reviews Allegheny Ludlum Corporation Personal Retirement and 401(k) Savings Account Plan plan. We will discuss the investment choices and present the plan rating by MyPlanIQ. Current economic and market conditions are discussed in the context of the investment portfolios in the plan. We will then show how participants in Allegheny Ludlum Corporation Personal Retirement and 401(k) Savings Account Plan can achieve reasonable investment results using asset allocation strategies.
Plan Review and Rating
--
Allegheny Ludlum Corporation Personal Retirement and 401(k) Savings Account Plan's 401K plan consists of 55 funds. These funds enable participants to gain exposure to 5 major assets: US Equity, Foreign Equity, Commodity, Emerging Market Equity, Fixed Income. The list of minor asset classes covered:
Commodities Broad Basket: GSG, DBC
Conservative Allocation: AOK
Diversified Emerging Mkts: EEM, GMM, PXH, DEM, SCHE
Diversified Pacific/asia: EPP, VPL, GMF, PAF
Equity Energy: ITE, IXC, IPW, DBE, RYE, DKA
Europe Stock: IEV, VGK, PEF, DEB
Foreign Large Blend: EFA, VEU, GWL, PFA
Foreign Small/mid Growth: IFSM, VSS, SCHC
Health: IYH, IXJ, VHT, XBI, PBE, DBR, RYH
Inflation-protected Bond: TIP
Intermediate-term Bond: AGG, CIU, BIV, BND
Large Blend: IVV, IYY, IWV, VTI, VV, SPY, DLN, RSP, SCHX
Large Growth: IVW, IWZ, JKE, VUG, ELG, QQQQ, RPG, SCHG
Large Value: IVE, IWW, JKF, VTV, ELV, PWV, RPV, SCHV
Latin America Stock: ILF, GML
Long Government: TLT, TLH, IEF, EDV, VGLT, TLO, PLW
Mid-cap Value: IJJ, IWS, JKI, VOE, EMV, PWP, RFV, UVU
Multisector Bond: AGG, GBF, BND, LAG
Natural Resources: IYM, IGE, VAW, XLB, XME, PYZ, DBN, RTM, UYM
Pacific/asia Ex-japan Stk: EPP, AAXJ, GMF, PAF, DND
Short Government: SHY, SHV, VGSH, PLK, USY
Short-term Bond: CSJ, BSV, VCSH
Small Growth: IJT, IWO, JKK, VBK, DSG, PWT, RZG, UKK
Technology: MTK, PTF, DBT, RYT, ROM
As of Dec 2, 2010, this plan investment choice is rated as based on MyPlanIQ Plan Rating methodology that measures the effectiveness of a plan's available investment funds. It has the following detailed ratings:
Diversification -- Rated as (91%)
Fund Quality -- Rated as (48%)
Portfolio Building -- Rated as (84%)
Overall Rating: (75%)Current Economic and Market Conditions
We have experienced an uncertain 2010: plenty of worries on whether the US economy will climb out of the great recession and recover.
- The Federal Reserve embarked on Quantitative Easing II (QE2) to stimulate the economy.
- The housing market is still at its low but largely stabilized.
- The unemployment rate is stuck at 9%.
Americans continue to face an uncertain future, given (among others) the high unemployment rate, large federal and local government debts and global trade imbalance. With such an economic backdrop, the stock and debt markets are going to be volatile. Despite this, markets have been resilient and appear positioned to rebound.
In this market it is even more critical to properly diversify and respond market changes. MyPlanIQ offers two asset allocation strategies: strategic and tactical asset allocation strategies ( SAA and TAA for participants in Allegheny Ludlum Corporation Personal Retirement and 401(k) Savings Account Plan).
Strategic Asset Allocation is based on well known modern portfolio theory and its key features include: diversification, proper fund selection and periodically re-balancing.
Tactical Asset Allocation works on a diversified array of assets provided by funds in a plan and adjusts asset mixes based on market conditions such as asset price momentum utilized by TAA.
Portfolio Discussions
The chart and table below show the historical performance of moderate model portfolios employing strategic and tactical asset allocation strategies. For comparison purpose, we also include the moderate model portfolios of a typical 4 asset SIB (Simpler Is Better) plan . This SIB plan has the following candidate index funds and their ETFs equivalent:
US Equity: (SPY or VTI)
Foreign Equity: (EFA or VEU)
Emerging Market Equity: (EEM or VWO)
Fixed Income: (AGG or BND)
Performance chart (as of Dec 2, 2010)Performance table (as of Dec 2, 2010)
Portfolio Name 1Yr AR 1Yr Sharpe 3Yr AR 3Yr Sharpe 5Yr AR 5Yr Sharpe Allegheny Ludlum Corporation Personal Retirement and 401(k) Savings Account Plan Tactical Asset Allocation Moderate 6% 44% 7% 51% 16% 109% Allegheny Ludlum Corporation Personal Retirement and 401(k) Savings Account Plan Strategic Asset Allocation Moderate 12% 119% 3% 21% 9% 61% Four Core Asset ETF Index Funds Emerging Markets Tactical Asset Allocation Moderate 1% 6% 6% 49% 12% 78% Four Core Asset ETF Index Funds Emerging Markets Strategic Asset Allocation Moderate 10% 75% 2% 6% 7% 31% Currently, asset classes in Foreign Equity (EFA,VEU), Emerging Market Equity (EEM,VWO) and Fixed Income (AGG,BND) are doing relatively well. These asset classes are available to Allegheny Ludlum Corporation Personal Retirement and 401(k) Savings Account Plan participants.
To summarize, Allegheny Ludlum Corporation Personal Retirement and 401(k) Savings Account Plan plan participants can achieve reasonable investment returns by adopting asset allocation strategies that are tailored to their risk profiles.
Symbols: ATI , SPY , VTI , EFA , VEU , EEM , VWO , AGG , BND , DBC , AOK , CIU , BIV , IYH , IXJ , VHT , XBI , PBE , DBR , RYH , IYM , IGE , VAW , XLB , XME , PYZ , DBN , RTM , UYM , MTK , PTF , DBT , RYT , ROM , GWL , PFA , IVE , IWW , JKF , VTV , ELV , PWV , RPV , SCHV , IVV , IYY , IWV , VV , DLN , RSP , SCHX , SHY , SHV , VGSH , PLK , USY , TLT , TLH , IEF , EDV , VGLT , TLO , PLW , IEV , VGK , PEF , DEB , IVW , IWZ , JKE , VUG , ELG , QQQQ , RPG , SCHG , IJJ , IWS , JKI , VOE , EMV , PWP , RFV , UVU , IFSM , VSS , SCHC , GMM , PXH , DEM , SCHE , GBF , LAG , CSJ , BSV , VCSH , ITE , IXC , IPW , DBE , RYE , DKA , ILF , GML , IJT , IWO , JKK , VBK , DSG , PWT , RZG , UKK , TIP , EPP , VPL , GMF , PAF , AAXJ , DND , GSG
- Peabody Investments Corp.Employee Retirement Account Report On 12/03/2010
12/03/2010
- TD Ameritrade Commission Free ETFs Report On 12/07/2010
12/07/2010