 |
Vanguard ETF: |  |
7.4%* |
|
Diversified Core: | |
8.1%* |
|
Six Core Asset ETFs: | |
7.3%* |
Articles on ICF
- Retirement Income ETFs vs. Income Mutual Funds: An Update
09/11/2011
We first compared asset allocation portfolios using dividend ETFs (and bond ETFs) and those using income mutual funds on SeekingAlpha.com Retirement Income Investing: ETFs vs. Mutual Funds more than two months ago. Let's review these two plans: Retirement Income ETFs and Schwab Income Mutual Fund Select List.
Here are the asset classes covered by the two plans:
The list of minor asset classes covered by Retirement Income ETFs The list of minor asset classes covered by Schwab Income Mutual Fund Select List Diversified Emerging Mkts: EEM, VWO, DEM
Emerging Markets Bond: EMB, PCY
Equity Energy: AMJ
Foreign Large Value: PID, IDV
Global Real Estate: RWX
High Yield Bond: HYG
Inflation-protected Bond: TIP
Intermediate Government: IEI
Intermediate-term Bond: CIU, CORP, MBB
Large Blend: VIG
Large Value: DVY, SDY, VYM, FVD
Long Government: IEF, TLT
Long-term Bond: LQD, VCLT
Mid-cap Value: PEY
Miscellaneous Sector: PFF
Muni National Long: MUB
Muni Short: SHM
Real Estate: IYR, ICF, VNQ
Short Government: SHY
Short-term Bond: CSJ, VCSH
World Bond: BWX, WIPEmerging Markets Bond: TGINX
Foreign Large Blend: SICNX, LISOX
Foreign Large Value: AAIPX
High Yield Bond: STHTX, MWHYX
Inflation-protected Bond: ACITX
Intermediate Government: SWGSX, CPTNX
Intermediate-term Bond: SWIIX, SAMFX, PTTDX, PGBOX, MWTRX, FTRFX
Large Blend: SWANX, TICRX, PRBLX
Large Growth: SWLSX, JENSX
Large Value: TWEIX, PQIAX
Mid-cap Blend: NMMCX
Mid-cap Value: ARDEX
Multisector Bond: PONDX
Muni National Interm: SWNTX, TWTIX, STTBX
Muni National Long: NOTEX, ACLVX
Muni Short: FSHIX
Real Estate: CSRSX
Short Government: FIGTX
Short-term Bond: FSTIX, ACSNX
Ultrashort Bond: SIGVX
World Bond: PFODXAsset Class Retirement Income ETFs Schwab Income Mutual Fund Select List REITs 4 1 Fixed Income 19 24 Sector Fund 2 0 Foreign Equity 2 3 Emerging Market Equity 3 0 US Equity 6 9 Other 0 0 Total 36 37 Little in the two plans' investment choice ratings has changed since then. As of Sep 9, 2011, Retirement Income ETFs investment choice is rated as average and Schwab Income Mutual Fund Select List investment choice is rated as above average based on MyPlanIQ Plan Rating methodology that was designed to measure how effective a plan's available investment funds are . It has the following detailed ratings:
Attribute Retirement Income ETFs Schwab Income Mutual Fund Select List Diversification great (95%) great (85%) Fund Quality below average (29%) great (85%) Portfolio Building above average (67%) above average (71%) Overall Rating average (64%) above average (80%)
Performance chart (as of Sep 9, 2011)Performance table (as of Sep 9, 2011)
Portfolio Name 2011 YTD 1Yr AR 1Yr Sharpe 3Yr AR 3Yr Sharpe 5Yr AR 5Yr Sharpe Retirement Income ETFs Tactical Asset Allocation Moderate 2.49% 8% 80% 11% 84% 10% 71% Retirement Income ETFs Strategic Asset Allocation Moderate -1.16% 5% 42% 5% 23% 3% 14% Schwab Income Mutual Fund Select List Tactical Asset Allocation Moderate 3% 9% 84% 11% 101% 10% 92% Schwab Income Mutual Fund Select List Strategic Asset Allocation Moderate -2.11% 4% 35% 4% 27% 3% 16% Refer to detailed portfolio comparison.
Again, we are seeing income ETFs can still rival the well selected income mutual funds. This is a good news for income investors in their IRA investments or taxable account investments. ETFs have more flexibility and have a well defined and simple indexing strategy (isn't this what MyPlanIQ is also doing?).
Disclosure:MyPlanIQ does not have any business relationship with the company or companies mentioned in this article. It does not set up their retirement plans. The performance data of portfolios mentioned above are obtained through historical simulation and are hypothetical.
Symbols: SPX, VIG, DVY, SDY, ICF, RWX, HYG, LQD, IEF, TLT, TIP, AMJ, TWEIX, LISOX, CSRSX, PTTDX, Retirement Investments, IRAs, ETF Portfolios, Portfolio Management, Risk Management, Dividend ETFs
- Portfolio Management: Best of Fixed Income Managers vs. Retirement Income ETFs
09/08/2011
Two defensive investment strategies useful in current stressful times are compared. The first is based on selecting the best bond fund every month or every quarter from a list of bond funds managed by Morningstar's 'Manager of the Year' P Bond Funds Momentum Based on Upgrading Fixed Income Managers of the Year`s Funds Monthly. These funds include PTTRX, TGLMX, WATFX, MWTRX, LSBDX, DODIX, FPNIX.
The second is Retirement Income ETFs that consists of a list of candidate dividend stock and bond ETFs including DVY, EMB, HYG, ICF, IDV, TIP, VIG, VWO.
The conclusion: the Fixed Income Managers of the Year is solid and has lower volatility, a good defensive strategy one should consider. Both of them are better alternatives than a broad based index such as S&P 500 (SPX) or total bond market index (AGG)
Read more from our SeekingAlpha's article:
Defensive Strategies In Stressful Times: The Best Of Fixed Income
Symbols: SPX, DVY, EMB, HYG, ICF, IDV, TIP, VIG, VWO, PTTRX, TGLMX, WATFX, MWTRX, LSBDX, DODIX, FPNIX, Retirement Investing, Dividend Stock, Retirement Income, Portfolio Management
- Does Timing Market Only Work for Pros?
08/12/2011
Wall street Journal recently published an article Timing the Market Works for Some Pros but Is Risky for Average Joe. In the article, the author made the following observations:
- About two-thirds of advisers said they planned to use it (tactical management) more often, based on a survey this spring by insurance company Jefferson National.
- Before the recent market fallout, some advisors wisely lightened up stock exposure, should average investors follow?
- The tactic is risky, especially for armchair investors, and many institutions and advisers are cautioning their clients against making any big changes in their portfolios. (emphasis is ours).
We agree with the assertion that for armchair or undisciplined investors, tactical management is risky as very often, these investors will manage their portfolios inconsistently. For example, considering right now, if an investor liquidate their stock exposure and then forget about it (this indeed occur very often as many of them are already frightened and some of them will never come back to the market), it would be very detrimental to their retirement investment portfolios. If these investors hold on their stocks, stock ETFs or mutual funds, they might suffer from big loss, especially for those who are over exposed to risk assets.
The problem with tactical asset allocation is not it does not work. In fact, it works very well up till now. Many of our tactical portfolios have either lightened up risk asset exposures or switched to some other assets which are still holding relatively well (such as commodities). They have incurred less loss or even positive year to date. The problem is that it requires consistency (20-30 minutes a month, for example). For those who are willing to look after their portfolios once a month or even once a quarter, tactical asset allocation strategy can be very helpful to safe guard your hard earned investments.
For 'armchair' investors, the best bet is a diversified portfolio that requires quarterly or even annual re-balance. Strategic asset allocation portfolios are the ones they should pursue.
As of 8/11/2011, here is the performance comparison for two portfolios:
Portfolio Performance Comparison
Portfolio/Fund Name YTD 1Yr AR 1Yr Sharpe 3Yr AR 3Yr Sharpe 5Yr AR 5Yr Sharpe SPY -5.87% 10% 58% -1% 2% 0% -2% MyPlanIQ Diversified Core Allocation ETF Plan Tactical Asset Allocation Moderate 0.01% 10% 79% 9% 71% 12% 88% MyPlanIQ Diversified Core Allocation ETF Plan Strategic Asset Allocation Moderate 0.7% 11% 96% 5% 26% 7% 35% EFA -7.5% 6% 6% -5% -12% -2% -11% Five Year Chart
MyPlanIQ Diversified Core Allocation ETF Plan consists of 70 funds. These funds enable participants to gain exposure to 6 major assets: US Equity, Commodity, Foreign Equity, REITs, Emerging Market Equity, Fixed Income.
Symbols: SPX, COMP, SPY, EFA, EEM, VTI, IYR, ICF, AGG, DBC, GLD, Retirement Investing, Asset Allocation
- Keep It Simple Stupid -- A Simple Benchmark to Measure Your Investment Returns
04/19/2011
Living on borrowed time: nuclear reactors, oppressive governments, levees that keep out flood waters -- keeping things going -- just one more year. The temptation to delay until next time is very seductive until disaster strikes and the cost to repair, dwarfs the cost to prevent. Many working people put off their retirement investing -- just one more year until it becomes a "hair on fire" problem -- which it now is for baby boomers for whom retirement is a near and present danger.There is an easy to understand strategy that can improve returns with low risk. If you have a portfolio with the correct asset classes represented, over the long term, you will get better results at a lower risk than picking the latest and greatest fund or stock. This is not the bleeding edge of new ideas. This is proven and widely used – being the basis of most money manager’s strategies.
MyPlanIQ created SIB portfolios (Simpler Is Better) – market index funds from key asset classes that can be used to measure historical returns to show the impact of asset class selection rather than fund or stock selection. SIB portfolios for different numbers of asset classes are built and used to benchmark returns. From this, conclusions can be drawn as to what is an effective investment strategy for today.
The following funds were used:
Index Funds Asset Class
Ticker
Name
Large Blend
Vanguard Total Stock Mkt Idx
Foreign Large Blend
VGTSX
Vanguard Total Intl Stock Index
Diversified Emerging Markets
VEIEX
Vanguard Emerging Mkts Stock Idx
Real Estate
VGSIX
Vanguard REIT Index
Commodities Broad Basket
PowerShares DB Commodity Idx Trking Fund
Intermediate-Term Bond
Vanguard Total Bond Market Index
ETF Asset Classes
Ticker
Description
LARGE BLEND
Vanguard Total Stock Market ETF
Foreign Large Blend
Vanguard FTSE All-World ex-US ETF
Diversified Emerging Markets
Vanguard Emerging Markets Stock ETF
Real Estate
Vanguard REIT Index ETF
Commodities Broad Basket
DBC
PowerShares DB Commodity Idx Trking Fund
Intermediate-Term Bond
Vanguard Total Bond Market ETF
Three Asset Class SIB: The three core assets are U.S. and international equities and fixed income. This represents what used to be conventional wisdom: Heavy dependence on the U.S. and the rest of the developed world. With a conservative strategic asset allocation strategy, the portfolio would consist of 60% fixed income and 20% each for U.S. and international equities. With a tactical asset allocation strategy, the fixed income would never be less than 60% but the split of the three asset classes would move based on asset price movement.
Three Core Asset Portfolios
1 year AR
3 year AR
5 year AR
SAA Index
11%
1%
4%
SAA ETF Index
15%
1%
3%
TAA Index
7%
4%
6%
TAA ETF Index
9%
4%
5%
The SAA (buy and hold) strategy represents what many people may end up with. There is little thought put into which asset classes are represented but these are the most likely ones to be covered.
The TAA strategy gives a little higher long term performance because of the ability to move to other asset classes when one aspect of the economy is slowing.It’s clear that world economics has changed; becoming smaller, more interlinked and complex. It’s no longer possible to ignore the impact of emerging markets and we are very aware that real estate has an impact on the economy.
If you are just using three asset classes, you should look to upgrade your portfolio immediately.
Four Asset Class SIB: There are two variants for the four asset class SIB. Either add emerging markets or real estate trusts to the three asset class SIB. Note that the international asset class means established nations such as those in Europe and emerging asset classes are represented by developing nations. With a conservative strategic asset allocation strategy, the portfolio would consist of 60% fixed income and 13.33% each for U.S., international and REIT or emerging market equities. With a tactical asset allocation strategy, the fixed income would never be less than 60% but the split of the three asset classes would move based on asset price movement.
Four Core Asset Portfolios
1 year AR
3 year AR
5 year AR
SAA Em Index
12%
2%
6%
SAA REIT Index
17%
2%
5%
SAA ETF Em
16%
2%
6%
TAA Emerging
11%
7%
10%
TAA REIT
15%
6%
8%
TAA ETF Em
15%
7%
11%
Adding another asset class improves the performance as it balances risk. TAA is also able to increase its long term benefit over SAA as there are more asset classes to move into when one of the asset classes is not performing properly. Choosing between REIT and emerging markets is hard and further diversification is of long term value.
If you are using a four asset class portfolio, you could be doing better. Making the choice between emerging markets and real estate is a tough one.
Five Asset Class SIB: Has been covered in a previous article and the results are included for completeness. The five class SIB takes both REIT and Emerging markets so is a fusion of the two four asset class SIBs.
Five Core Asset Portfolios
1 year AR
3 year AR
5 year AR
SAA Index
15%
3%
5%
SAA ETF
20%
3%
7%
TAA Index
15%
8%
10%
TAA ETF
19%
8%
12%
The five asset class SIB is a strong platform for portfolio creation. It has broad diversification and, with tactical asset allocation, good returns.
If you are using a five asset class portfolio, you are in good shape – but take a look at the six asset class portfolio because it will be increasingly important in the current macro economic climate.
Six Asset Class SIB: The last asset class adds commodities to the portfolio. This gives another type of asset class and will further help diversification
Adding another asset class does not significantly improve the result within the 5 year time frame. It may be asked whether the extra effort of building and managing a six asset class portfolio is worth it. Broader diversification is good, but is it really necessary? In our view, the addition of commodities will be increasingly important as commodities will protect against inflation as the recovery slowly continues and there is increasing inflationary pressure.
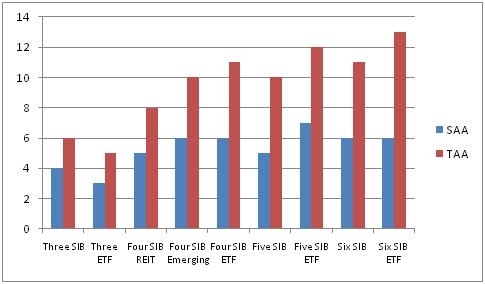
Figure 1 5 Year Annualized Returns for the different SIBs with SAA and TAA strategies
What conclusions can be drawn from this?
-
It’s time to leave a three asset class portfolio in the past. The world is more connected and complex and higher returns require more sophistication
-
Four and five asset class portfolios have fared well and show solid returns but everybody should consider adding commodities in the light of the current economic realities
-
This is not rocket science and you should be able to increase your returns and be in control of improving your returns
-
ETF’s are a very effective vehicle for implementing a SIB strategy and deliver excellent returns compared to the other funds selected
Symbols: AGG, BND, DBC, EEM, EFA, GSG, ICF, IYR, LQD, SPY, TLT, VEU, VNQ, VTI, VWO, VTSMX, VGTSX, VEIEX, VGSIX, VBMFX
Exchange Tickers: (NYSE: AGG), (NYSE: BND), (NYSE: DBC), (NYSE: EEM), (NYSE: EFA), (NYSE: GSG), (NYSE: ICF), (NYSE: IYR), (NYSE: LQD), (NYSE: SPY), (NYSE: TLT), (NYSE: VEU), (NYSE: VNQ), (NYSE: VTI), (NYSE: VWO), (NYSE: VTSMX), (NYSE:VGTSX), (NYSE:VEIEX), (NYSE:VGSIX), (NYSE:VBMFX)
Disclosure:MyPlanIQ does not have any business relationship with the company or companies mentioned in this article. It does not set up their retirement plans. The performance data of portfolios mentioned above are obtained through historical simulation and are hypothetical. -
- Armstrong's Informed Investor Lazy Portfolio Feels The Commodities Pain
04/18/2011
The incidents in Japan, the Middle East and even as far back as New Orleans teach us the danger of living on borrowed time, the reactors, the governments the levees keeping things going -- just one more year. The temptation to delay until next time is very seductive until disaster strikes and the cost to repair, dwarfs the cost to prevent. Many working people put off their retirement investing -- just one more year until it becomes a "hair on fire" problem -- which it now is for baby boomers for whom retirement is a near and present danger.
We continue to examine luminary portfolios to see what we can learn and use to further our investment portfolios.
Frank Armstrong, author of The Informed Investor, proposed this portfolio for an MSN Money article. The two key points of the portfolio are that it has four asset classes (US, International, REIT, Bonds) and relies on market indices rather than active management. The portfolio uses index funds because index funds eliminate manager risk. It overweights small-cap stocks as small-cap stocks have historically outperformed large caps stocks. The portfolio has a strong value tilt, based on the theory that, over the long haul, beaten-down stocks will perform better than high-flying growth stocks.
This should be a low cost, well performing portfolio.
The fund selection for testing the strategy is listed below with the ETF alternatives:
- 9.25% in Vanguard Small Cap Value VISVX (SCZ)
- 9.25% in Vanguard Value VIVAX (SPY, IYY)
- 6.25% in Vanguard Small-Cap Growth VISGX (VBK)
- 6.25% in Vanguard 500 Index VFINX (IVW)
- 31% in Vanguard Total International Stock VGTSX (EFA)
- 8% in Vanguard REIT VGSIX (IYR, VNQ, RWX)
- 30% in Vanguard Short-Term Bond VBISX (BND, AGG)
Things to note about the portfolio:
- This is designed as a lazy portfolio with limited rebalancing specified
- 31% in US equities is significant with a mix of large and small cap stocks
- With 70% in equities, this is a growth portfolio
- REIT is possibly underweighted
- There is no commodity asset class
The chart and table below show the historical performance of moderate model portfolios employing strategic and tactical asset allocation strategies. For comparison purpose, we also include the moderate model portfolios of a typical 6 asset SIB (Simpler Is Better) plan . This SIB plan has the following candidate index funds and their ETFs equivalent: US Equity: SPY or VTI
Commodity: DBC
Foreign Equity: EFA or VEU
REITs: IYR or VNQ or ICF
Emerging Market Equity: EEM or VWO
Fixed Income: AGG or BND
Portfolio Performance Comparison
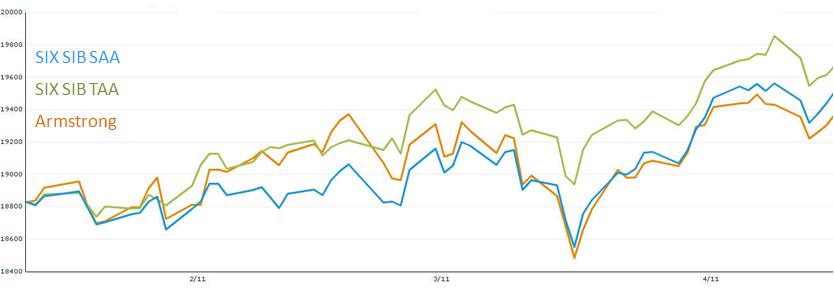
Portfolio/Fund Name 1Yr AR 1Yr Sharpe 3Yr AR 3Yr Sharpe 5Yr AR 5Yr Sharpe Armstrong Original 10% 66% 4% 17% 5% 20% Six Core Asset ETF Benchmark Tactical Asset Allocation Moderate 10% 71% 9% 73% 13% 91% Six Core Asset ETF Benchmark Strategic Asset Allocation Moderate 13% 103% 3% 20% 7% 35% A detailed comparison can be found here
Takeaways
-
2010 was a good year for lazy portfolios and as we continue through 2011while equities are still performing well, not having a commodities option hurts returns
-
TAA has benefits in terms of being able to stay away from some area such as European equities
-
Index funds continue to show good results against managed funds
-
Larger asset class plans have the benefit of stability and good returns
Disclosure: MyPlanIQ does not have any business relationship with the company or companies mentioned in this article. It does not set up their retirement plans. The performance data of portfolios mentioned above are obtained through historical simulation and are hypothetical.
Symbols: VISVX, SCZ, VIVAX, SPY, IYY, VISGX, VBK, VFINX, IVW, VGTSX, EFA, VGSIX, IYR, VNQ, RWX, BND, AGG, DBC, VEU, ICF, EEM, VWO - Leuthold Fund Uses Gold, Silver and Real Estate for Inflation Hedging
04/13/2011
- Schwab Mutual Funds Beat out ETFs
04/06/2011
- Schwab Select ETF Plan Has Bright Prospects
04/06/2011
- Relax: Doing Less With Your Investments
03/30/2011
- Will Harry Browne’s Permanent Portfolio Continue To Work?
03/29/2011
- Accenture 401K Retirement Plan: High Quality and Low Cost Funds with Proper Diversification
03/25/2011
- Tactically Manage An Income Producing Portfolio With Commodity Exposure
03/25/2011
- Japan’s Disasters Slams the Market – What Happens to REIT Now?
03/22/2011
- Commodities Withstood the Recent Market Selloff
03/21/2011
- Earthquakes and Wars Call for Diversification and Tactical Asset Allocation in Investing
03/20/2011
- 'Safe' Assets' Trends Back to Positive: Risk Aversion Began?
03/14/2011
- Major Assets: Risk Assets Strong While Safe Assets Have Negative Trends
03/07/2011
- Commodities Showed Their Hedge Amid Equity Weakness
02/28/2011
- Shell Versus Morningstar -- More is Better
02/27/2011
- Energy Commodities and Gold Strong: Gold's Role in Asset Allocation
02/26/2011
- Apartment Investment and Management Company 401(k) Retirement Plan Report On 12/03/2010
12/03/2010
This report reviews Apartment Investment and Management Company 401(k) Retirement Plan plan. We will discuss the investment choices and present the plan rating by MyPlanIQ. Current economic and market conditions are discussed in the context of the investment portfolios in the plan. We will then show how participants in Apartment Investment and Management Company 401(k) Retirement Plan can achieve reasonable investment results using asset allocation strategies.
Plan Review and Rating
Apartment Investment and Management Company 401(k) Retirement Plan's 401K plan consists of 22 funds. These funds enable participants to gain exposure to 4 major assets: US Equity, Foreign Equity, REITs, Fixed Income. The list of minor asset classes covered:
Foreign Large Growth: EFG
Inflation-protected Bond: TIP
Intermediate-term Bond: AGG, CIU, BIV, BND
Large Blend: IVV, IYY, IWV, VTI, VV, SPY, DLN, RSP, SCHX
Large Growth: IVW, IWZ, JKE, VUG, ELG, QQQQ, RPG, SCHG
Large Value: IVE, IWW, JKF, VTV, ELV, PWV, RPV, SCHV
Mid-cap Blend: IJH, IWR, JKG, VO, MDY, EMM, PJG, DON, EZM, MVV
Real Estate: IYR, ICF, VNQ
Retirement Income:
Small Blend: IJR, IWM, JKJ, VB, DSC, PJM, DES, SAA, UWM, SCHA
Small Growth: IJT, IWO, JKK, VBK, DSG, PWT, RZG, UKK
Small Value: IJS, IWN, JKL, VBR, DSV, PWY, RZV, UVT
Target Date 2000-2010: TZD
Target Date 2016-2020: TZG
Target Date 2026-2030: TZL
Target Date 2036-2040: TZV
Target Date 2050+:
As of Dec 2, 2010, this plan investment choice is rated as based on MyPlanIQ Plan Rating methodology that measures the effectiveness of a plan's available investment funds. It has the following detailed ratings:
Diversification -- Rated as (76%)
Fund Quality -- Rated as (36%)
Portfolio Building -- Rated as (87%)
Overall Rating: (68%)Current Economic and Market Conditions
We have experienced an uncertain 2010: plenty of worries on whether the US economy will climb out of the great recession and recover.
- The Federal Reserve embarked on Quantitative Easing II (QE2) to stimulate the economy.
- The housing market is still at its low but largely stabilized.
- The unemployment rate is stuck at 9%.
Americans continue to face an uncertain future, given (among others) the high unemployment rate, large federal and local government debts and global trade imbalance. With such an economic backdrop, the stock and debt markets are going to be volatile. Despite this, markets have been resilient and appear positioned to rebound.
In this market it is even more critical to properly diversify and respond market changes. MyPlanIQ offers two asset allocation strategies: strategic and tactical asset allocation strategies ( SAA and TAA for participants in Apartment Investment and Management Company 401(k) Retirement Plan).
Strategic Asset Allocation is based on well known modern portfolio theory and its key features include: diversification, proper fund selection and periodically re-balancing.
Tactical Asset Allocation works on a diversified array of assets provided by funds in a plan and adjusts asset mixes based on market conditions such as asset price momentum utilized by TAA.
Portfolio Discussions
The chart and table below show the historical performance of moderate model portfolios employing strategic and tactical asset allocation strategies. For comparison purpose, we also include the moderate model portfolios of a typical 4 asset SIB (Simpler Is Better) plan . This SIB plan has the following candidate index funds and their ETFs equivalent:
US Equity: (SPY or VTI)
Foreign Equity: (EFA or VEU)
REITs: (IYR or VNQ or ICF)
Fixed Income: (AGG or BND)
Performance chart (as of Dec 2, 2010)Performance table (as of Dec 2, 2010)
Portfolio Name 1Yr AR 1Yr Sharpe 3Yr AR 3Yr Sharpe 5Yr AR 5Yr Sharpe Apartment Investment and Management Company 401(k) Retirement Plan Tactical Asset Allocation Moderate 15% 97% 10% 84% 12% 98% Apartment Investment and Management Company 401(k) Retirement Plan Strategic Asset Allocation Moderate 13% 120% 4% 19% 6% 30% Four Core Asset Index Funds REITs Tactical Asset Allocation Moderate 8% 58% 6% 54% 9% 80% Four Core Asset Index Funds REITs Strategic Asset Allocation Moderate 11% 87% 2% 6% 5% 20% Currently, asset classes in US Equity (SPY,VTI), Foreign Equity (EFA,VEU) and REITs (IYR,VNQ,ICF) are doing relatively well. These asset classes are available to Apartment Investment and Management Company 401(k) Retirement Plan participants.
To summarize, Apartment Investment and Management Company 401(k) Retirement Plan plan participants can achieve reasonable investment returns by adopting asset allocation strategies that are tailored to their risk profiles.
Symbols: AIV , SPY , VTI , EFA , VEU , IYR , VNQ , ICF , AGG , BND , CIU , BIV , EFG , IVE , IWW , JKF , VTV , ELV , PWV , RPV , SCHV , TZD , TZG , TZL , TZV , IVV , IYY , IWV , VV , DLN , RSP , SCHX , IVW , IWZ , JKE , VUG , ELG , QQQQ , RPG , SCHG , IJH , IWR , JKG , VO , MDY , EMM , PJG , DON , EZM , MVV , IJS , IWN , JKL , VBR , DSV , PWY , RZV , UVT , IJR , IWM , JKJ , VB , DSC , PJM , DES , SAA , UWM , SCHA , IJT , IWO , JKK , VBK , DSG , PWT , RZG , UKK , TIP
- Apache Design Solutions 401K Report On 12/03/2010
12/03/2010
- Peabody Investments Corp.Employee Retirement Account Report On 12/03/2010
12/03/2010
- Vanguard Variable Annuity Report On 12/06/2010
12/06/2010
- TD Ameritrade Commission Free ETFs Report On 12/07/2010
12/07/2010
- Vanguard-VA-Clone Report On 12/07/2010
12/07/2010