 |
Vanguard ETF: |  |
7.4%* |
|
Diversified Core: | |
8.1%* |
|
Six Core Asset ETFs: | |
7.3%* |
Articles on XLB
- US Sectors Favor Telecom, Healthcare
05/10/2011
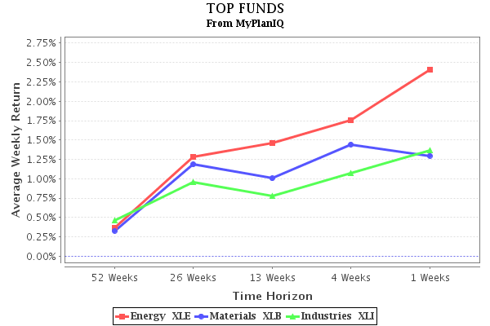
The US Economy is divided into various Sectors. Sector are classified as General Segments of the economy within which a large group of companies can be categorized. Overall the US sectors shows good performance last year except for financial companies. The sectors that show substantial growth are energy, material and telecom industries.
Energy (XLE) returns dropped recently due to profit taking. Crude oil prices are currently at their highest level since 2008. The US Energy Information Association (EIA) predicted that oil markets will continue to tighten over the next two years due to slow growth from non-OPEC countries. Due to these events we expect the drawdown in global petroleum stocks and an increase in production demand from the OPEC countries, another reason for reducing crude oil production is the recent Libya and Middle East conflict which will disrupt the crude oil supply globally. We are expecting good growth in the energy sector as the total demand of oil grows by an annual average of 1.5 million bbl/d in 2011 and 2012.
We believe IYZ will continue to grow slowly this year. Economists and portfolio managers are moving towards technology with demands for new products as well as telecommunications providers with dividends and earnings growth. The returns are not impressive although steady in nature. Worldwide the demand of technology and telecommunication related products are gaining popularity making this sector interesting.
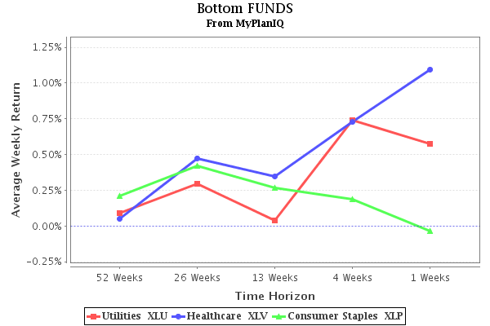
XLV prospects appear bright as there is a surge as the population ages and healthcare expects to double by 2018.
XLF still remain down while the things gradually improve: XLF growth is expected to be meager in 2011 but the things will improve in 2012 – 13.
The trend score is defined as the average of 1,4,13,26 and 52 week total returns (including dividend reinvested).Assets Class Symbols 05/06
Trend
Score04/29
Trend
ScoreDirection Telecom IYZ 11.63% 10.44% ^ Healthcare XLV 10.93% 10.5% ^ Industries XLI 9.92% 11.4% v Energy XLE 9.47% 17.92% v Consumer Discretionary XLY 9.37% 9.76% v Consumer Staples XLP 8.43% 8.95% v Utilities XLU 7.14% 6.48% ^ Materials XLB 6.91% 10.93% v Technology XLK 6.08% 6.94% v Financial XLF 1.08% 3.51% v Trend Rankings: The trend table ranks each of the ten U.S. industrial iShares ETFs and the score is based on the following formula: for an ETF or index, we use the average of 1, 4, 13, 26 and 52 week total returns (i.e. dividend and distribution reinvested). Notice the average of the total returns would overweight the recent price movement. This is similar to exponential moving average.
One concern: The recovery of the economy will face challenges in upcoming months as they battle huge debt. S&P recently showed concern revising US credit rating. The current administration is making plans to cut the deficit which may lead to austerity programs that could affect the overall momentum of these sectors.
Symbols: XLY, IYZ, XLI, XLB, XLK, XLE, XLF, XLP, XLU, XLV
Disclosure:
MyPlanIQ does not have any business relationship with the company or companies mentioned in this article. It does not set up their retirement plans. The performance data of portfolios mentioned above are obtained through historical simulation and are hypothetical.
- XLE The Clear Sector Leader
05/03/2011
In a retirement account, Sector investing can be very worthwhile. It can lead to portfolio returns that “beat the market”. Sectors offer a way of focusing, in a disciplined fashion, similar to looking at Countries, or broad markets. At any given point in time, one or more sectors may be out performing other sectors, and the broad stock market. Portfolios that include Sector allocation can capture this performance.
A great way to get sector exposure is through exchange traded funds. Today, there are numerous 'sector' type exchange traded funds that you can invest in. The iShares and the SPDR lineups are probably the two most popular. However there are several other providers that offer unique and interesting sector and industry ETFs.
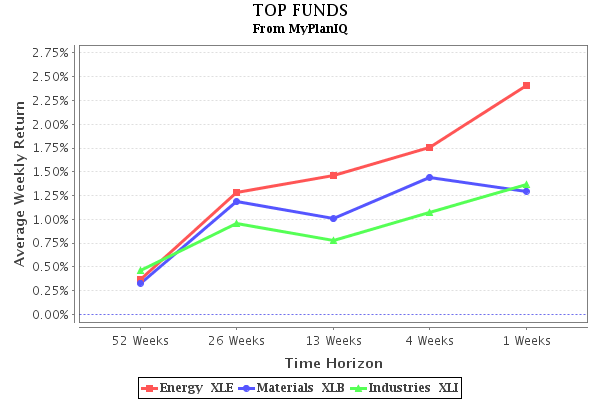
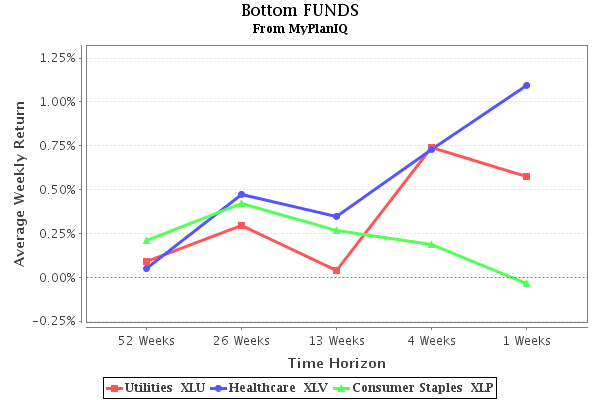
Below is the Sector performance table, sorted by “Trend Score”, which is also posted at MyPlanIQ - Global Trends .
US Sectors TrendPerformance data are based on closing prices on April 29th 2011
Description
Symbol
1 Week
4 Weeks
13 Weeks
26 Weeks
52 Weeks
Trend Score
Energy
1.9%
0.61%
13.56%
36.92%
36.63%
17.92%
Industries
2.84%
1.9%
8.48%
21.41%
22.37%
11.4%
Materials
1.04%
1.74%
8.45%
18.79%
24.64%
10.93%
Healthcare
2.89%
5.89%
11.99%
14.16%
17.58%
10.5%
Telecom
1.95%
2.63%
7.69%
14.23%
25.69%
10.44%
Consumer Discretionary
1.6%
3.18%
9.67%
16.07%
18.29%
9.76%
Consumer Staples
2.01%
4.82%
9.38%
11.14%
17.39%
8.95%
Technology
1.48%
2.81%
3.87%
10.58%
15.95%
6.94%
Utilities
2.85%
3.24%
5.8%
6.83%
13.65%
6.48%
Financial
1.74%
-0.91%
1.06%
13.2%
2.44%
3.51%
The trend score is defined as the average of 1,4,13,26 and 52 week total returns (including dividend reinvested).
With all of the headline news lately, it is no surprise that the Energy Sector ETFs are the strongest. The holdings inside the ETFs usually include the large cap oil companies such as Exxon and Chevron, and, some of the smaller cap companies. When crude oil, and petroleum product prices rise, usually the margins of the oil companies expand. An example could be the cost of production of a barrel of crude stays relatively fixed, as the selling price of the barrel of crude goes higher. Similarly, some of the costs of refining a gallon of gasoline stay relatively fixed, as the selling price of that gallon goes higher.
These energy sector ETFs are definitely on my retirement portfolio watch list this year.
Disclosure: MyPlanIQ does not have any business relationship with the company or companies mentioned in this article. It does not set up their retirement plans. The performance data of portfolios mentioned above are obtained through historical simulation and are hypothetical.
Exchange Tickers: (NYSE:XLE), (NYSE:XLI), (NYSE:XLB), (NYSE:XLV), (NYSE:IYZ), (NYSE:XLY), (NYSE:XLP), (NYSE:XLK), (NYSE:XLU), (NYSE:XLF)
- Schwab Select ETF Plan Has Bright Prospects
04/06/2011
Schwab ETF Plan Has Good Pedigree and Bright Prospects Retirement is now a "hair on fire" problem. There is much talk of working longer, downsizing, living on less. However, there is something you can do to help improve your risk adjusted returns. Look at your portfolios and plans to build a diversified portfolio with a systematic investment strategy.
This is not as hard as you might think -- to highlight this point, we feature a plan created by a non professional that matches up well with any of the other plans. Kevin Carr. is an individual investor who employs a long term strategy. He manages an individual common stock portfolio as well as many plans on MyPlan IQ. If you have any questions regarding this plan please contact him.
This plan provides you with Schwab's experts’ top picks of low-cost ETFs representing approximately 50 ETFs, based on rigorous criteria including expenses, tracking error, trading volume, and more. Schwab ETFs trade commission free. There are no redemption periods so you can start today and not worry about holding periods.We report on this Schwab ETF Select List which consists of 49 funds. These funds give exposure to 6 major assets: US Equity, Commodity, Foreign Equity, REITs, Emerging Market Equity, Fixed Income.
Asset Class Ticker Name LARGE BLEND SCHX Schwab U.S. Large-Cap ETF LARGE GROWTH SCHG Schwab U.S. Large-Cap Growth ETF LARGE VALUE SCHV Schwab U.S. Large-Cap Value ETF MID-CAP BLEND VO Vanguard Mid-Cap ETF Mid-Cap Growth VOT Vanguard Mid-Cap Growth ETF MID-CAP VALUE VOE Vanguard Mid-Cap Value ETF SMALL BLEND SCHA Schwab U.S. Small-Cap ETF Small Growth VBK Vanguard Small Cap Growth ETF SMALL VALUE VBR Vanguard Small Cap Value ETF LARGE BLEND SCHB Schwab U.S. Broad Market ETF LARGE VALUE VYM Vanguard High Dividend Yield Indx ETF Foreign Large Blend SCHF Schwab International Equity ETF Foreign Large Growth EFG iShares MSCI EAFE Growth Index Foreign Large Value EFV iShares MSCI EAFE Value Index FOREIGN SMALL/MID GROWTH SCHC Schwab International Small-Cap Eq ETF DIVERSIFIED EMERGING MKTS SCHE Schwab Emerging Markets Equity ETF Foreign Large Blend VEU Vanguard FTSE All-World ex-US ETF WORLD STOCK VT Vanguard Total World Stock Index ETF EUROPE STOCK VGK Vanguard European ETF DIVERSIFIED PACIFIC/ASIA VPL Vanguard Pacific Stock ETF JAPAN STOCK EWJ iShares MSCI Japan Index China Region GXC SPDR S&P China Intermediate-Term Bond BND Vanguard Total Bond Market ETF SHORT GOVERNMENT SCHO Schwab Short-Term U.S. Treasury ETF Intermediate Government SCHR Schwab Intermediate-Term U.S. Trsy ETF LONG GOVERNMENT TLH iShares Barclays 10-20 Year Treasury Bd Inflation-Protected Bond SCHP Schwab U.S. TIPS ETF Intermediate-Term Bond CIU iShares Barclays Intermediate Credit Bd High Yield Bond JNK SPDR Barclays Capital High Yield Bond WORLD BOND BWX SPDR Barclays Capital Intl Treasury Bond Muni National Long MUB iShares S&P National AMT-Free Muni Bd Consumer Discretionary XLY Consumer Discret Select Sector SPDR Consumer Staples XLP Consumer Staples Select Sector SPDR Equity Energy XLE Energy Select Sector SPDR Financial XLF Financial Select Sector SPDR Health XLV Health Care Select Sector SPDR Industrials XLI Industrial Select Sector SPDR Natural Resources XLB Materials Select Sector SPDR Technology XLK Technology Select Sector SPDR Communications IYZ iShares Dow Jones US Telecom Utilities XLU Utilities Select Sector SPDR COMMODITIES BROAD BASKET DBC PowerShares DB Commodity Index Tracking Commodities Agriculture DBA PowerShares DB Agriculture Commodities Precious Metals IAU iShares Gold Trust Commodities Industrial Metals DBB PowerShares DB Base Metals Commodities Energy USL United States 12 Month Oil MISCELLANEOUS SECTOR PFF iShares S&P U.S. Preferred Stock Index REAL ESTATE VNQ Vanguard REIT Index ETF Asset Class Number of funds Balanced Fund 0 REITs 1 Fixed Income 9 Commodity 5 Sector Fund 11 Foreign Equity 8 Emerging Market Equity 3 US Equity 11 Other 1 Total 49 Many are looking for access to a well rounded ETF plan through Schwab. This fills this hole and as Schwab makes more of their own funds available, it will be possible to move them into the plan. On this review, the only comment would be to add another REIT choice. The other asset classes have a good number of selections without being overwhelming.
As of Apr 4, 2011, this plan investment choice is rated as above average based on MyPlanIQ Plan Rating methodology that was designed to measure how effective a plan's available investment funds are . It has the following detailed ratings:
Diversification -- Rated as great (99%)
Fund Quality -- Rated as average (47%)
Portfolio Building -- Rated as average (56%)
Overall Rating: above average (66%)
Thehigh diversification score means that all the major and minor asset classes have been ticked. Fund quality is lower because some of the ETF's don't have a long history but that shouldn't impede the ability for the future.
Portfolio Discussions
The chart and table below show the historical performance of moderate model portfolios employing strategic and tactical asset allocation strategies. For comparison purpose, we also include the moderate model portfolios of a typical 6 asset SIB (Simpler Is Better) plan . This SIB plan has the following candidate index funds and their ETFs equivalent:
US Equity: SPY or VTI
Commodity: DBC
Foreign Equity: EFA or VEU
REITs: IYR or VNQ or ICF
Emerging Market Equity: EEM or VWO
Fixed Income: AGG or BND
Performance chart (as of Apr 4, 2011)Performance table (as of Apr 4, 2011)
Portfolio Name 1Yr AR 1Yr Sharpe 3Yr AR 3Yr Sharpe 5Yr AR 5Yr Sharpe Schwab ETF Select List Tactical Asset Allocation Moderate 9% 82% 8% 72% 12% 89% Schwab ETF Select List Strategic Asset Allocation Moderate 14% 118% 3% 15% 4% 20% Six Core Asset ETF Benchmark Tactical Asset Allocation Moderate 9% 81% 10% 82% 13% 89% Six Core Asset ETF Benchmark Strategic Asset Allocation Moderate 14% 121% 4% 20% 7% 34%
This portfolio performs well against the six asset ETF benchmark- SAA provides lower volatility while albeit delivering lower historical returns but as more of the newer funds are applied to the portfolio, there will be more opportunity for closing the gap
- The TAA portfolios run neck and neck over the five year period
In a future article, we will review performance over the last three months to see how the plan has performed in the light of recent events.
Kay Takeaways- Building a plan of funds is not the preserve of the few -- anybody who has the interest and application to research can provide well constructed plans
- It is possible to benefit from those individuals while still having transparency and not being captive to any particular broker
Symbols: SPY, VTI, EFA, VEU, EEM, VWO, IYR, VNQ, ICF, AGG, BND, DBC, HYG, JNK, PHB, CIU, BIV, MUB, TFI, PZA, MLN, GII, PUI, DBU, RYU, UPW, IYH, IXJ, VHT, XBI, PBE, DBR, RYH, EFG, IXP, PTE, DGG, LTL, IYM, IGE, VAW, XLB, XME, PYZ, DBN, RTM, UYM, MTK, PTF, DBT, RYT, ROM, GWL, PFA, IVE, IWW, JKF, VTV, ELV, PWV, RPV, SCHV, EFV, PID, DWM, IYF, VFH, IPF, PFI, DRF, RYF, KXI, VDC, PSL, DPN, RHS, RXI, VCR, IYJ, EXI, VIS, IGOV, BWX, WIP, IVV, IYY, IWV, VV, DLN, RSP, SCHX, IOO, VT, SHY, SHV, VGSH, PLK, USY, TLT, TLH, IEF, EDV, VGLT, TLO, PLW, IEV, VGK, PEF, DEB, IVW, IWZ, JKE, VUG, ELG, QQQQ, RPG, SCHG, IJJ, IWS, JKI, VOE, EMV, PWP, RFV, UVU, IJH, IWR, JKG, VO, MDY, EMM, PJG, DON, EZM, MVV, IFSM, VSS, SCHC, IJS, IWN, JKL, VBR, DSV, PWY, RZV, UVT, IJR, IWM, JKJ, VB, DSC, PJM, DES, SAA, UWM, SCHA, GMM, PXH, DEM, SCHE, ITE, IXC, IPW, DBE, RYE, DKA, IEI, VGIT, IJK, IWP, VOT, EMG, PWJ, RFG, UKW, IJT, IWO, JKK, VBK, DSG, PWT, RZG, UKK, TIP, EPP, VPL, GMF, PAF, EWJ, JPP, PJO, DXJ, GSG
Disclosure:
MyPlanIQ does not have any business relationship with the company or companies mentioned in this article. It does not set up their retirement plans. The performance data of portfolios mentioned above are obtained through historical simulation and are hypothetical.
- Schwab ETF Select List Plan Offers Diversification and High Quality Fund Selection
03/16/2011
by Kevin Carr, A MyPlanIQ Expert User
On March 9, 2011, Charles Schwab announced the release of the ETF Select List. The quarterly Schwab ETF Select List was created by Charles Schwab Investment Advisory, Inc. and is a filtered list of all of the ETFs in the marketplace, highlighting pre-screened, low-cost ETFs. Schwab used quantitative and qualitative screens to filter each ETF and build the list, covering 6 major asset categories and 45 minor asset categories. All ETFs, including Schwab ETFs, are evaluated using the same criteria and broken into sectors for US Equity, Foreign Equity, Emerging Market Equity, Fixed Income, Commodity and REITs.
The ETF Select List gives investors a choice of low-cost, pre-screened ETFs. Schwab highlights just one ETF in each category, chosen based on specific criteria including expense ratio, risk, structure and how well it fits into its category. To make the list, an ETF has to meet minimum criteria that include assets under management, including narrowness of index, trading volume, bid/ask volatility, risk, annualized cost of ownership, fund structure and fit within a given category. The list excludes exchange-traded notes (ETNs), inverse or leveraged ETFs, actively managed ETFs, and unmanaged baskets of securities.
While the ETF Select List has only been out a few days, I constructed a plan on MyPlanIQ platform. The Schwab ETF Select List has no redemption periods, is commission efficient and offers low expenses.
As of March 13, the Schwab ETF Select List Plan has a four star investment menu rating with a 99% diversification score and an overall above average investment choice based on MyPlanIQ Plan Rating methodology . The Plan Rating methodology is designed to measure how effective a plan’s available funds are using key factors such as diversification, fund quality and portfolio building.
Attribute Schwab ETF Select List Six Core Asset ETF Benchmark Diversification great (99%) average (63%) Fund Quality above average (70%) below average (23%) Portfolio Building average (53%) above average (70%) Overall Rating above average (72%) average (54%) The chart and table below show the historical performance of moderate model portfolios employing strategic and tactical asset allocation strategies (SAA and TAA , both provided by MyPlanIQ). For comparison purpose, we also include the moderate model portfolios of a typical 6 asset SIB (Simpler Is Better) plan . This SIB plan has the following candidate index funds and their ETFs equivalent:
US Equity: SPY or VTI
Commodity: DBC
Foreign Equity: EFA or VEU
REITs: IYR or VNQ or ICF
Emerging Market Equity: EEM or VWO
Fixed Income: AGG or BND
Performance chart (as of Mar 15, 2011)Performance table (as of Mar 15, 2011)
Portfolio Name 1Yr AR 1Yr Sharpe 3Yr AR 3Yr Sharpe 5Yr AR 5Yr Sharpe Schwab ETF Select List Tactical Asset Allocation Moderate 9% 88% 6% 57% 12% 91% Schwab ETF Select List Strategic Asset Allocation Moderate 11% 114% 3% 15% 4% 19% Six Core Asset ETF Benchmark Tactical Asset Allocation Moderate 9% 86% 8% 65% 12% 88% Six Core Asset ETF Benchmark Strategic Asset Allocation Moderate 12% 113% 4% 17% 6% 32% Currently Commodities, Real Estate and US Equity are doing well. These asset classes are available to Schwab ETF Select List participants.
To Summarize, Schwab ETF Select List Plan offers wide diversification, high quality funds with low expenses. compared with other brokerage supported ETF plans, it is very favorable. From time to time, we will review the plan.
Symbols:DBC,DBA,IAU,DBB,USL,PFF,VNQ,XLY,XLP,XLE,XLF,XLV,XLI,XLB,XLK,IYZ,XLU,BND,SCHO,SCHR,TLH,SCHP,CIU,JNK,BWX,MUB,SCHF,EFG,EFV,SCHC,SCHE,VEU,VT,VGK,VPL,EWJ,GXC,SCHX,SCHG,SCHV,VO,VOT,VOE,SCHA,VBK,VBR,SCHB,VYM,
Symbols (exchange): (DBC),(DBA),(IAU),(DBB),(USL),(PFF),(VNQ),(XLY),(XLP),(XLE),(XLF),(XLV),(XLI),(XLB),(XLK),(IYZ),(XLU),(BND),(SCHO),(SCHR),(TLH),(SCHP),(CIU),(JNK),(BWX),(MUB),(SCHF),(EFG),(EFV),(SCHC),(
SCHE),(VEU),(VT),(VGK),(VPL),(EWJ),(GXC),(SCHX),(SCHG),(SCHV),(VO),(VOT),(VOE),(SCHA),(VBK),(VBR),(SCHB),(VYM) - Rising Energy Costs: Casting a Cloud over Energy-Dependent Sector ETFs
01/15/2011
The relative performance among sector ETFs remained largely unchanged last week, with energy (XLE) retaining its top spot. However, we saw a broad-based drop in trend scores across sectors. Marking a shift in sentiment, consumer discretionary (XLY) dropped to the fourth spot from being second a week ago. By examining the following table, one can gain critical insights into how to build portfolios at the sector level:
Assets Class
Symbols
01/12
Trend
Score01/05
Trend
ScoreDirection
Energy
XLE
16.21%
14.72%
^
Materials
XLB
13.6%
14.24%
v
Industrials
XLI
12.87%
14.01%
v
Consumer Discretionary
XLY
12.11%
14.32%
v
Technology
XLK
9.71%
10.35%
v
Telecom
IYZ
8.74%
13.08%
v
Financial
XLF
8.08%
9.88%
v
Consumer Staples
XLP
5.21%
6.52%
v
Healthcare
XLV
4.68%
5.18%
v
Utilities
XLU
3.25%
3.65%
v
Fundamentals are improving the in the financial sector (XLF), with industry bellwether J.P. Morgan Chase reporting record-breaking profits on Friday. As credit condition has improved, delinquencies have dropped and lending activities are picking up. The industry is still facing headwinds. Litigations centered on mortgage buyback and still weak housing markets will post pressure on the margins.
Energy (XLE) was lifted by rising oil prices. Along with the sharp rise in demand for heating oil and naturals gas driven by the severe winter conditions in the Northeast, the closure of the Trans-Alaska pipeline has helped push oil past $91. One may ask the question of whether rising energy costs would post a thread to the economic recovery and how this would affect the dynamics in sectors (e.g. industrials (XLI), consumer (XLY)) that are exposed to the volatile oil market and that require large energy input.
Some economists have suggested as the U.S. economy becomes more service oriented, with energy costs accounting for less in the overall cost structure of the economy, rising oil prices would have little effect on the overall economy. That said, it’s crucial to recognize that rising energy costs would certainly affect consumer behavior and business spending at least in the short run. Therefore, identifying sectors that would be negatively affected in an event of oil shock is critically important when building a portfolio at the sector level.For more detailed total return performance, please see here.
labels:investment,
Symbols:XLY,IYZ,XLI,XLB,XLK,XLE,XLF,XLP,XLU,XLV,SPY,QQQQ,IWM,MDY,EFA,VEU,EEM,VWO,IYR,ICF,VNQ,GSG,DBC,DBA,USO,LQD,CSJ,CIU,HYG,JNK,PHB,TLT,IEF,SHY,SHV,BND,AGG,MUB,MBB,
- Most U.S. Sector End Sharply Higher For The Year
01/01/2011
- U.S. Sectors Trend: Cautious Gains Amid Mixed Catalyst
12/19/2010
- Samsung's Excellent 401K Plan, Pushes the ETF Benchmark Hard
12/14/2010
- U.S. Sectors Up on Economic Hopes
12/11/2010
- Allegheny Ludlum Corporation 401K Plan Is Rated As Above Average
12/06/2010
- Apache Design Solutions 401K Is Good For Diversification Purpose
12/06/2010
- US Sectors Nov 29
11/30/2010
- Can we Beat Morningstar Bond Managers with ETF's
11/26/2010
- US Sectors Up Across the Board
11/23/2010
- Top US Sectors Weather the week well -- bottom half feels the pain
11/19/2010
- ETFs Provide Insight Into U.S. Sectors' Performance
11/12/2010
- Top Tier ETF Broker Finalists
10/28/2010
- Apache Design Solutions 401K Report On 12/03/2010
12/03/2010
This report reviews Apache Design Solutions 401K plan. We will discuss the investment choices and present the plan rating by MyPlanIQ. Current economic and market conditions are discussed in the context of the investment portfolios in the plan. We will then show how participants in Apache Design Solutions 401K can achieve reasonable investment results using asset allocation strategies.
Plan Review and Rating
Apache Design Solutions 401K's 401K plan consists of 42 funds. These funds enable participants to gain exposure to 5 major assets: US Equity, Foreign Equity, REITs, Emerging Market Equity, Fixed Income. The list of minor asset classes covered:
Conservative Allocation: AOK
Diversified Emerging Mkts: EEM, GMM, PXH, DEM, SCHE
Foreign Large Blend: EFA, VEU, GWL, PFA
Foreign Small/mid Growth: IFSM, VSS, SCHC
Health: IYH, IXJ, VHT, XBI, PBE, DBR, RYH
Intermediate Government: IEI, VGIT, ITE
Intermediate-term Bond: AGG, CIU, BIV, BND
Large Blend: IVV, IYY, IWV, VTI, VV, SPY, DLN, RSP, SCHX
Large Growth: IVW, IWZ, JKE, VUG, ELG, QQQQ, RPG, SCHG
Large Value: IVE, IWW, JKF, VTV, ELV, PWV, RPV, SCHV
Mid-cap Growth: IJK, IWP, VOT, EMG, PWJ, RFG, UKW
Mid-cap Value: IJJ, IWS, JKI, VOE, EMV, PWP, RFV, UVU
Moderate Allocation: AOM
Natural Resources: IYM, IGE, VAW, XLB, XME, PYZ, DBN, RTM, UYM
Real Estate: IYR, ICF, VNQ
Retirement Income:
Small Blend: IJR, IWM, JKJ, VB, DSC, PJM, DES, SAA, UWM, SCHA
Small Growth: IJT, IWO, JKK, VBK, DSG, PWT, RZG, UKK
Small Value: IJS, IWN, JKL, VBR, DSV, PWY, RZV, UVT
Target Date 2016-2020: TZG
Target Date 2026-2030: TZL
Target Date 2036-2040: TZV
World Stock: IOO, VT
As of Dec 2, 2010, this plan investment choice is rated as based on MyPlanIQ Plan Rating methodology that measures the effectiveness of a plan's available investment funds. It has the following detailed ratings:
Diversification -- Rated as (85%)
Fund Quality -- Rated as (18%)
Portfolio Building -- Rated as (79%)
Overall Rating: (62%)Current Economic and Market Conditions
We have experienced an uncertain 2010: plenty of worries on whether the US economy will climb out of the great recession and recover.
- The Federal Reserve embarked on Quantitative Easing II (QE2) to stimulate the economy.
- The housing market is still at its low but largely stabilized.
- The unemployment rate is stuck at 9%.
Americans continue to face an uncertain future, given (among others) the high unemployment rate, large federal and local government debts and global trade imbalance. With such an economic backdrop, the stock and debt markets are going to be volatile. Despite this, markets have been resilient and appear positioned to rebound.
In this market it is even more critical to properly diversify and respond market changes. MyPlanIQ offers two asset allocation strategies: strategic and tactical asset allocation strategies ( SAA and TAA for participants in Apache Design Solutions 401K).
Strategic Asset Allocation is based on well known modern portfolio theory and its key features include: diversification, proper fund selection and periodically re-balancing.
Tactical Asset Allocation works on a diversified array of assets provided by funds in a plan and adjusts asset mixes based on market conditions such as asset price momentum utilized by TAA.
Portfolio Discussions
The chart and table below show the historical performance of moderate model portfolios employing strategic and tactical asset allocation strategies. For comparison purpose, we also include the moderate model portfolios of a typical 5 asset SIB (Simpler Is Better) plan . This SIB plan has the following candidate index funds and their ETFs equivalent:
US Equity: (SPY or VTI)
Foreign Equity: (EFA or VEU)
Emerging Market Equity: (EEM or VWO)
REITs: (IYR or VNQ or ICF)
Fixed Income: (AGG or BND)
Performance chart (as of Dec 2, 2010)Performance table (as of Dec 2, 2010)
Portfolio Name 1Yr AR 1Yr Sharpe 3Yr AR 3Yr Sharpe 5Yr AR 5Yr Sharpe Apache Design Solutions 401K Tactical Asset Allocation Moderate 15% 100% 8% 64% 11% 81% Apache Design Solutions 401K Strategic Asset Allocation Moderate 16% 155% 4% 22% 8% 44% Five Core Asset Index ETF Funds Tactical Asset Allocation Moderate 9% 59% 7% 57% 14% 94% Five Core Asset Index ETF Funds Strategic Asset Allocation Moderate 12% 95% 4% 14% 8% 35% Currently, asset classes in US Equity (SPY,VTI) and Emerging Market Equity (EEM,VWO) are doing relatively well. These asset classes are available to Apache Design Solutions 401K participants.
To summarize, Apache Design Solutions 401K plan participants can achieve reasonable investment returns by adopting asset allocation strategies that are tailored to their risk profiles.
Symbols: APA , SPY , VTI , EFA , VEU , EEM , VWO , IYR , VNQ , ICF , AGG , BND , AOM , AOK , CIU , BIV , IYH , IXJ , VHT , XBI , PBE , DBR , RYH , IYM , IGE , VAW , XLB , XME , PYZ , DBN , RTM , UYM , GWL , PFA , IVE , IWW , JKF , VTV , ELV , PWV , RPV , SCHV , TZG , TZL , TZV , IVV , IYY , IWV , VV , DLN , RSP , SCHX , IOO , VT , IVW , IWZ , JKE , VUG , ELG , QQQQ , RPG , SCHG , IJJ , IWS , JKI , VOE , EMV , PWP , RFV , UVU , IFSM , VSS , SCHC , IJS , IWN , JKL , VBR , DSV , PWY , RZV , UVT , IJR , IWM , JKJ , VB , DSC , PJM , DES , SAA , UWM , SCHA , GMM , PXH , DEM , SCHE , IEI , VGIT , ITE , IJK , IWP , VOT , EMG , PWJ , RFG , UKW , IJT , IWO , JKK , VBK , DSG , PWT , RZG , UKK
- Allegheny Ludlum Corporation Personal Retirement and 401(k) Savings Account Plan Report On 12/03/2010
12/03/2010