Can we Beat Morningstar Bond Managers with ETF's
11/26/2010 0 comments
In a previous article we questioned conventional wisdom that risk based assets as the main engine of portfolio growth. We presented a simple investment strategy -- pick the top seven bond managers and own the top performing bond fund which you review on a monthly basis (or quarterly if you prefer).
Currently, the top seven are:
|
Bond Fund |
Ticker |
|
PIMCO Total Return |
|
|
TCW Total Return Bond |
|
|
Western Asset Core Bond |
|
|
Metropolitan West Total Return Bond |
|
|
Loomis Sayles Bond |
|
|
Dodge & Cox Income |
|
|
FPA New Income |
In this article, we examine other bond only plans and see if the results can compete.
There are two other portfolios we present.
Goldman Sachs Global Tactical Asset Allocation:This is a cross-asset (or multi-asset) momentum based tactical asset allocation. This is based on a published report by Goldman Sachs on some of their funds. This is a simplified interpretation of strategies proposed by Goldman Sachs on Global Tactical Asset Allocation. The original strategy is based on the following:
- Among six asset classes: US equity (represented by ETF S&P 500 Spider SPY), International equity (represented by MSCI ETF EFA), Real Estate (represented by NAREI ETF IYR), Commodities (represented by Goldman Sachs commodity index ETF GSG), US aggregate bond (represented by ETF AGG), cash, simply calculate the previous 12 month return at year end.
- Rank the year end returns among these 6 assets.
- Choose the top 3 assets and invest these top 3 assets for the next year in equal money amount.
We have modified this by removing all the risk based assets and replaced the aggregate bonds with US long term treasury bond fund. In addition, any asset has to have the score higher than CASH to qualify for the purchase.
This allows the best bond funds to be selected based on their momentum.
TDA Ameritrade's Commission Free ETFs
We recently reviewed their plan with over 100 commission free ETFs. We use this plan but drove the strategy to select only bond funds using MyPlanIQ's tactical asset allocation.
Given that some of the ETFs don't have a long history, we only went back to 2007. It is possible to see the impact of the strategies b
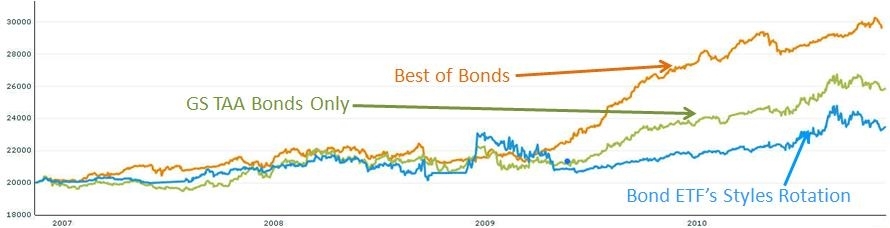 Portfolio Performance Comparison
| Portfolio Name | 1Yr AR | 1Yr Sharpe | 3Yr AR | 3Yr Sharpe | 5Yr AR | 5Yr Sharpe |
|---|---|---|---|---|---|---|
| Best of Bonds (BoB) | 9% | 194% | 12% | 199% | 11% | 165% |
| Bond ETFs | 8% | 86% | 4% | 38% | 4% | 33% |
| Gold-Sachs-Bonds-TAA | 9% | 123% | 7% | 88% | 6% | 68% |
Click for full details
Looking over a five year horizon, it is clear that BoB delivers the best results by quite a margin. In the shorter term, the results are much closer and as more fixed income ETF's become established and liquid, it will be worth watching and paying a return visit to look at returns in the future.
For now, the simplicity of the approach and the strength of the results leave BoB out in front. In this case, actively managed funds appear to beat the index funds.
labels:investment,
Symbols:SPY,VTI,EFA,VEU,EEM,VWO,IYR,VNQ,ICF,AGG,BND,HYG,JNK,PHB,CIU,BIV,GII,PUI,DBU,RYU,UPW,IYH,IXJ,VHT,XBI,PBE,DBR,RYH,IXP,PTE,DGG,LTL,IYM,IGE,VAW,XLB,XME,PYZ,DBN,RTM,UYM,MTK,PTF,DBT,RYT,ROM,GWL,PFA,IVE,IWW,JKF,VTV,ELV,PWV,RPV,SCHV,IYF,VFH,IPF,PFI,DRF,RYF,KXI,
comments 0
Or Start FREE 30-day trial now >>
