Most U.S. Sector End Sharply Higher For The Year
01/01/2011 0 comments
MyPlanIQ tracks detailed weekly U.S. sectors trend movements. We use ETFs that represent each sector and present the results here. More details can be found in MyPlanIQ 360 Degree Market View.
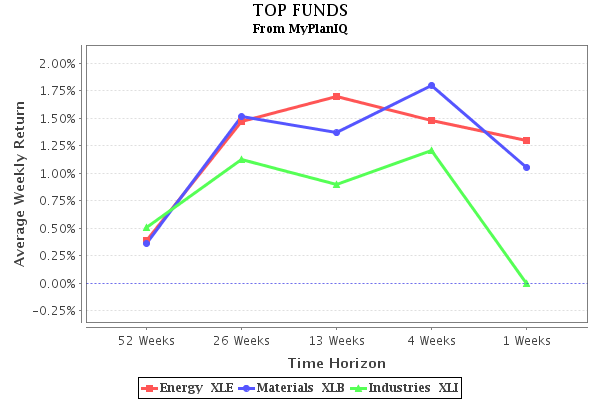
Energy (XLE), Materials (XLB), and Industrials (XLI) remain as the top three sectors this week.
Rising oil prices have helped propel the energy sector (XLE) higher, outperforming the broader market in the fourth quarter. As economic activity picks up with reports on dwindling U.S. crude oil inventories, optimism may drive oil prices past the $100 a barrel mark in the near term.
Following its recent up trend, materials (XLB) goes another notch higher and gained 1.25% this week. Recording-setting commodity prices in 2010 were primary driven by adverse weather and robust demand from China. The materials sector is expected to continue to do well in 2011 as commodity-hungry economies such as China and India are leading demand for industrial and construction materials.
The industrials sector (XLI) had a stellar year, handing investors a 26% return in 2010. Many analysts have recently revised upward their estimates for the 12-month forward earnings by the industrials sector. We expect the positive momentum will carry through the first half of 2011. Against this favorable backdrop, (XLY) makes an attractive momentum play in the medium term.
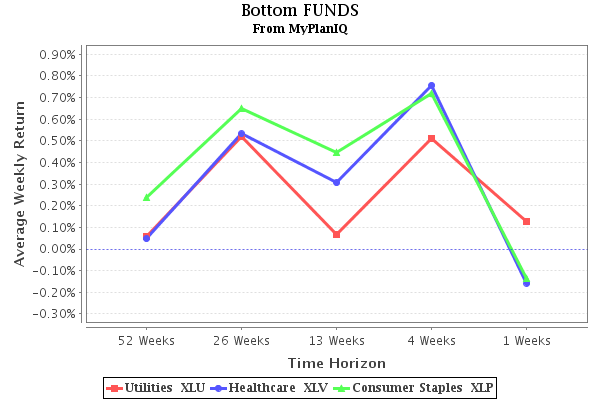
The healthcare sector (XLV) underperformed the broader market with an annual gain of 2.46%. High unemployment rate and the revamped healthcare law have put pressure on margins and earnings throughout the healthcare supply chain.
Defensive stalwart the utilities sector (XLU) lagged with annual gains of 3%.
|
Assets Class |
Symbols |
29-Dec |
22-Dec |
Annual |
Direction |
|
Trend |
Trend |
Return |
|||
|
Score |
Score |
||||
|
Energy |
XLE |
17.53% |
15.73% |
12.35% |
^ |
|
Materials |
XLB |
16.82% |
14.99% |
26.54% |
^ |
|
Industrials |
XLI |
14.43% |
13.77% |
2.46% |
^ |
|
Consumer Discretionary |
XLY |
14.23% |
13.81% |
3.01% |
^ |
|
Telecom |
IYZ |
11.69% |
10.34% |
11.38% |
^ |
|
Technology |
XLK |
9.81% |
8.66% |
10.47% |
^ |
|
Financials |
XLF |
9.56% |
9.25% |
26.49% |
^ |
|
Consumer Staples |
XLP |
7.57% |
7.37% |
20.10% |
^ |
|
Healthcare |
XLV |
4.63% |
4.40% |
18.73% |
^ |
|
Utilities |
XLU |
3.91% |
3.99% |
17.50% |
v |
labels:investment,
Symbols:XLY,IYZ,XLI,XLB,XLK,XLE,XLF,XLP,XLU,XLV,SPY,QQQQ,IWM,MDY,EFA,VEU,EEM,VWO,IYR,ICF,VNQ,GSG,DBC,DBA,USO,LQD,CSJ,CIU,HYG,JNK,PHB,TLT,IEF,SHY,SHV,BND,AGG,MUB,MBB,
comments
0
![]()
Or Start FREE 30-day trial now >>
