 |
Vanguard ETF: |  |
7.4%* |
|
Diversified Core: | |
8.1%* |
|
Six Core Asset ETFs: | |
7.3%* |
Articles on DEM
- Emerging Markets Help Diversification, Risk and Returns
04/21/2011
The volatility in stocks of developed nations during recession encourages diversification. Today investors are diversifying their portfolio by investing in multiple portfolios nationally, regionally, industrially and sectors.
One area for diversification is emerging markets which give us the possibilities of strong returns and a market that behaves differently than developed nations’ equities.
Tighter monetary policies implemented by China and India, with their fast growing economies, helped drive global growth over the past few years. We believe that the emerging market returns may prove less vigorous after two year impressive gains.
However governments of these nations have taken measures to overcome inflation by increasing interest rates and they are supported by moderate consumer growth. Emerging market stocks show a reasonable gain on the whole, particularly in solid corporate earnings and growth prospects.
Today emerging market specialists look at:
- Technology with demands for new products
- Telecommunications that offer dividend and earnings growth
- Consumer companies that saw sharp share price run-ups last year
They shy away from
- Financial stocks in a higher interest rate environment because of the monetary policy
- Companies that face increased competition from large multinational corporations.
The table shows the major emerging market diversified ETFs
Description
Symbol
1 Yr
3 Yr
5 Yr
Avg. Volume(K)
1 Yr Sharpe
WisdomTree Emerging Markets Equity Income
19.2%
9.22%
NA
234
84.76%
PowerShares DWA Em Mkts Technical Leaders
17.36%
-4.93%
NA
355
75.05%
Vanguard MSCI Emerging Markets
15.65%
2.76%
10.11%
22,113
74.53%
PoweShares FTSE RAFI Emerging Markets
12.87%
4.33%
NA
123
66.99%
Schwab Emerging Markets
14.1%
NA
NA
222
65.93%
iShares MSCI Emerging Markets
13.21%
2.88%
9.27%
69,534
59.85%
The overall returns from the emerging market ETF’s are robust with many new ETF’s becoming available. The robust profits induced new ETF’s which have a significant history.
In terms of five years returns VWO & EEM are the best with returns of 9.27% & 10.11% well above the five year benchmark interest rates. The volumes are also large indicating high levels of liquidity. In term of 1 year returns VWO & EEM again are top with returns of 15.65% & 13.21%.
It is important to consider risk factors: Investing in Emerging markets can be subject to currency risk in exchange rate and restrictions on the movement of foreign currency. Currency risk is a form of risk that arises from the change in price of one currency against another. Whenever investors or companies have assets or business operations across national borders, they face currency risk if their positions are not hedged.
In addition, there may be less governmental supervision and regulations and political instability.
Despite this, emerging market equities from an important part of a portfolio. Regional diversification provides a hedge against volatility in the USA and other developed markets. This helps with our objective to maximize returns on portfolio while minimizing risk.
Symbols: DEM, VWO, PXH, PIE, SCHE, EEM
Disclaimer:
MyPlanIQ does not have any business relationship with the company or companies mentioned in this article. It does not set up their retirement plans. The performance data of portfolios mentioned above are obtained through historical simulation and are hypothetical.
- Emerging Markets Demand Diversification
04/13/2011
Diversification is the theme that has emerged since. August 2008. Today investors are diversifying in multiple dimensions: nationally, regionally, industrially and from a sector perspective.
Emerging markets offer the possibility of good returns but there is some risk. Inflationary pressures and the impact of tighter monetary policies in China and India, with their fast growing economies, helped drive global growth over the past few years. The sharp capital inflows that buoyed emerging markets assets in 2010 could also reverse if economies experience a sudden slowdown.
Emerging market returns may prove less robust in the coming months after two years of impressive gains. However emerging markets governments that have enough flexibility to effectively manage inflation are likely to continue expanding at healthy rates, supported by moderate consumer growth. Emerging markets stock valuations also appear to be reasonable on the whole, particularly in light of solid corporate earnings and growth prospects, and managers believe there are myriad investment opportunities.
Portfolio managers and analysts favour technology that is likely to profit from demand for new products as well as telecommunications providers that offer dividends and earnings growth. Consumer companies remain an area of considerable interest, as stocks witnessed sharp share price run-ups last year.
The same group has become more cautious about some financial stocks in a higher interest rate environment and amid the prospect of tighter regulations for banks. They are also cautious about those that face increased competition from larger multinational corporations.
Please find below the table of major emerging market diversified ETFs
Description
Symbol
1 Yr
3 Yr
5 Yr
Avg. Volume(K)
1 Yr Sharpe
WisdomTree Emerging Markets Equity Income
21.48%
10.04%
NA
237
94.8%
Vanguard MSCI Emerging Markets
18.24%
3.63%
10.34%
22,047
86.76%
PoweShares FTSE RAFI Emerging Markets
16.61%
4.99%
NA
133
85.96%
PowerShares DWA Em Mkts Technical Leaders
19.1%
-5.04%
NA
362
82.45%
Schwab Emerging Markets
17.1%
NA
NA
220
79.96%
iShares MSCI Emerging Markets
15.01%
2.94%
9.46%
69,576
68.53%
In terms five years returns VWO & EEM are the best with returns of 10.34% & 9.46% well above the five year benchmark interest rates. The volumes are also large indicating high levels of liquidity. In term of 1 year returns DEM again VWO are top with returns of 21.48% & 18.24%.
VWO employs an indexing approach to provide broad exposure to the equity markets of emerging countries mainly Europe, Asia, Africa and Latin America. The median market capitalization is of $ 18 billion. The expense ratio is 0.22% as of 25/02/2011. Please find attached the top ten largest holding as on 28/02/2011. (These holding comprise of 19% of the net assets of the fund.)
1. Petroleo Brasileiro SA
2. Vale SA
3. Samsung Electronics Co Ltd.
4. Gazprom OAO
5. Taiwan Semiconductor Manufacturing Co Ltd.
6. China Mobile Ltd
7. America Movil SAB de CV
8. Itau Unibanco Holding SA
9. Industrial & Commercial Bank of China
10. China Construction Bank Corp
Diversification is always a good strategy but before diversifying we have to consider the risk factors. Investing in Emerging markets can be subject to currency risk in exchange rate and restrictions on the movement of foreign currency. In addition, there may be less governmental supervision and regulations and political instability.
Despite this, emerging market equities from an important part of a portfolio. Regional diversification provides a hedge against volatility in the USA and other developed markets. This helps with our objective to maximise returns on portfolio while minimizing risk.
Disclaimer:
MyPlanIQ does not have any business relationship with the company or companies mentioned in this article. It does not set up their retirement plans. The performance data of portfolios mentioned above are obtained through historical simulation and are hypothetical.
Symbols: DEM, VWO, PXH, PIE, SCHE, EEM
(NYSE: DEM), (NYSE: VWO), (NYSE: PXH), (NYSE: PIE), (NYSE: SCHE), (NYSE: EEM)
- Japan Disaster -- Prevention is Better Than Cure -- How Does that Apply to Investing?
04/07/2011
Japan will take many years to reuild the physical and psychological damage caused by the triple disaster that struck them. Who could have known? There is a very important lesson that can easily be overlooked in the rush to stop radioactive leaks and start to rebuild. Like New Orleans where the levies were known to be a problem area, Japan's nuclear reactors were living on borrowed time, having had their life extended -- just another year. The temptation to delay is very seductive until disaster strikes.
For years, we have put off retirement investments for -- just another year. Many now face and ugly repair crisis as portfolios have been blighted by the financial melt-down and they are left with a hole. The good news is that there are actions you can and must take to repair the damage and make the most of the time you have left.
Asset allocation is critical in determining risk adjusted returns from your portfolio.To make this clear, we use SIB -- Simpler Is Better -- to show the potential difference in returns between the portfolios with different numbers of asset classes.
Each of the SIBs are built from one ETF per asset class.Asset Class Ticker Name LARGE BLEND VTI Vanguard Total Stock Market ETF Foreign Large Blend VEU Vanguard FTSE All-World ex-US ETF DIVERSIFIED EMERGING MKTS VWO Vanguard Emerging Markets Stock ETF REAL ESTATE VNQ Vanguard REIT Index ETF COMMODITIES BROAD BASKET DBC PowerShares DB Commodity Idx Trking Fund Intermediate-Term Bond BND Vanguard Total Bond Market ETF So the three asset SIB has (VTI), or (SPY), (VEU) or (EFA) and (BND) or (AGG). The four asset SIB adds emerging markets (EEM) or (VWO). The five asset SIB adds Real Estate (RWR) or (VNQ). The six asset SIB adds commodities (DBC) or (GCC). These are index funds, we are not attempting to pick the best fund for each asset class but to make sure we have each asset class covered.
The three asset portfolio is old school. The world comprises the US and the rest.
Four asset classes add emerging markets which provides an equities asset class that behaves differently from US and international.
Five asset classes provides real estate trusts which moves away from equities and provides an asset that delivers dividends and is uncorrelated.
Six asset classes provides commodities which is a great hedge against inflation and also times of international stress when equities can drop sharply.Let's now look at five year returns for each portfolio and what that would mean if these returns were applied over a decade in terms of additional money in your portfolio.
Portfolio Name 5Yr AR 10 Yr Additional Money Compared to 3 Asset Class Portfolio
Six Core Asset ETF Benchmark Tactical Asset Allocation Moderate 13% 137% Six Core Asset ETF Benchmark Strategic Asset Allocation Moderate 7% 34% Five Core Asset ETF Benchmark Tactical Asset Allocation Moderate 10% 79% Five Core Asset ETF Benchmark Strategic Asset Allocation Moderate 6% 22% Four Core Asset ETF (EM) Benchmark Tactical Asset Allocation Moderate 8% 48% Four Core Asset ETF (EM) Benchmark Strategic Asset Allocation Moderate 5% 22% Three Core Asset ETF Benchmark Tactical Asset Allocation Moderate 4% - Three Core Asset ETF Benchmark Strategic Asset Allocation Moderate 4% -
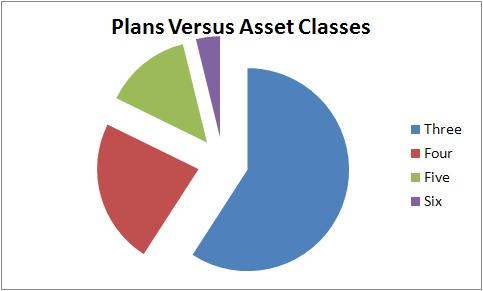
Unfortunately, most portfolios in retirement plans only support three asset classes. In a study of over 800 mainly retirement plans, we noted that the majority of plans supported only three asset classes which is going to have a significant impact on the potential returns for the participant.
How can you leverage the benefits of six asset classes if your plan only supports three asset classes? If you have an IRA, overweight the missing asset class (or more) in the IRA to compensate and create a more balanced portfolio that can deliver higher returns and lower risk.
Prevention is better than cure, which we all know. Just don't leave it -- one more year -- until you get started.
Disclosure:MyPlanIQ does not have any business relationship with the company or companies mentioned in this article. It does not set up their retirement plans. The performance data of portfolios mentioned above are obtained through historical simulation and are hypothetical.
Symbols:SSPY, VTI, EFA, VEU, AGG, BND, CIU, BIV, GWL, PFA, IVV, IYY, IWV, VV, DLN, RSP, SCHX, EEM, VWO, GMM, PXH, DEM, SCHE, DBC, GCC
Exchange Tickers: (SPY), (VTI), (EFA), (VEU), (AGG), (BND), (CIU), (BIV), (GWL), (PFA), (IVV), (IYY), (IWV), (VV), (DLN), (RSP), (SCHX), (EEM), (VWO), (GMM), (PXH), (DEM), (SCHE), (DBC), (GCC)
- Will We Learn From Japan's Triple Tragedy?
04/07/2011
While the disaster in Japan will take many years to be put right, there is a very important lesson that can easily be overlooked in the rush to stop radioactive leaks and repair the damage. Like New Orleans where the levies were known to be a problem area, Japan's nuclear reactors were living on borrowed time, having had their life extended -- just another year. The temptation to delay until next time is very seductive until disaster strikes and the cost to repair dwarfs the cost to prevent.
For many years we have put off focusing on our retirement investment for -- just another year. Many are facing the repair crisis as their portfolios have been blighted by the recent financial melt-down and they are left with a hole that they have to fill somehow. The good news is that there are actions you can and must take to repair the damage and make the most of the time you have left.
In a series of articles, we are going back to basics. Asset allocation is critical in determining the risk adjusted returns from your portfolio.To make this clear, we are going to use a simple benchmark vehicle -- SIB -- Simpler Is Better to show the potential difference in returns between the portfolios with different numbers of asset classes.
Each of the SIBs are built from one ETF per asset class. The ETFs we selected for these portfolios are as follows:Asset Class Ticker Name LARGE BLEND VTI Vanguard Total Stock Market ETF Foreign Large Blend VEU Vanguard FTSE All-World ex-US ETF DIVERSIFIED EMERGING MKTS VWO Vanguard Emerging Markets Stock ETF REAL ESTATE VNQ Vanguard REIT Index ETF COMMODITIES BROAD BASKET DBC PowerShares DB Commodity Idx Trking Fund Intermediate-Term Bond BND Vanguard Total Bond Market ETF So the three asset SIB has (VTI), or (SPY), (VEU) or (EFA) and (BND) or (AGG). The four asset SIB adds emerging markets (EEM) or (VWO). The five asset SIB adds Real Estate (RWR) or (VNQ). The six asset SIB adds commodities (DBC) or (GCC). These are index funds, we are not attempting to pick the best fund for each asset class but to make sure we have each asset class covered.
The three asset portfolio is old school. The world comprises the US and the rest. US equities are enough of a microcosm that I can find enough diversification to give me protection against certain segments of the markets declining. Even if that does happen, I have fixed income and international equities to bail me out. We know that this is no longer the case. We can see on our browsers how the DOW, FTSE and NIKKEI act as if they are the same index, just on a different timezone. With a three asset portfolio, you really have very limited diversification.
Unfortunately, most of the portfolios in retirement plans only support three asset classes. In a study of over 800 mainly retirement plans, we noted that the majority of plans supported only three asset classes which is going to have a significant impact on the potential returns for the participant.

We use Strategic Asset and Tactical Asset allocation investment strategies to compare returns.
Portfolio Name 1Yr AR 1Yr Sharpe 3Yr AR 3Yr Sharpe 5Yr AR 5Yr Sharpe Three Core Asset ETF Benchmark Tactical Asset Allocation Moderate 1% 30% 2% 31% 4% 35% Three Core Asset ETF Benchmark Strategic Asset Allocation Moderate 15% 129% 3% 15% 4% 18% Over a five year period, you will see five year returns are 4% for either strategy. This is what you might be getting from your retirement portfolio, and you can do better.
Adding emerging markets does give you a completely different asset
The list of minor asset classes covered by Three Core Asset ETF Benchmark The list of minor asset classes covered by Four Core Asset ETF (EM) Benchmark Foreign Large Blend: VEU
Intermediate-term Bond: BND
Large Blend: VTIDiversified Emerging Mkts: VWO
Foreign Large Blend: VEU
Intermediate-term Bond: BND
Large Blend: VTIAsset Class Three Core Asset ETF Benchmark Four Core Asset ETF (EM) Benchmark Fixed Income 1 1 Foreign Equity 1 1 Emerging Market Equity 0 1 US Equity 1 1 Total 3 4 As of Apr 6, 2011, Three Core Asset ETF Benchmark investment choice is rated as below average and Four Core Asset ETF (EM) Benchmark investment choice is rated as below average based on MyPlanIQ Plan Rating methodology that was designed to measure how effective a plan's available investment funds are . It has the following detailed ratings:
Attribute Three Core Asset ETF Benchmark Four Core Asset ETF (EM) Benchmark Diversification poor (2%) poor (8%) Fund Quality below average (23%) average (39%) Portfolio Building poor (6%) below average (16%) Overall Rating below average (10%) below average (20%) Performance chart (as of Apr 6, 2011)
Performance table (as of Apr 6, 2011)
Portfolio Name 1Yr AR 1Yr Sharpe 3Yr AR 3Yr Sharpe 5Yr AR 5Yr Sharpe Three Core Asset ETF Benchmark Tactical Asset Allocation Moderate -1% -10% 3% 31% 4% 36% Three Core Asset ETF Benchmark Strategic Asset Allocation Moderate 12% 88% 3% 16% 4% 19% Four Core Asset ETF (EM) Benchmark Tactical Asset Allocation Moderate -0% -2% 6% 57% 8% 56% Four Core Asset ETF (EM) Benchmark Strategic Asset Allocation Moderate 13% 88% 4% 15% 5% 22% We note that applying a tactical asset allocation strategy with three asset classes and funds is of limited value. Tactical asset allocation relies on having other asset classes that are not correlated so that when one asset class is under performing, another one becomes a hedge and rises to compensate. However, with an additional asset class, you are able to double returns over the longer time horizon. Note that an extra 1% a year over a decade puts 10% more money in your portfolio (SAA to SAA) and 4% a year over a decade puts 50% more money in your portfolios (TAA to TAA)
Emerging markets are going to play a larger and larger part in our lives as countries such as China and India are increasingly powerful. We have already seen how these nations have sprung back from the great recession and are leading the recovery. This is an important part of any portfolio and if you want to know how to better your chances of a better retirement, now you know.
How can you do this if your plan only supports three asset classes? If you have an IRA, overweight the missing asset class (or two) in the IRA to compensate and create a more balanced portfolio that can deliver higher returns and lower risk.
Prevention is better than cure, which we all know. Just don't leave it -- one more year -- until you get started.
Disclosure:MyPlanIQ does not have any business relationship with the company or companies mentioned in this article. It does not set up their retirement plans. The performance data of portfolios mentioned above are obtained through historical simulation and are hypothetical.
Symbols: SPY, VTI, EFA, VEU, AGG, BND, CIU, BIV, GWL, PFA, IVV, IYY, IWV, VV, DLN, RSP, SCHX, EEM, VWO, GMM, PXH, DEM, SCHE
Exchange Tickers: (SPY), (VTI), (EFA), (VEU), (AGG), (BND), (CIU), (BIV), (GWL), (PFA), (IVV), (IYY), (IWV), (VV), (DLN), (RSP), (SCHX), (EEM), (VWO), (GMM), (PXH), (DEM), (SCHE)
- Schwab Mutual Funds Beat out ETFs
04/06/2011
l
Retirement investing is a "hair on fire" problem -- especially for baby boomers for whom retirement is a near and present danger. There is a real lack of consistent, unbiased information that a retiree can use to help improve risk adjusted returns. Blogger Jenny Hollingworth has been teaching herself about investing and has come to the point where she is going to choose a plan and make her first investments.
In her recent post New Steps she sorted through a list of alternatives and chose the Schwab OneSource Select List Funds.
The reason for her choice was:
- The highest possible rating for each plan is 5 stars. So I bypassed anything that didn’t have 5 (because really, why go for less?)
- Picked out a name I knew: Schwab. Specifically: Schwab OneSource Select List Funds. I selected it.
- This is an application to Charles Schwab's OneSource Select List mutual funds. These funds are No Load and No Transaction Fee (NTF) mutual funds. Based on Schwab's policy, the no load NTF funds have 90 days redemption fee period. As of 1/1/2010, there are total 140 OneSource Select List funds available from Schwab.
We are going to review the Schwab OneSource Select List Funds to see whether she chose a good plan. The plan consists of 137 funds. These funds enable participants to gain exposure to 6 major assets: US Equity, Commodity, Foreign Equity, REITs, Emerging Market Equity, Fixed Income.
Asset Class Ticker Name LARGE VALUE AAGPX American Beacon Lg Cap Value Inv Foreign Large Value AAIPX American Beacon Intl Equity Inv Retirement Income AANPX American Beacon Retire Inc & Apprec Inv High Yield Muni ABHYX American Century High-Yield Muni Inv Inflation-Protected Bond ACITX American Century Infl-Adj Bond Inv Muni National Long ACLVX American Century Long-Term Tax-Free Inv MID-CAP VALUE ACMVX American Century Mid Cap Value Inv Conservative Allocation AONIX American Century One Choice: Vry Cnsrv I MID-CAP VALUE ARDEX Aston/River Road Dividend All Cap Val N Target Date 2011-2015 ARFIX American Century LIVESTRONG 2015 Inv Retirement Income ARTOX American Century LIVESTRONG Inc Inv Target Date 2021-2025 ARWIX American Century LIVESTRONG 2025 Inv Target Date 2031-2035 ARYIX American Century LIVESTRONG 2035 Inv SMALL VALUE AVPAX American Beacon Small Cp Val Inv EUROPE STOCK AXEAX Threadneedle European Equity A Muni National Interm BMBSX Baird Intermediate Muni Bd Inv Technology BOGSX Black Oak Emerging Technology Small Growth BSCFX Baron Small Cap Moderate Allocation BUFBX Buffalo Balanced Technology BUFTX Buffalo Science & Technology DIVERSIFIED EMERGING MKTS CEMVX Causeway Emerging Markets Investor MID-CAP BLEND CHTTX Aston/Optimum Mid Cap N Intermediate Government CPTNX American Century Government Bond Inv Small Growth CSMVX Century Small Cap Select Inv REAL ESTATE CSRSX Cohen & Steers Realty Shares Long-Short CVSIX Calamos Market Neutral Income A SMALL BLEND DISSX Dreyfus Small Cap Stock Index Bank Loan EABLX Eaton Vance Floating Rate Adv Conservative Allocation EXDAX Manning & Napier Pro-Blend Cnsrv Term S Foreign Large Blend EXWAX Manning & Napier World Opportunities A Moderate Allocation FAGSX First American Strat Growth Allc A Financial FBRSX FBR Small Cap Financial ULTRASHORT BOND FEUGX Federated Adjustable Rate Secs Instl Intermediate Government FICMX Federated Income Instl Muni National Interm FIMTX Federated Intermediate Municipal Instl LARGE BLEND FMIHX FMI Large Cap Long-Short FMLSX Wasatch-1st Source Long/Short SHORT GOVERNMENT FSGVX Federated US Govt 1-3 Yr Instl Muni Short FSHIX Federated Shrt-Interm Dur Muni Instl Short-Term Bond FSTIX Federated Short-Term Income Instl Intermediate-Term Bond FTRFX Federated Total Return Bond Instl Svc SMALL BLEND GABSX Gabelli Small Cap Growth AAA Communications GABTX GAMCO Global Telecommunications AAA LARGE GROWTH HCAIX Harbor Capital Appreciation Inv Foreign Large Blend HIINX Harbor International Inv WORLD STOCK HLMGX Harding Loevner Global Equity Advisor Foreign Large Growth HLMNX Harding Loevner International Equity Inv Equity Energy ICENX ICON Energy S China Region ICHKX Guinness Atkinson China & Hong Kong LARGE VALUE INDZX RiverSource Diversified Equity Inc A Moderate Allocation JABAX Janus Balanced T Health JAGLX Janus Global Life Sciences T LARGE GROWTH JAMRX Janus Research T Small Growth JATTX Janus Triton T Foreign Large Blend JETAX Artio International Equity II A Target Date 2021-2025 JNSAX JPMorgan SmartRetirement 2025 A LARGE BLEND JRMSX INTECH Risk-Managed Core T Target Date 2011-2015 JSFAX JPMorgan SmartRetirement 2015 A Target Date 2026-2030 JSMAX JPMorgan SmartRetirement 2030 A Target Date 2016-2020 JTTAX JPMorgan SmartRetirement 2020 A LARGE BLEND JUEAX JPMorgan US Equity A LARGE VALUE JVLAX JHancock3 Disciplined Value A Small Growth KGSCX Kalmar Growth-with-Value Small Cap LARGE GROWTH LGILX Laudus Growth Investors US Large Cap Gr WORLD BOND LIFNX Laudus Mondrian Intl Fixed Income Foreign Large Blend LISOX Lazard Intl Strategic Equity Open Multisector Bond LSBRX Loomis Sayles Bond Retail DIVERSIFIED PACIFIC/ASIA MAPIX Matthews Asia Pacific Equity Income PACIFIC/ASIA EX-JAPAN STK MAPTX Matthews Pacific Tiger Investor China Region MCHFX Matthews China Investor Muni National Interm MITFX Marshall Intermediate Tax-Free Inv JAPAN STOCK MJFOX Matthews Japan Investor Foreign Large Blend MKIEX McKee International Equity Instl DIVERSIFIED PACIFIC/ASIA MPACX Matthews Asia Pacific Investor High Yield Bond MWHYX Metropolitan West High Yield Bond M Short-Term Bond MWLDX Metropolitan West Low Duration Bond M Intermediate-Term Bond MWTRX Metropolitan West Total Return Bond M MID-CAP BLEND NMMCX Northern Multi-Manager Mid Cap SMALL VALUE NOSGX Northern Small Cap Value Muni National Long NOTEX Northern Tax-Exempt Small Growth NSPAX ING Small Cap Opportunities A Foreign Small/Mid Value OAKEX Oakmark International Small Cap I WORLD STOCK OAKGX Oakmark Global I COMMODITIES BROAD BASKET PCRDX PIMCO Commodity Real Ret Strat D Emerging Markets Bond PEMDX PIMCO Emerging Markets Bond D LARGE BLEND PEOPX Dreyfus S&P 500 Index WORLD BOND PFODX PIMCO Foreign Bond (USD-Hedged) D Intermediate-Term Bond PGBOX JPMorgan Core Bond A Multisector Bond PONDX PIMCO Income D LARGE BLEND PRBLX Parnassus Equity Income - Inv Inflation-Protected Bond PRRDX PIMCO Real Return D SMALL VALUE PSOAX JPMorgan Small Cap Value A Intermediate-Term Bond PTTDX PIMCO Total Return D SMALL BLEND RYTFX Royce Total Return Svc Intermediate-Term Bond SAMIX RidgeWorth Intermediate Bond I Foreign Large Blend SICNX Schwab International Core Equity Inst Foreign Large Blend SIEIX RidgeWorth Intl Equity Index I ULTRASHORT BOND SIGVX RidgeWorth US Gov Sec Ultra-Short Bd I Target Date 2031-2035 SRJAX JPMorgan SmartRetirement 2035 A DIVERSIFIED EMERGING MKTS SSEMX SSgA Emerging Markets Instl High Yield Bond STHTX RidgeWorth High Income I Muni National Interm STTBX RidgeWorth Investment Grade T/E Bond I LARGE BLEND SWANX Schwab Core Equity Inv Global Real Estate SWASX Schwab Global Real Estate Select Target Date 2026-2030 SWDRX Schwab Target 2030 LARGE VALUE SWDSX Schwab Dividend Equity Financial SWFFX Schwab Financial Services Target Date 2011-2015 SWGRX Schwab Target 2015 Intermediate Government SWGSX Schwab GNMA Long-Short SWHEX Schwab Hedged Equity Health SWHFX Schwab Health Care Target Date 2021-2025 SWHRX Schwab Target 2025 Intermediate-Term Bond SWIIX Schwab Premier Income Instl Foreign Large Blend SWISX Schwab International Index Retirement Income SWKRX Schwab Monthly Income Enh Payout Retirement Income SWLRX Schwab Monthly Income Max Payout LARGE GROWTH SWLSX Schwab Large-Cap Growth Foreign Large Growth SWMIX Laudus International MarketMasters Sel Small Growth SWMSX Laudus Small-Cap MarketMasters Select Muni National Interm SWNTX Schwab Tax-Free Bond Moderate Allocation SWOBX Schwab Balanced Inv LARGE BLEND SWPPX Schwab S&P 500 Index SMALL BLEND SWSSX Schwab Small Cap Index LARGE GROWTH TGCNX TCW Select Equities N Mid-Cap Growth TGDNX TCW Growth Equities N EQUITY PRECIOUS METALS TGLDX Tocqueville Gold LARGE BLEND TICRX TIAA-CREF Social Choice Eq Retail LARGE GROWTH TIRTX TIAA-CREF Large-Cap Growth Retail LARGE GROWTH TWCGX American Century Growth Inv Muni National Interm TWTIX American Century Interm-T Tx-Fr Bd Inv SHORT GOVERNMENT TWUSX American Century Short-Term Govt Inv LARGE VALUE TWVLX American Century Value Inv Foreign Large Value TWWDX Thomas White International Foreign Large Growth UMBWX Scout International SMALL VALUE VSFAX Federated Clover Small Value A Mid-Cap Growth WTMGX Westcore MIDCO Growth LARGE VALUE YAFFX Yacktman Focused Asset Class Number of funds Balanced Fund 21 REITs 2 Fixed Income 34 Commodity 1 Sector Fund 9 Foreign Equity 18 Emerging Market Equity 7 US Equity 41 Other 4 Total 137
As of Apr 5, 2011, this plan investment choice is rated as above average based on MyPlanIQ Plan Rating methodology that was designed to measure how effective a plan's available investment funds are . It has the following detailed ratings:Diversification -- Rated as great (98%)
Fund Quality -- Rated as average (54%)
Portfolio Building -- Rated as great (86%)
Overall Rating: above average (80%)Portfolio Discussions
The chart and table below show the historical performance of moderate model portfolios employing strategic and tactical asset allocation strategies. For comparison purpose, we also include the moderate model portfolios of a typical 6 asset SIB (Simpler Is Better) plan . This SIB plan has the following candidate index funds and their ETFs equivalent:
US Equity: SPY or VTI
Commodity: DBC
Foreign Equity: EFA or VEU
REITs: IYR or VNQ or ICF
Emerging Market Equity: EEM or VWO
Fixed Income: AGG or BND
Performance chart (as of Apr 5, 2011)Performance table (as of Apr 5, 2011)
Portfolio Name 1Yr AR 1Yr Sharpe 3Yr AR 3Yr Sharpe 5Yr AR 5Yr Sharpe Schwab OneSource Select List Funds Tactical Asset Allocation Moderate 13% 106% 10% 91% 13% 110% Schwab OneSource Select List Funds Strategic Asset Allocation Moderate 12% 152% 4% 32% 7% 52% Six Core Asset ETF Benchmark Tactical Asset Allocation Moderate 10% 81% 9% 82% 13% 89% Six Core Asset ETF Benchmark Strategic Asset Allocation Moderate 14% 121% 4% 20% 7% 34% With six asset classes and a wide number of funds, the returns beat the six asset class benchmark. With high scores in all categories, this plan delivers portfolios that have produced strong historical returns.
Symbols: SPY, VTI, EFA, VEU, EEM, VWO, IYR, VNQ, ICF, AGG, BND, DBC, HYG, JNK, PHB, AOM, AOK, CIU, BIV, ITM, MUB, TFI, PZA, MLN, IYH, IXJ, VHT, XBI, PBE, DBR, RYH, EFG, IXP, PTE, DGG, LTL, MTK, PTF, DBT, RYT, ROM, GWL, PFA, IVE, IWW, JKF, VTV, ELV, PWV, RPV, SCHV, SCZ, EFV, PID, DWM, IYF, VFH, IPF, PFI, DRF, RYF, IFGL, RWX, TZE, TZG, TZI, TZO, TZL, IGOV, BWX, WIP, IVV, IYY, IWV, VV, DLN, RSP, SCHX, IOO, VT, SHY, SHV, VGSH, PLK, USY, IEV, VGK, PEF, DEB, IVW, IWZ, JKE, VUG, ELG, QQQQ, RPG, SCHG, IJJ, IWS, JKI, VOE, EMV, PWP, RFV, UVU, IJH, IWR, JKG, VO, MDY, EMM, PJG, DON, EZM, MVV, IJS, IWN, JKL, VBR, DSV, PWY, RZV, UVT, IJR, IWM, JKJ, VB, DSC, PJM, DES, SAA, UWM, SCHA, GMM, PXH, DEM, SCHE, GBF, LAG, PCY, CSJ, BSV, VCSH, ITE, IXC, IPW, DBE, RYE, DKA, IEI, VGIT, IJK, IWP, VOT, EMG, PWJ, RFG, UKW, IJT, IWO, JKK, VBK, DSG, PWT, RZG, UKK, TIP, DBP, EPP, VPL, GMF, PAF, AAXJ, DND, EWJ, JPP, PJO, DXJ, GSG, BIL
Disclosure:
MyPlanIQ does not have any business relationship with the company or companies mentioned in this article. It does not set up their retirement plans. The performance data of portfolios mentioned above are obtained through historical simulation and are hypothetical.
Originally from the UK, Jenny Hollingworth lives with her husband and two sons in Northern California. She is a wife, mother, writer, theatre director, coffee drinker, avid reader, keen walker, movie watcher, Jane Austen lover and observer of life, in no particular order. MyPlanIQ has no formal relationship with Jenny Hollingworth.
- Schwab Select ETF Plan Has Bright Prospects
04/06/2011
- Accenture 401K Retirement Plan: High Quality and Low Cost Funds with Proper Diversification
03/25/2011
- Tactically Manage An Income Producing Portfolio With Commodity Exposure
03/25/2011
- Employees in Sprint Nextel Dial up An Average 401K Retirement Plan
03/22/2011
- Shell Versus Morningstar -- More is Better
02/27/2011
- E-Trade ETF Plan Hits Most of the High Notes
02/16/2011
- Vanguard VA Has Some Rules and Can Be Cloned with an ETF Portfolio
12/08/2010
- Peabody Energy 401K Plan Provides Reasonable Investment Choices
12/06/2010
- American Express Provides Above Average Investment Choices in Its 401K Plan
12/06/2010
- ETF Cloning of the Schwab VA
11/30/2010
- How Plan Rating Stack up Against ETF Portfolios Returns -- Part 3
11/03/2010
- How Plan Rating Stack up Against ETF Portfolios Returns -- Part 2
11/02/2010
- New York Times -- How Plan Rating Stack up Against ETF Portfolios -- Part 1
11/02/2010
- Top Tier ETF Broker Playoffs II
10/26/2010
- TD Ameritrade Commission Free ETF’s Empowers Both Strategic and Tactical Asset Allocation
10/19/2010
- Apache Design Solutions 401K Report On 12/03/2010
12/03/2010
This report reviews Apache Design Solutions 401K plan. We will discuss the investment choices and present the plan rating by MyPlanIQ. Current economic and market conditions are discussed in the context of the investment portfolios in the plan. We will then show how participants in Apache Design Solutions 401K can achieve reasonable investment results using asset allocation strategies.
Plan Review and Rating
Apache Design Solutions 401K's 401K plan consists of 42 funds. These funds enable participants to gain exposure to 5 major assets: US Equity, Foreign Equity, REITs, Emerging Market Equity, Fixed Income. The list of minor asset classes covered:
Conservative Allocation: AOK
Diversified Emerging Mkts: EEM, GMM, PXH, DEM, SCHE
Foreign Large Blend: EFA, VEU, GWL, PFA
Foreign Small/mid Growth: IFSM, VSS, SCHC
Health: IYH, IXJ, VHT, XBI, PBE, DBR, RYH
Intermediate Government: IEI, VGIT, ITE
Intermediate-term Bond: AGG, CIU, BIV, BND
Large Blend: IVV, IYY, IWV, VTI, VV, SPY, DLN, RSP, SCHX
Large Growth: IVW, IWZ, JKE, VUG, ELG, QQQQ, RPG, SCHG
Large Value: IVE, IWW, JKF, VTV, ELV, PWV, RPV, SCHV
Mid-cap Growth: IJK, IWP, VOT, EMG, PWJ, RFG, UKW
Mid-cap Value: IJJ, IWS, JKI, VOE, EMV, PWP, RFV, UVU
Moderate Allocation: AOM
Natural Resources: IYM, IGE, VAW, XLB, XME, PYZ, DBN, RTM, UYM
Real Estate: IYR, ICF, VNQ
Retirement Income:
Small Blend: IJR, IWM, JKJ, VB, DSC, PJM, DES, SAA, UWM, SCHA
Small Growth: IJT, IWO, JKK, VBK, DSG, PWT, RZG, UKK
Small Value: IJS, IWN, JKL, VBR, DSV, PWY, RZV, UVT
Target Date 2016-2020: TZG
Target Date 2026-2030: TZL
Target Date 2036-2040: TZV
World Stock: IOO, VT
As of Dec 2, 2010, this plan investment choice is rated as based on MyPlanIQ Plan Rating methodology that measures the effectiveness of a plan's available investment funds. It has the following detailed ratings:
Diversification -- Rated as (85%)
Fund Quality -- Rated as (18%)
Portfolio Building -- Rated as (79%)
Overall Rating: (62%)Current Economic and Market Conditions
We have experienced an uncertain 2010: plenty of worries on whether the US economy will climb out of the great recession and recover.
- The Federal Reserve embarked on Quantitative Easing II (QE2) to stimulate the economy.
- The housing market is still at its low but largely stabilized.
- The unemployment rate is stuck at 9%.
Americans continue to face an uncertain future, given (among others) the high unemployment rate, large federal and local government debts and global trade imbalance. With such an economic backdrop, the stock and debt markets are going to be volatile. Despite this, markets have been resilient and appear positioned to rebound.
In this market it is even more critical to properly diversify and respond market changes. MyPlanIQ offers two asset allocation strategies: strategic and tactical asset allocation strategies ( SAA and TAA for participants in Apache Design Solutions 401K).
Strategic Asset Allocation is based on well known modern portfolio theory and its key features include: diversification, proper fund selection and periodically re-balancing.
Tactical Asset Allocation works on a diversified array of assets provided by funds in a plan and adjusts asset mixes based on market conditions such as asset price momentum utilized by TAA.
Portfolio Discussions
The chart and table below show the historical performance of moderate model portfolios employing strategic and tactical asset allocation strategies. For comparison purpose, we also include the moderate model portfolios of a typical 5 asset SIB (Simpler Is Better) plan . This SIB plan has the following candidate index funds and their ETFs equivalent:
US Equity: (SPY or VTI)
Foreign Equity: (EFA or VEU)
Emerging Market Equity: (EEM or VWO)
REITs: (IYR or VNQ or ICF)
Fixed Income: (AGG or BND)
Performance chart (as of Dec 2, 2010)Performance table (as of Dec 2, 2010)
Portfolio Name 1Yr AR 1Yr Sharpe 3Yr AR 3Yr Sharpe 5Yr AR 5Yr Sharpe Apache Design Solutions 401K Tactical Asset Allocation Moderate 15% 100% 8% 64% 11% 81% Apache Design Solutions 401K Strategic Asset Allocation Moderate 16% 155% 4% 22% 8% 44% Five Core Asset Index ETF Funds Tactical Asset Allocation Moderate 9% 59% 7% 57% 14% 94% Five Core Asset Index ETF Funds Strategic Asset Allocation Moderate 12% 95% 4% 14% 8% 35% Currently, asset classes in US Equity (SPY,VTI) and Emerging Market Equity (EEM,VWO) are doing relatively well. These asset classes are available to Apache Design Solutions 401K participants.
To summarize, Apache Design Solutions 401K plan participants can achieve reasonable investment returns by adopting asset allocation strategies that are tailored to their risk profiles.
Symbols: APA , SPY , VTI , EFA , VEU , EEM , VWO , IYR , VNQ , ICF , AGG , BND , AOM , AOK , CIU , BIV , IYH , IXJ , VHT , XBI , PBE , DBR , RYH , IYM , IGE , VAW , XLB , XME , PYZ , DBN , RTM , UYM , GWL , PFA , IVE , IWW , JKF , VTV , ELV , PWV , RPV , SCHV , TZG , TZL , TZV , IVV , IYY , IWV , VV , DLN , RSP , SCHX , IOO , VT , IVW , IWZ , JKE , VUG , ELG , QQQQ , RPG , SCHG , IJJ , IWS , JKI , VOE , EMV , PWP , RFV , UVU , IFSM , VSS , SCHC , IJS , IWN , JKL , VBR , DSV , PWY , RZV , UVT , IJR , IWM , JKJ , VB , DSC , PJM , DES , SAA , UWM , SCHA , GMM , PXH , DEM , SCHE , IEI , VGIT , ITE , IJK , IWP , VOT , EMG , PWJ , RFG , UKW , IJT , IWO , JKK , VBK , DSG , PWT , RZG , UKK
- Allegheny Ludlum Corporation Personal Retirement and 401(k) Savings Account Plan Report On 12/03/2010
12/03/2010
- AMERICAN EXPRESS RETIREMENT SAVINGS PLAN Report On 12/03/2010
12/03/2010
- PEABODY WESTERN-UMWA 401(K) PLAN Report On 12/03/2010
12/03/2010
- Peabody Investments Corp.Employee Retirement Account Report On 12/03/2010
12/03/2010
- EQT CORPORATION SAVINGS AND PROTECTION PLAN Report On 12/03/2010
12/03/2010
- TD Ameritrade Commission Free ETFs Report On 12/07/2010
12/07/2010
- Sprint Nextel 401K Plan Report On 03/21/2011
03/21/2011