How Plan Rating Stack up Against ETF Portfolios Returns -- Part 2
11/02/2010 0 comments
We are going to use our SIBs to explore plan rating so that it is clear how it works.
We will use a six asset SIB that has Vanguard market funds and a six asset SIB that has Vanguard ETF's. Both have one fund per asset class.
| Asset Class | Index SIB | ETF SIB |
| U.S. Equity Excluding Company Stock | VTSMX | VTI |
| International Equity | VGTSX | VEU |
| Emerging Markets | VEIEX | VWO |
| Real Estate | VGSIX | VNQ |
| Commodities | DBC | DBC |
| Fixed Income Including Money Market | VBMFX | BND |
The current ratings given to each SIB are listed below.
| Plan Rating Attribute | Index SIB | ETF SIB |
| Diversification | 60% | 60% |
| Fund Quality | 74% | 39% |
| Portfolio Building | 85% | 81% |
| Overall Rating | 74% | 62% |
We base the Diversification score on nine asset classes: US Equity, International Equity, Fixed Income, Real Estate, Commodities, Emerging Markets, International Bonds, High Yield Bonds, Balanced Funds. For each asset class, except for US Equity, the diversification score is highest to plans having 4-5 funds in each asset class as this allows the investor to find and use the best funds. For an application like MyPlanIQ, the more funds the better because it can search efficiently through a large number of alternatives but that is not true in the general case. The US is treated as a special case where the sweetspot is 7-8 funds as there are more classes and more opportunities for non-correlated benefits. Each of these asset classes are combined to give the overall diversification score.
Both SIBs score identically as they each have one fund in each asset class.
The ETF SIB scores considerably lower than the index funds and that is because many of them don't have a long history and so their historical component is zero. Whereas this is unlikely to returns performance, it is important to recognize that funds with a longer history and give them a measure of preference.
Both SIBs score approximately the same. There are some differences in the individual behaviors of the funds that make a slight difference but not enough to be significant.
Each one of these categories is then combined to create an overall score.
Now let's see how the rating stacks up against historical returns.
Performance chart (as of Oct 29, 2010)
Performance table (as of Oct 29, 2010)
| Portfolio Name | 1Yr AR | 1Yr Sharpe | 3Yr AR | 3Yr Sharpe | 5Yr AR | 5Yr Sharpe |
|---|---|---|---|---|---|---|
| Six Core Asset ETFs Tactical Asset Allocation Moderate | 13% | 87% | 8% | 57% | 17% | 114% |
| Six Core Asset ETFs Strategic Asset Allocation Moderate | 14% | 104% | 2% | 6% | 9% | 42% |
| Six Core Asset Index Funds Tactical Asset Allocation Moderate | 11% | 84% | 8% | 65% | 15% | 117% |
| Six Core Asset Index Funds Strategic Asset Allocation Moderate | 13% | 113% | 1% | 2% | 8% | 40% |
As predicted, the index SIB performance is higher. If we compare the ratio of the TAA performance of the two SIB and the ratio of the performance of the Plan rating of the two SIBs we can see that the ratio of the rating and the 5 year returns follow a similar pattern -- more of this in the final article on this.
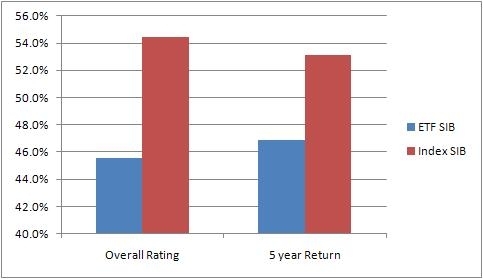
We see that the 5 year returns of the ETF SIB is higher that it's overall rating would initially predict but that is to be expected as we know that the fund quality was impacted by its history which won't, in fact, impact the returns for the period of time it was available.
labels:investment,
Symbols:SPY,VTI,EFA,VEU,EEM,VWO,IYR,VNQ,ICF,AGG,BND,DBC,CIU,BIV,GWL,PFA,IVV,IYY,IWV,VV,DLN,RSP,SCHX,GMM,PXH,DEM,SCHE,GSG,
comments 0
Or Start FREE 30-day trial now >>
