
Home Rent vs. Buy: That’s A Great Question
In this issue:
- Latest in Retirement Savings & Personal Finance: Social Security COLA Expected to 2.7%, Consumers Hit 70% Tariff by October
- Social Security at Risk: Home Rent vs. Buy: That’s A Great Question
- Tools & Tips: Home Rent vs. Buy Calculator
- Market Overview
Latest in Retirement Savings & Personal Finance: Social Security COLA Expected to 2.7%, Consumers Hit 70% Tariff by October
Social Security COLA Adjustment Expected from Current to 2.7%
Social Security’s 2025 COLA was officially set at 2.5%. That starts in January. The average monthly retirement check goes from $1,861 to about $1,907, which is around $49 more for over 72 million people. The adjustment was based on CPI-W data from July through September of last year. A 2.5% year-over-year bump. Nothing too surprising.
Then in mid-August, a few analysts, including Mary Johnson from the Senior Citizens League, came out with a preliminary estimate for 2026. Their early number is 2.7%. That’s based on the July CPI-W, which also came in at 2.5%, while the broader CPI-U was slightly higher at 2.7%. Final number won’t be confirmed until October, after August and September inflation readings are in.
If the 2.7% estimate holds, it would raise the average benefit from $2,006.69 to about $2,060.87. That’s roughly a $54 monthly increase.
But as always, the increase can be quickly offset. Medicare Part B premiums are projected to go up again, possibly from $185 to around $206.50. That alone could cancel out the COLA for some. Then you have senior-specific costs like housing, which rose 3.9%, and medical care, which rose 2.8%. So even if the checks are technically larger, the extra income might not go very far. Furthermore, as expected by Goldman Sachs (see below), you will likely face quite some tariff-related price hikes by October.
And while a 2.7% COLA is slightly above the 20-year average of 2.6%, it doesn’t really change the bigger picture. As we stated in our previous newsletter, the Social Security trust fund is still projected to run out around 2033. Without some kind of fix from Congress, benefits could face a 23% cut.
Goldman Sachs Expects American Consumers Will Be Hit by 70% Tariff Tax Cost by October
On August 10, 2025, Goldman Sachs projected that by October 2025 American consumers would bear 70 percent of tariff costs from policies put in place in April 2025, up from 22 percent in June as U.S. companies pass on price increases. This shift could raise household expenses by about $2,400 annually, including $300 for food, and push CPI inflation to 3.7 percent by the second quarter of 2026, creating real pressure on retirees and others on fixed incomes. The report also notes that only 14 percent of tariff costs are absorbed by foreign exporters, which runs counter to claims that foreign producers fully cover these costs.
President Trump, who initiated these tariffs, dismissed critics’ concerns as overstated. In an August 14 speech and posts on X he highlighted trade deal successes and described Social Security’s “sacred promise.” His rhetoric did not stop there. About six days ago he criticized Goldman Sachs and its chief, saying that the CEO “should focus on being a DJ”
Treasury Secretary Scott Bessent acknowledged on August 7 that U.S. consumers and importers bear significant costs. Yet Trump’s scoffing tone was echoed by supporters like attorney Robert Barnes, who argues that tariffs ultimately benefit American workers. Meanwhile, critics such as Senator Amy Klobuchar continue to highlight the burden on consumers, adding to an already polarized debate as tariff-driven inflation looms.
Regardless, in the coming years, with the mega trend reversal (no more globalization, for example), Americans should be prepared for some wild rides.
Home Rent vs. Buy: That’s A Great Question
In our paid newsletter July 2025 MyPlanIQ Portfolio Update, we did some comparison on whether it’s beneficial to buy a house or just simply rent a house. To make the comparison realistic, we looked the residential real estate market in the three representative locations: Palo Alto, California, Chicago, Illinois and Houston, Texas. Using the past 20 years real estate and mortgage data, the studies concluded:
- For straightforward residential price appreciation versus S&P 500 total return, all three areas underperformed the S&P 500. This includes perhaps one of the best or hottest real estate areas in the U.S.: Palo Alto.
- However, if taking the utility use of the housing, i.e., living in it as a shelter into consideration, primary residences in Palo Alto outperformed the S&P 500, while the other two areas still underperformed.
- Finally, for a more typical case of taking an 80% mortgage with a 20% down payment, all three areas would have outperformed S&P 500 returns.
For the typical 20% downpayment situation, we have the following:
| Area | Leveraged Real Estate Return | S&P 500 Return | Performance Difference |
|---|---|---|---|
| Palo Alto | 13.88% | 7.70% | +6.18% |
| Chicago | 10.32% | 7.70% | +2.62% |
| Houston | 10.75% | 7.70% | +3.05% |
Summary
- Tax benefits significantly impact returns: Added 0.39-0.79% to net real estate returns
- Leverage amplifies outperformance: 20% down strategy beat S&P 500 by 3.05-6.18% annually
- Cost-rent equivalence validated: Ownership costs were 81-115% of rental costs across markets
- Location, Location, Location: Palo Alto delivered highest risk-adjusted returns
However, as we soon will find out from our House Rent vs. Buy Calculator, things might be very different, depending on the market conditions, inflation, and interest rate environment.
Tools & Tips: Home Rent vs. Buy Calculator
The House Rent vs. Buy Calculator helps you compare the long-term financial impact of both options by analyzing your net worth after 30 years under each scenario. Simply enter your local market conditions, financial situation, and investment assumptions to see which path builds more wealth over time. The calculator accounts or home appreciation, mortgage payments, tax benefits, maintenance costs, and investment returns to give you a comprehensive comparison.
The calulcator assumes that the renter would use the cash that would have been spent in purchasing a house (downpayment + closing cost) will be invested instead. To make the comparsion fair, the calculator uses the difference between the home monthly expenditure and monthly rent as an offset to the house equity.
In the following, we look at a situation where the mortgage interest is 7%. Under this condition, it’s almost certain that Rent is better than Buy:
The inputs:

The result clearly shows that Rent & Invest is much better:

Or the chart:
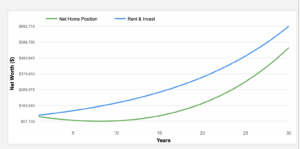
The main culprit: high interest rate! If, instead, we reduce the interest rate to 4%, we get the following result:

Of course, at the moment, construction cost has steadily risen (thus maintenance expenses too). If we are in a stagflation (growth is stuck to almost no growth while inflation is high such as more than 4%), the thesis that the buying will always win will likely become wrong. In fact, many homeowners recently have felt the pinch from inflation and high interest rates.
We encourage you to play with House Rent vs. Buy Calculator that has many parameters to tweak. Get yourself educated on one of the most important personal finance subjects: buying vs. renting!
Market Overview
Stocks continued to rise as two indicators gave somewhat conflicting signals:
For July 2025, the Consumer Price Index (CPI) rose 0.2% month-over-month, matching expectations, and was up 2.7% year-over-year, slightly below the forecast of 2.8%. Core CPI (which excludes food and energy) increased 0.3% month-over-month (in line with expectations) and 3.1% year-over-year, coming in slightly above the forecast of 3.0%. This mixed pattern, with headline inflation underperforming and core inflation barely overshooting, generally signaled anemic to stable inflationary pressures. Investors were encouraged and expected the Federal Reserve will lower interest rates in September.
However, the Producer Price Index (PPI) surprised significantly to the upside. Headline PPI surged 0.9% month-over-month, far above the forecast of 0.2%, marking its strongest monthly gain since June 2022. The year-over-year PPI jumped 3.3%, well above the 2.5% consensus expectation. Core PPI (excluding food and energy) also climbed 0.9% month-over-month (vs. a 0.3% forecast), and 3.3% year-over-year. This sharp acceleration in producer prices signals increased inflationary pressures that could push consumer prices higher in the coming months.
Overall, investors continued their risk appetite and pushed stock prices further higher. However, as we noted, the broad base stock index rise has been very uneven.
The following table shows the major asset price returns and their trend scores, as of this Monday:
| Asset Class | 1 Weeks | 4 Weeks | 13 Weeks | 26 Weeks | 52 Weeks | Trend Score |
|---|---|---|---|---|---|---|
| US Stocks | 1.2% | 2.4% | 8.4% | 6.1% | 16.3% | 6.9% |
| Foreign Stocks | 1.9% | 3.0% | 8.0% | 15.0% | 17.6% | 9.1% |
| US REITs | 0.5% | -1.5% | -0.7% | -1.1% | 0.2% | -0.5% |
| Emerging Market Stocks | 2.1% | 2.0% | 8.2% | 13.4% | 17.7% | 8.7% |
| Bonds | -0.2% | 0.8% | 2.3% | 3.1% | 2.5% | 1.7% |
More detailed returns and trend scores can be found on MyPlanIQ.com Market Overview.