
Gold Shines as a Store of Value
In this issue:
- Latest in Retirement Savings & Personal Finance: Rise in U.S. Bankruptcies, Surging Long-Term Bond Yields Worldwide
- Gold Shines as a Store of Value
- Tools & Tips: Gold vs Stock Return Calculator
- Market Overview
Latest in Retirement Savings & Personal Finance: Rise in U.S. Bankruptcies, Surging Long-Term Bond Yields Worldwide
Rise in U.S. Bankruptcies
U.S. corporate bankruptcies have picked up sharply in 2025 as the effect of high interest rates finally sets in. Companies that borrowed cheaply during the zero-rate years are now forced to refinance at much higher costs, and the burden is most visible among small firms. By late 2024, about 43 percent of small-cap companies were already unprofitable, and many of them now face interest expenses near levels not seen since 2003. The result is predictable. Defaults are rising, and for some, bankruptcy has become the only path when debt costs simply overwhelm what little profit they have.
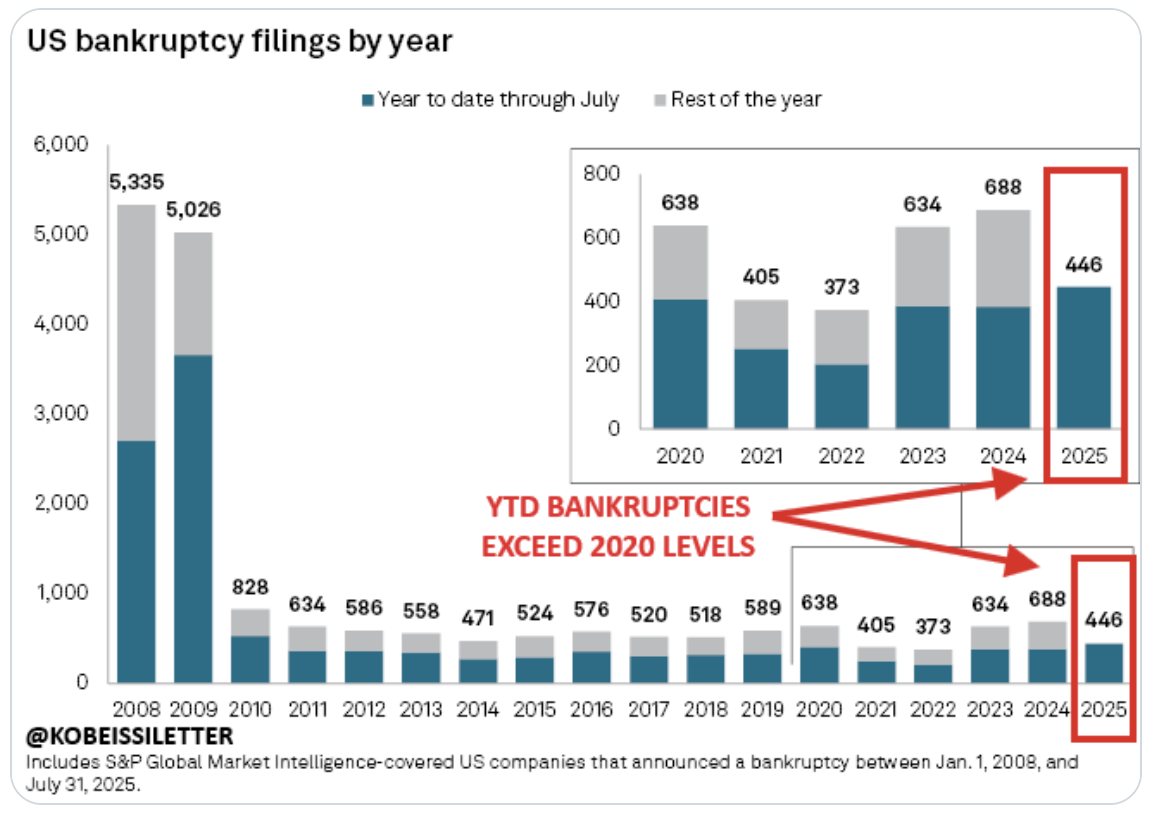
Tariffs are adding another layer of pressure, particularly for firms dependent on imports. The effective U.S. tariff rate climbed to 17.3 percent this year, the highest since the 1930s, and at least ten bankruptcy cases since April have cited tariffs directly as a contributing factor. Retailers and consumer discretionary names have been hit hardest, with filings such as Claire’s earlier in the year followed by industrials and even Spirit Airlines by August. While a court ruling in late August declared most of the Trump administration’s tariffs illegal, enforcement has been delayed, leaving firms to struggle through the coming months with little immediate relief.
Surging Long-Term Bond Yields Worldwide
As central banks worldwide cut short-term interest rates, long-term government bond yields in many developed countries are rising rapidly.
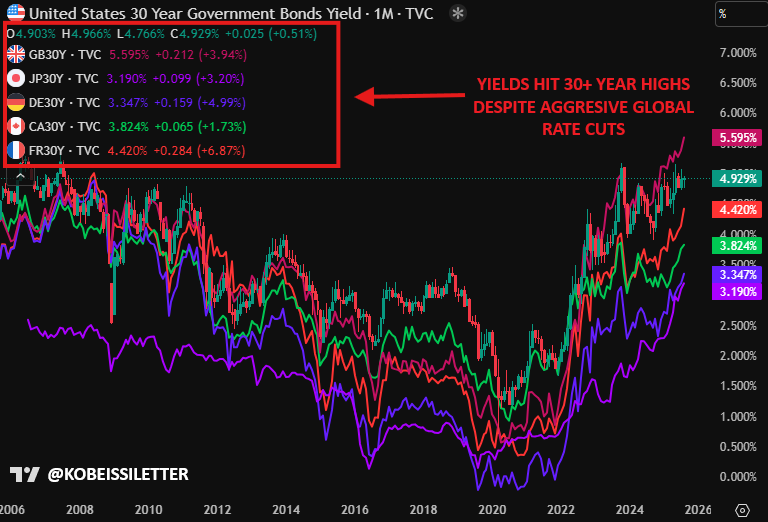
What they say is that bond vigilantes are starting to take over the bond market, enforcing fiscal discipline on politicians who only have a short-term horizon to appease their citizens. Government debt cannot go up forever. Furthermore, investors are losing confidence in fiat currencies. This also leads to our next key topic: gold is shining as the store of value.
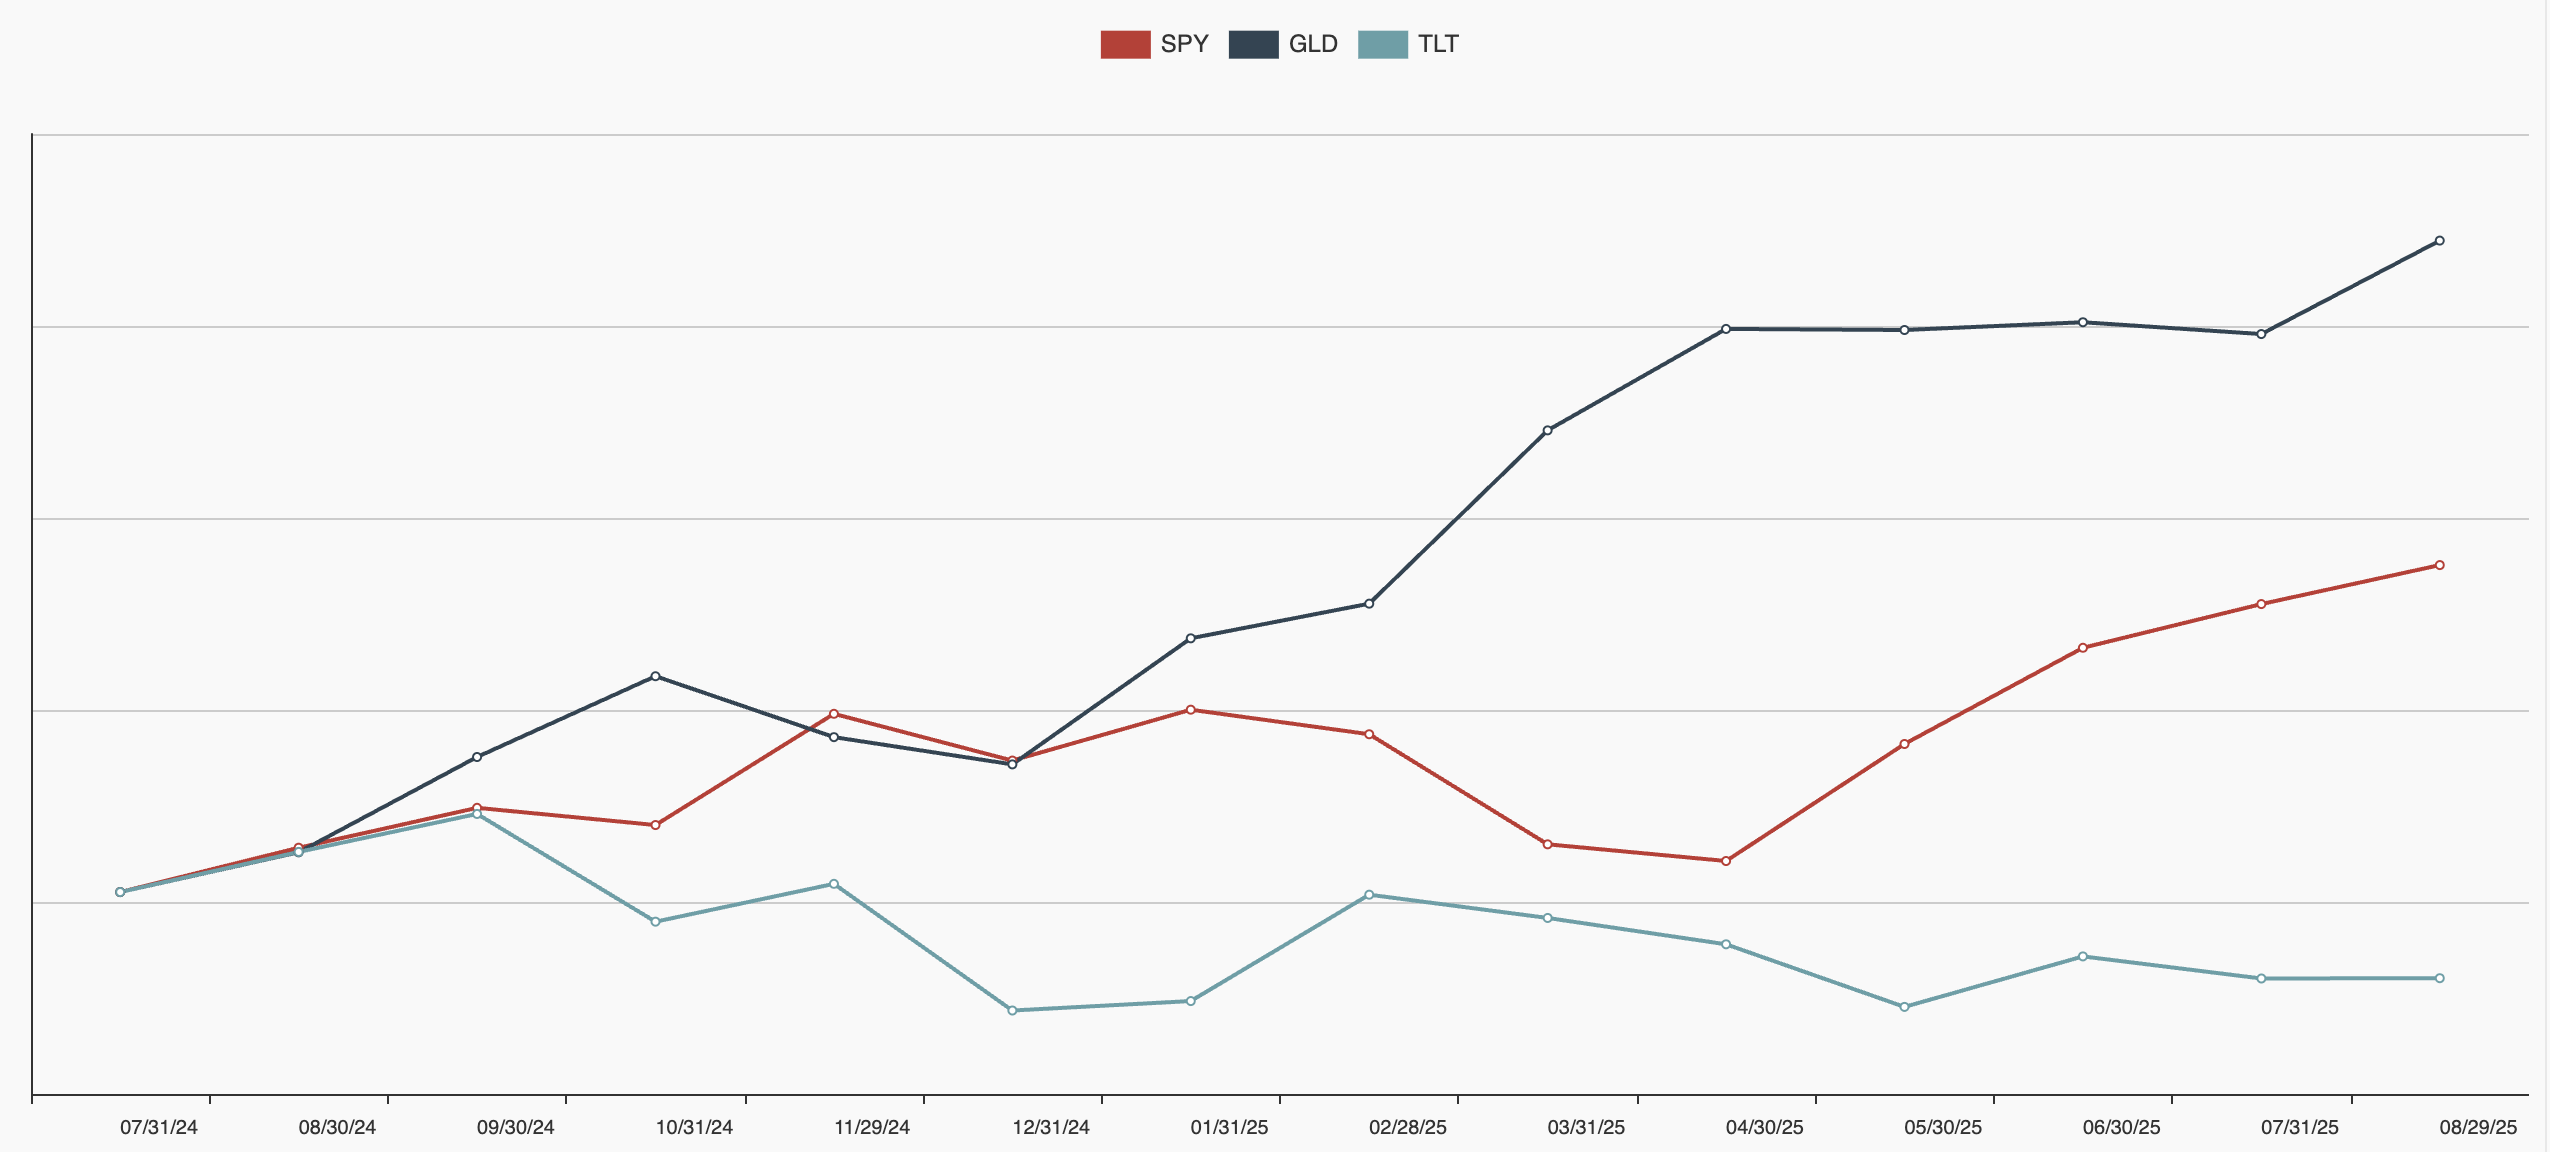
Gold Shines as a Store of Value
Gold price has been surging. For the past one year, gold returned 31%, compared with S&P SPY’s 10% or TLT (20+ year US Treasury bonds)’s 1%:
Longer term, Gold is practically closely matching S&P 500 returns since 1971:
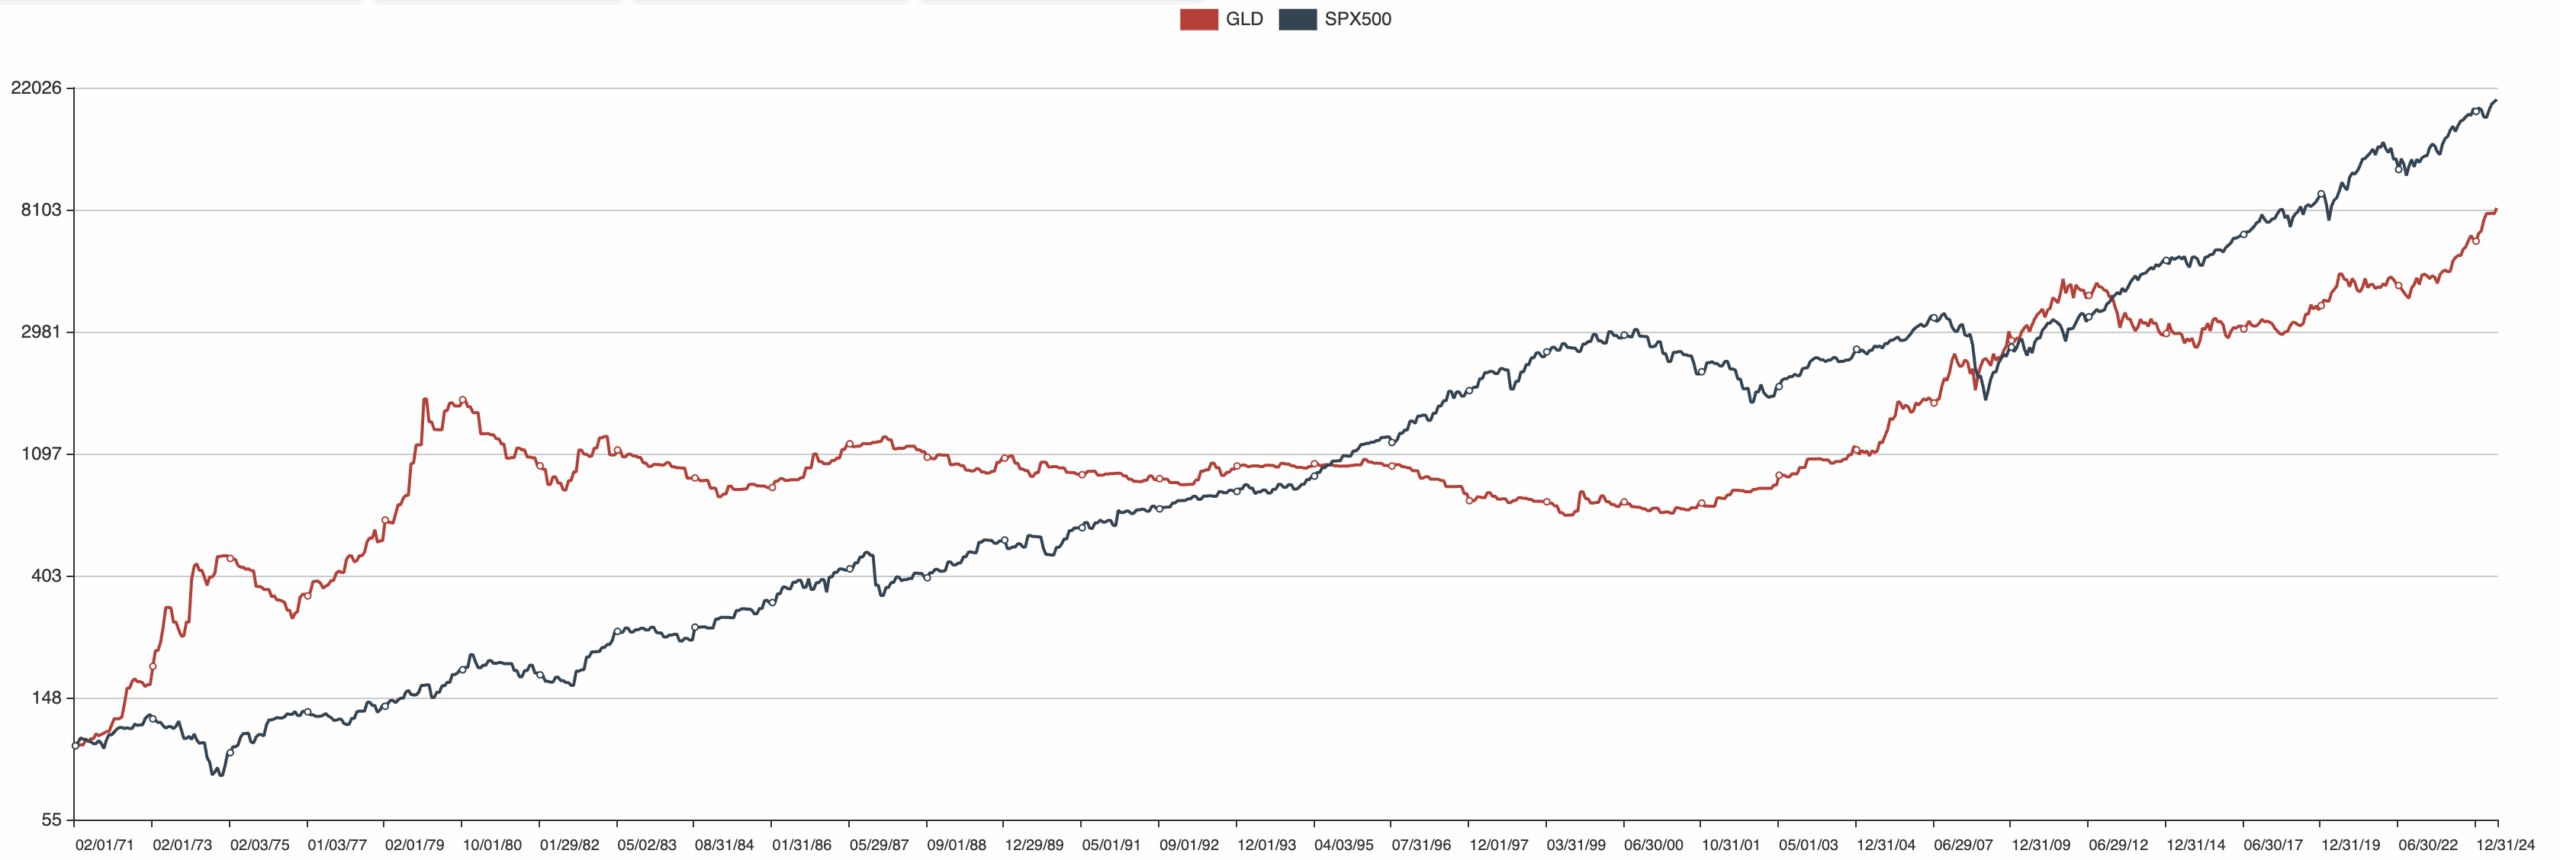
Based on our Gold’s Long-Term Performance: Historical Returns and Key Drivers, from 1971 to 2024, Gold had about 8% annualized return, much higher than the annual CPI (inflation) rate of 3.96%. Gold has preserved its value well and outpaced inflation by a big margin.
Gold has been perceived to have various characteristics by various people in various conditions. The most popular views include:
- Gold is a store of value
- Or Gold is an inflation hedge
- Gold is a safe haven during a crisis such as geopolitical or economic uncertainties
Gold’s Long-Term Performance: Historical Returns and Key Drivers covers various historical situations and discusses how Gold responded in those conditions.
Meanwhile, with Gold’s resilient reaction during a period like the current one, it might be worth considering to have some exposure in Gold in one’s investment portfolios. The Harry Browne Permanent Portfolio is a good example to show how Gold has helped the investments withstood periods of geographical tensions, economic uncertainties and hyper inflation periods.
Tools & Tips: Gold vs Stock Return Calculator
One can use the following Gold vs Stock Return Calculator to compare the historical gold and stock (S&P 500 total return index) returns for any custom time period. Enter your start and end dates along with an initial investment, and the calculator will pull historical price and inflation data to show both nominal and inflation-adjusted (real) returns. You’ll see metrics like ending value, total return, gain/loss, and CAGR.
The calculator example:
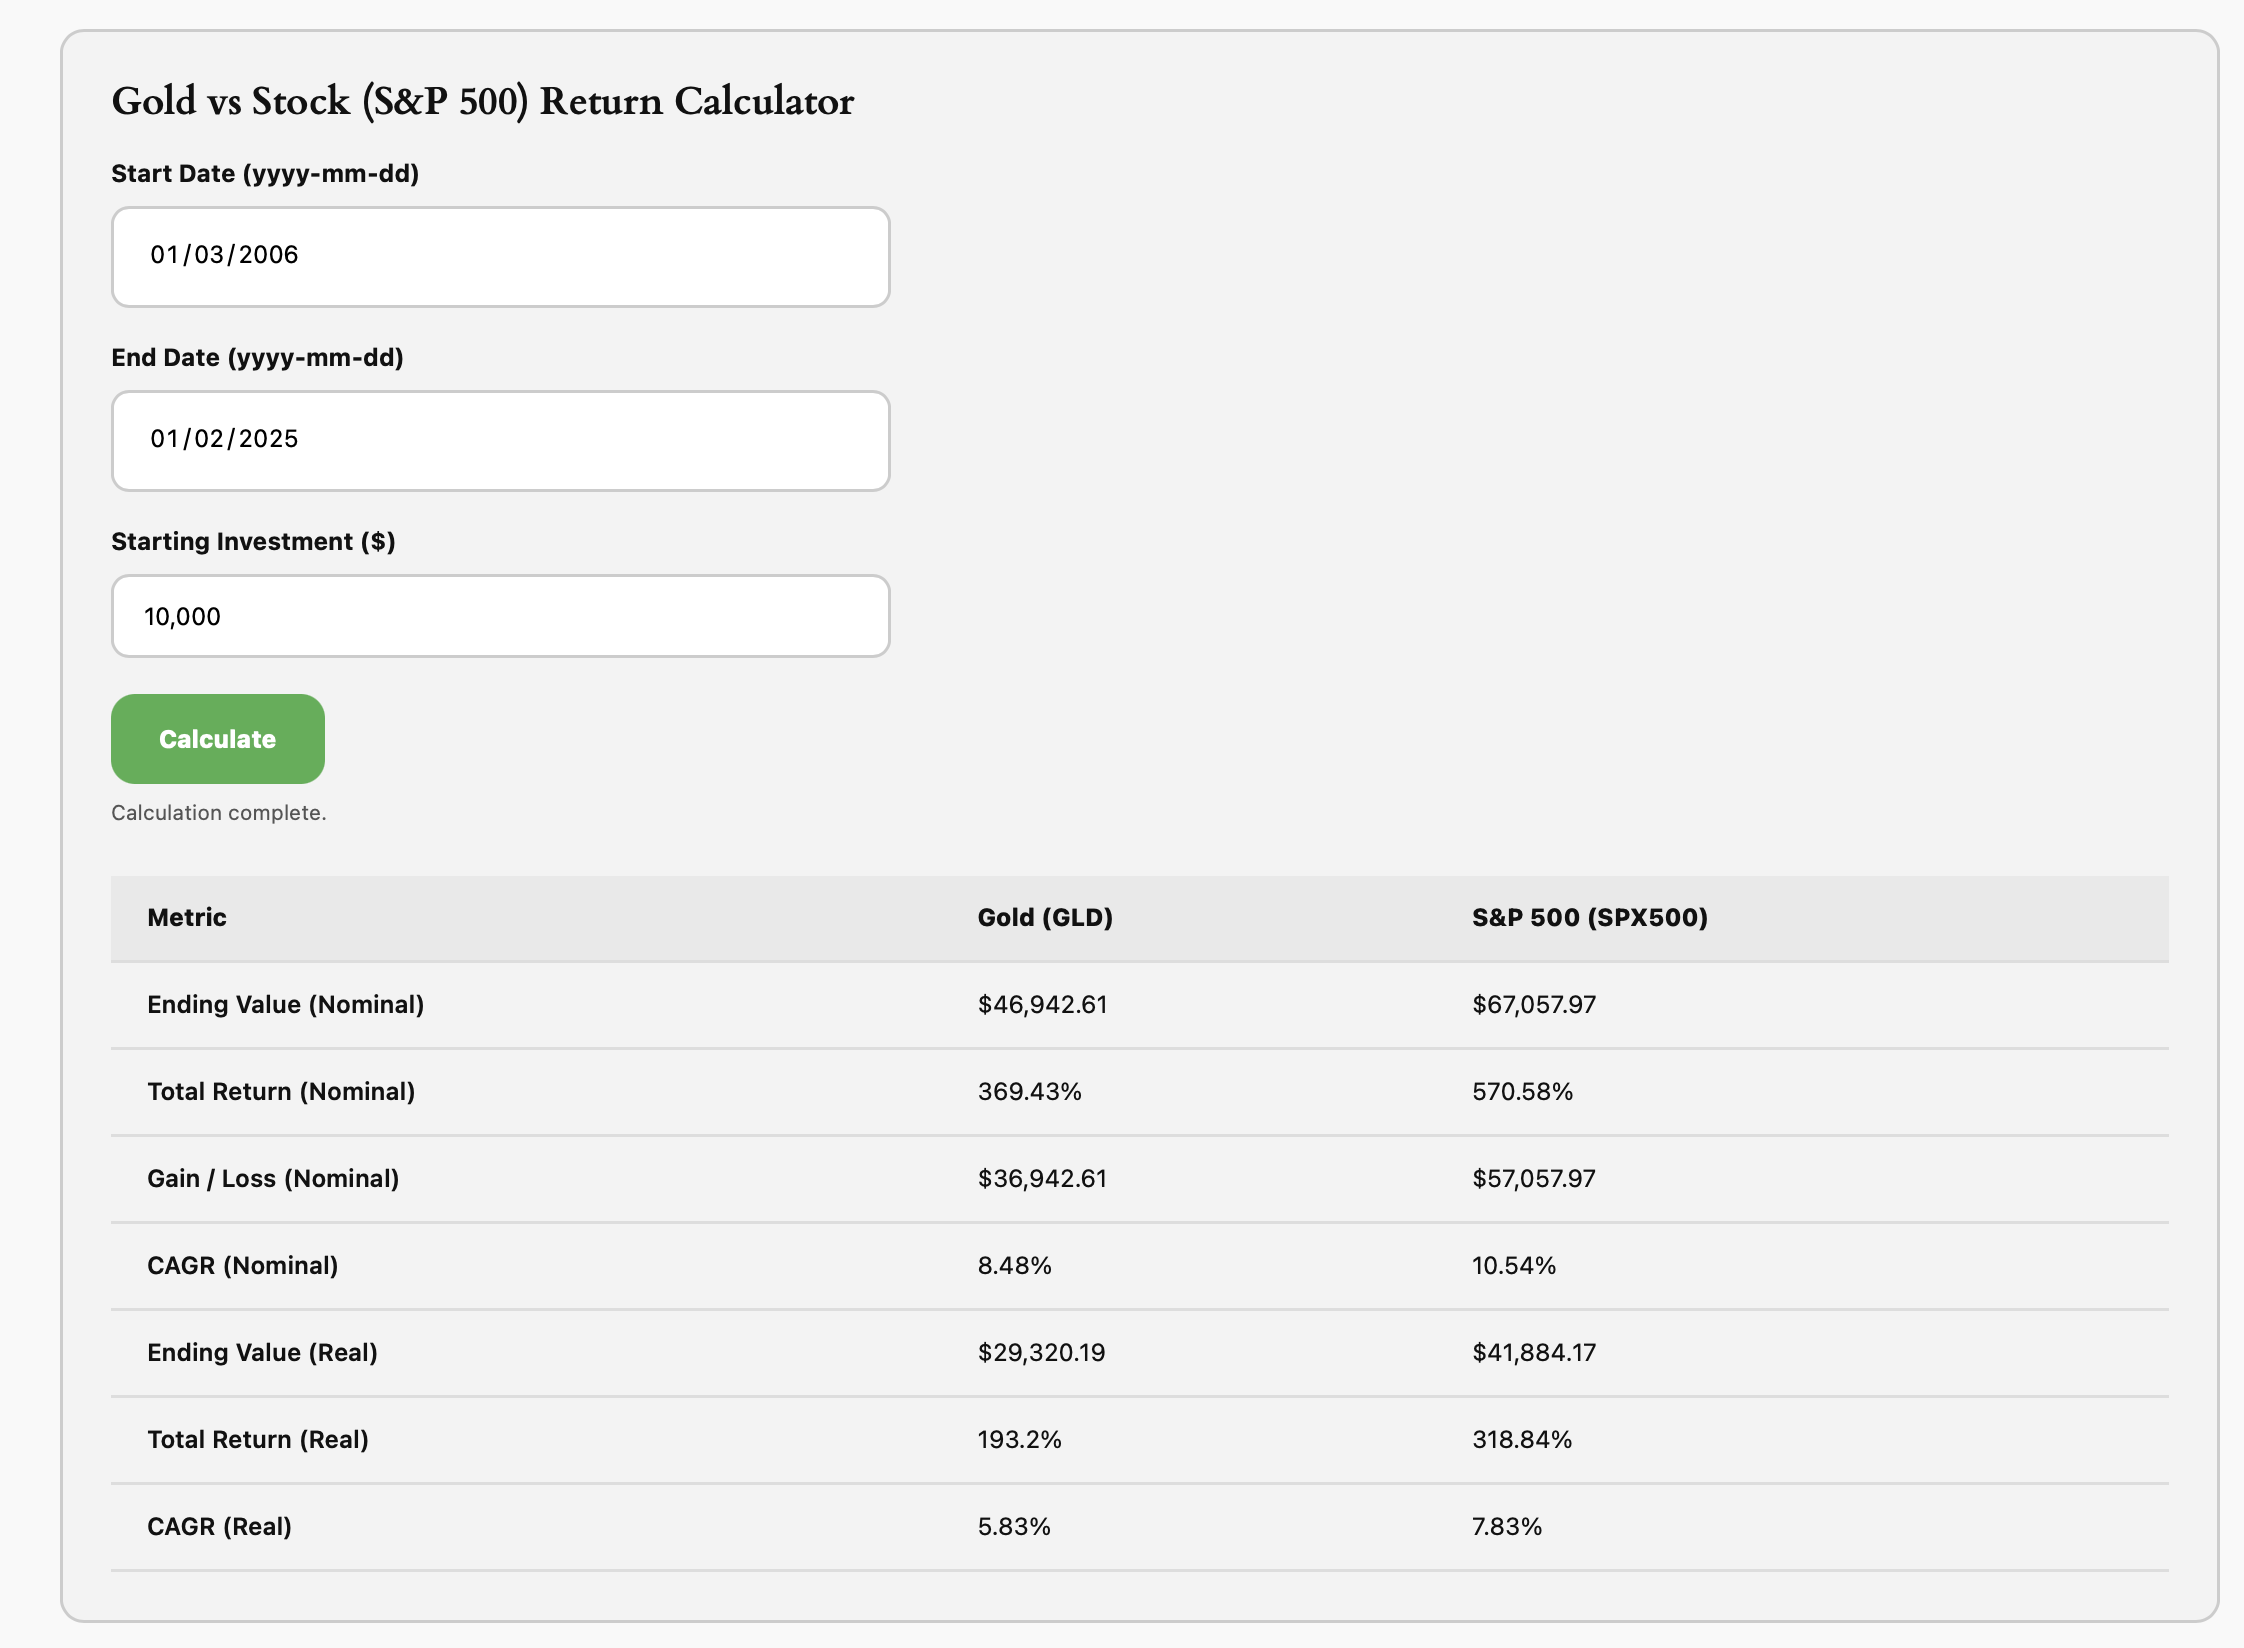
The Gold (GLD) price data start from 1971 and our S&P 500 stock price history dates back to 1871. We are planning to add more historical price data in the future.
Market Overview
Stocks retreated a bit in the last week. All stocks have had big gains in August. Now that we are entering the most volatile September, stocks have started to lose some value.
The following table shows the major asset price returns and their trend scores, as of this Monday:
| Asset Class | 1 Weeks | 4 Weeks | 13 Weeks | 26 Weeks | 52 Weeks | Trend Score |
|---|---|---|---|---|---|---|
| US Stocks | -0.1% | 3.7% | 9.6% | 9.1% | 15.7% | 7.6% |
| Foreign Stocks | -1.3% | 4.5% | 7.2% | 16.0% | 15.8% | 8.4% |
| US REITs | 0.0% | 3.7% | 4.1% | 0.1% | 0.5% | 1.7% |
| Emerging Market Stocks | -0.9% | 3.8% | 9.5% | 15.5% | 17.7% | 9.1% |
| Bonds | 0.0% | 0.0% | 2.1% | 1.8% | 2.7% | 1.3% |
| Hedged Intl Stocks | -1.9% | 4.1% | 4.3% | 6.1% | 12.5% | 5.0% |
More detailed returns and trend scores can be found on MyPlanIQ.com Market Overview.